A list of interesting genome visualizers, genome browsers, or genome-browser-like implementations
See the new companion website here https://cmdcolin.github.io/awesome-genome-visualization/
Follow the BlueSky https://bsky.app/profile/awesomegenomeviz.bsky.social or Mastodon account https://genomic.social/@awesomegenomevisualization
Note that the organization on the GitHub README here is a best effort categorization using the first tag applied to each tool, but tools can have multiple tags too. See the website to see all tags applied to tools
The general focus here is on tools that plot things in genomic or sequence coordinate space
Note: This list runs the gammut from bespoke and simple to more general-purpose and complex tools. Some are historical, or may be for more visual inspiration only
I also encourage you to make your own visualization, things like R, ggplot2, matplotlib, and (the elephant in the room: coding agents, but careful with these, they can hamper your learning if you become overly reliant on them) make this much easier! But also consider making your visualization code re-usable for the wider community! And feel free to send PRs for more tools!
Finally, at least 68% (372/543) tools in this list have written publications for their tools. They went through the effort to write it up, cite these tools!!
New rule: 2026-10-11 I will no longer be accepting tools without source available. I don't want feel inspired to share source-not-available vibe-coded tools in this repo. Rare exceptions may be made for commercial vendors that have unique functionality in line with pre-existing commercially tagged tools, or certain web based tools (e.g. my Silo tag), where sharing the code is not feasible.
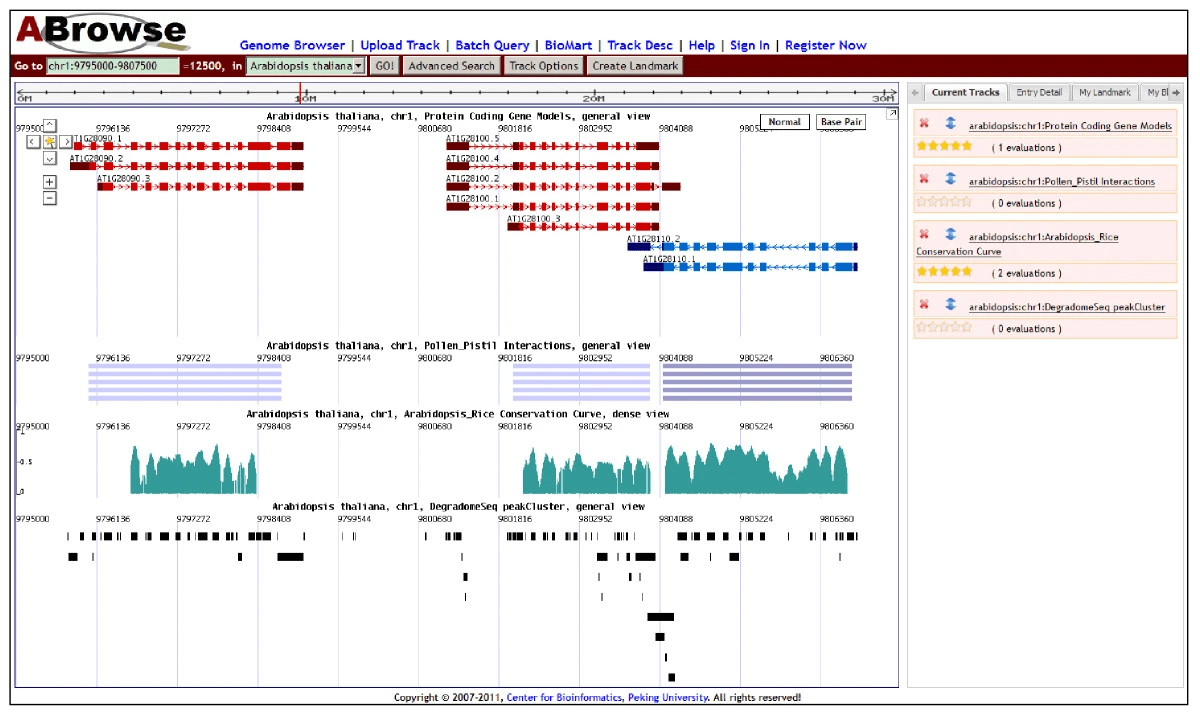
- ABrowse (genome browser) (Had integrations with BioMart, Taverna) (img)
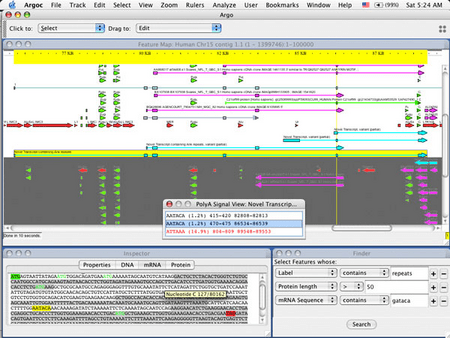
- Argo (img)
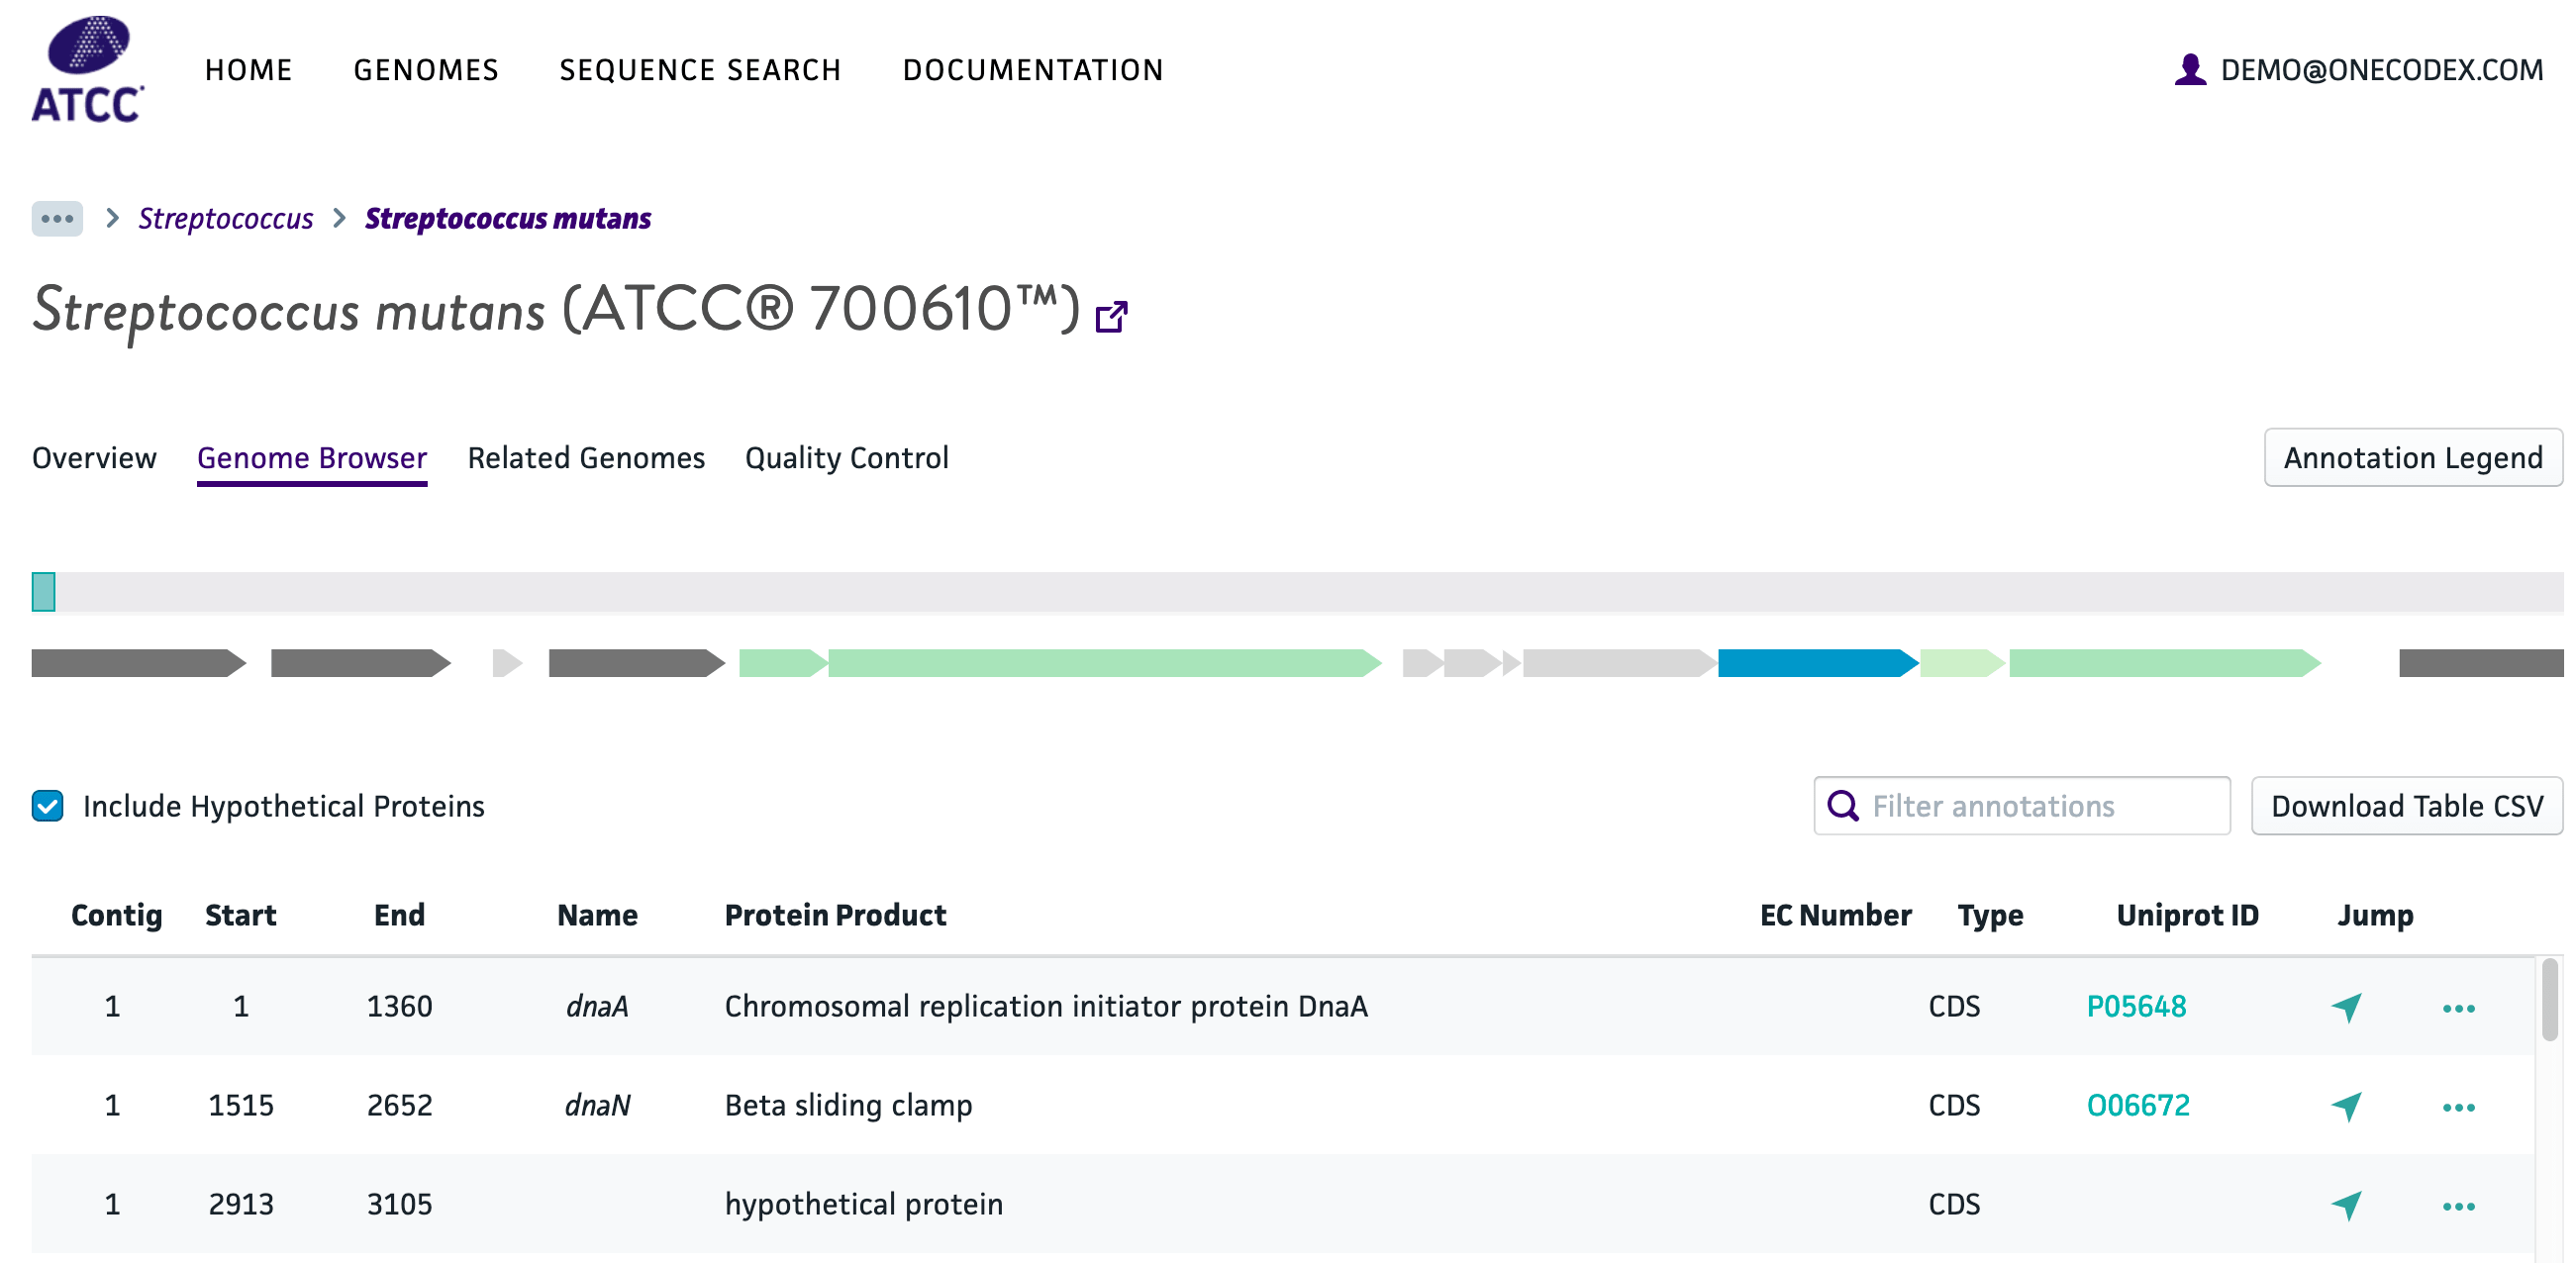
- ATCC Genome Portal (img)
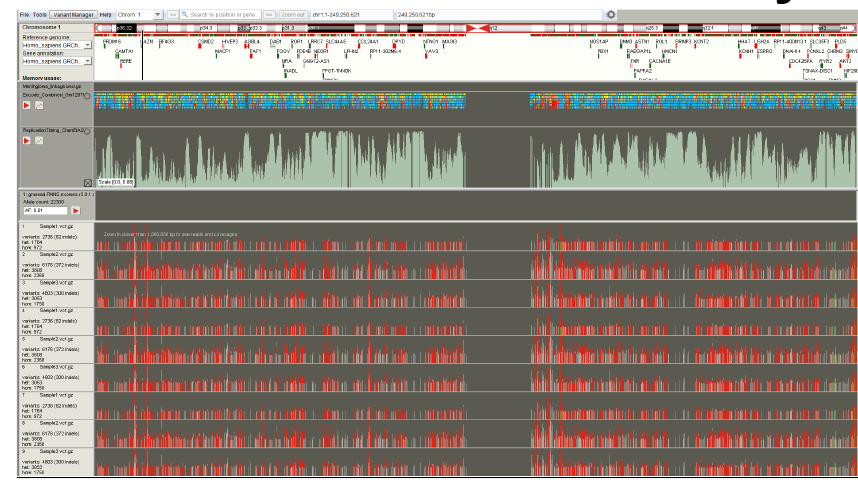
- BasePlayer (img)
- Biodalliance (img)
- Biodalliance comparative demo (img)
- Celera genome browser (img)
- cisGenome Browser (img)
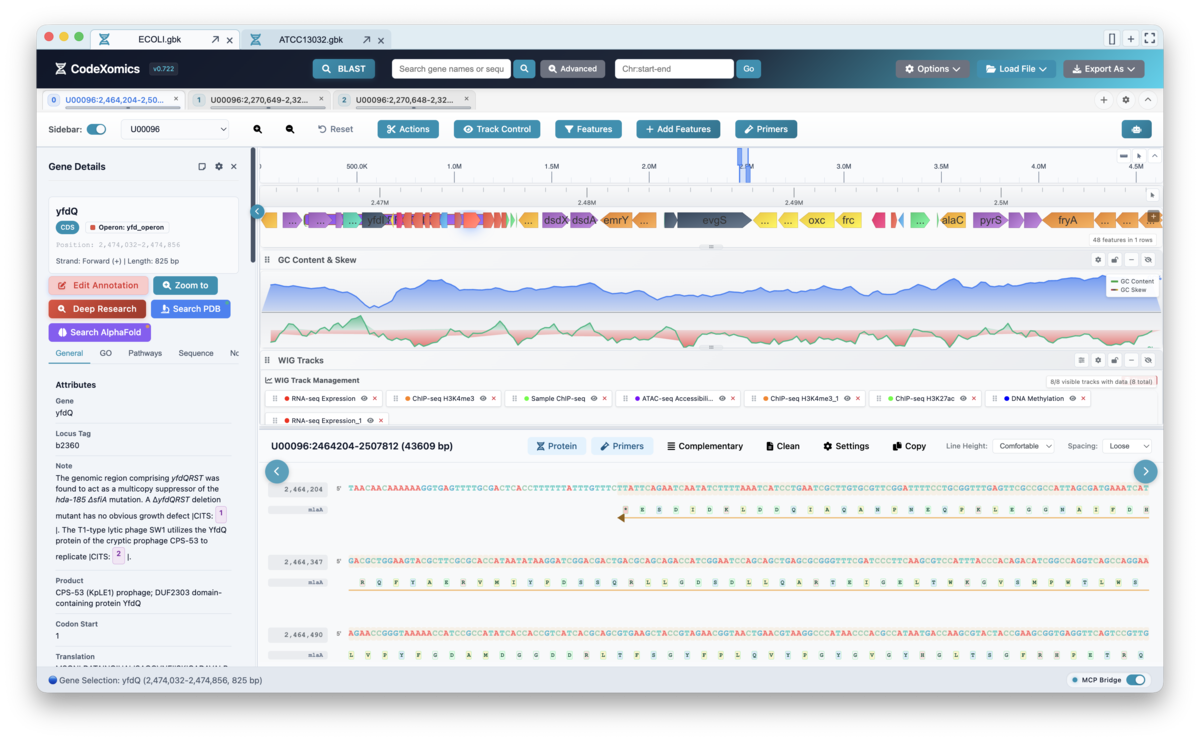
- CodeXomics (AI-native genome browser: conversational agents drive the view and run BLAST, primer design, and structure lookups; MCP server and plugin architecture included) (img)
- CrossBrowse (img)
- DNASTAR (img)
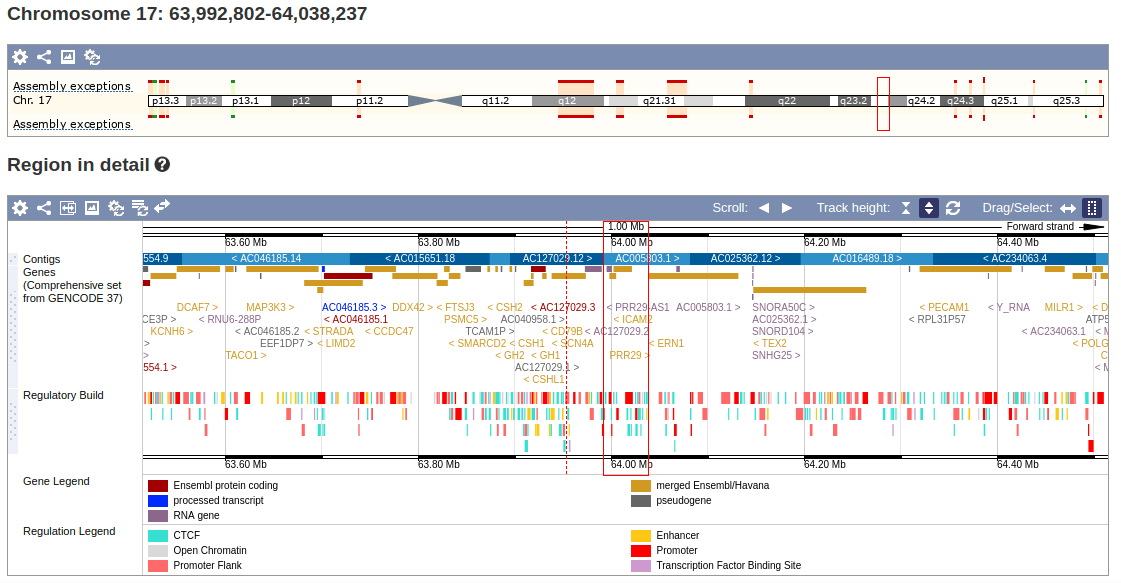
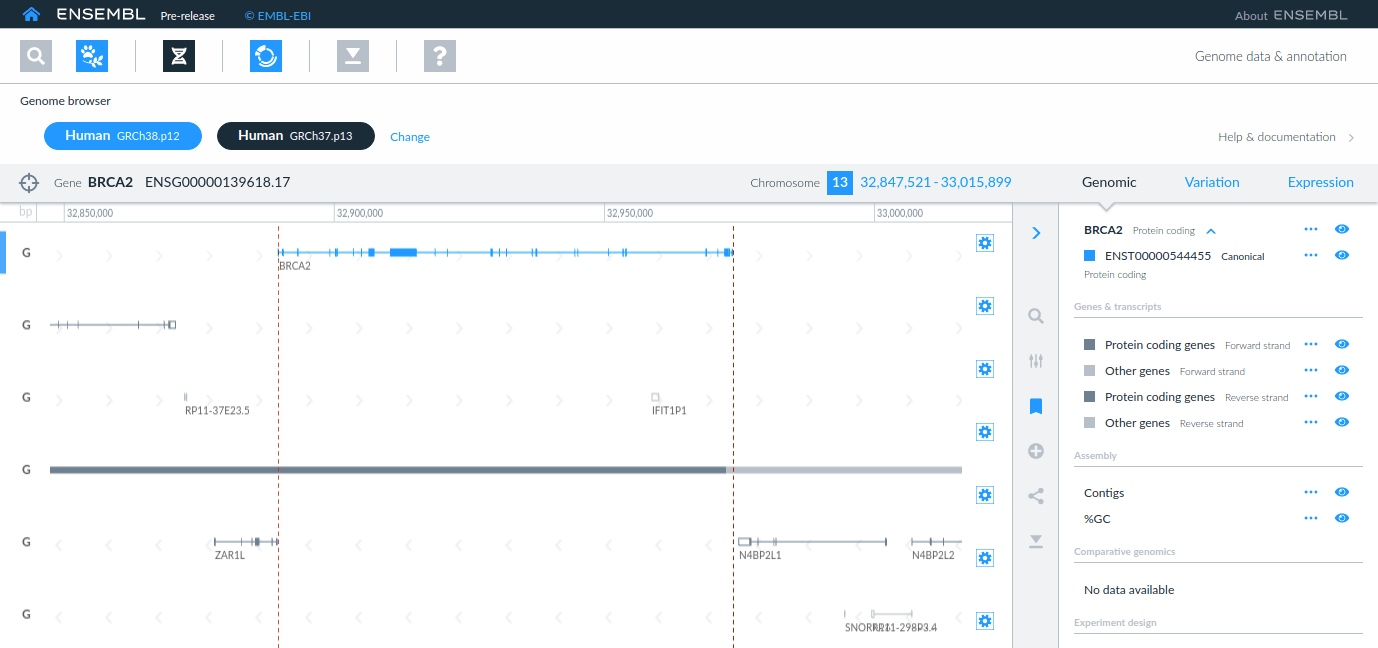
- Ensembl genome browser (img)
- Ensembl genome browser 2020 edition (img)
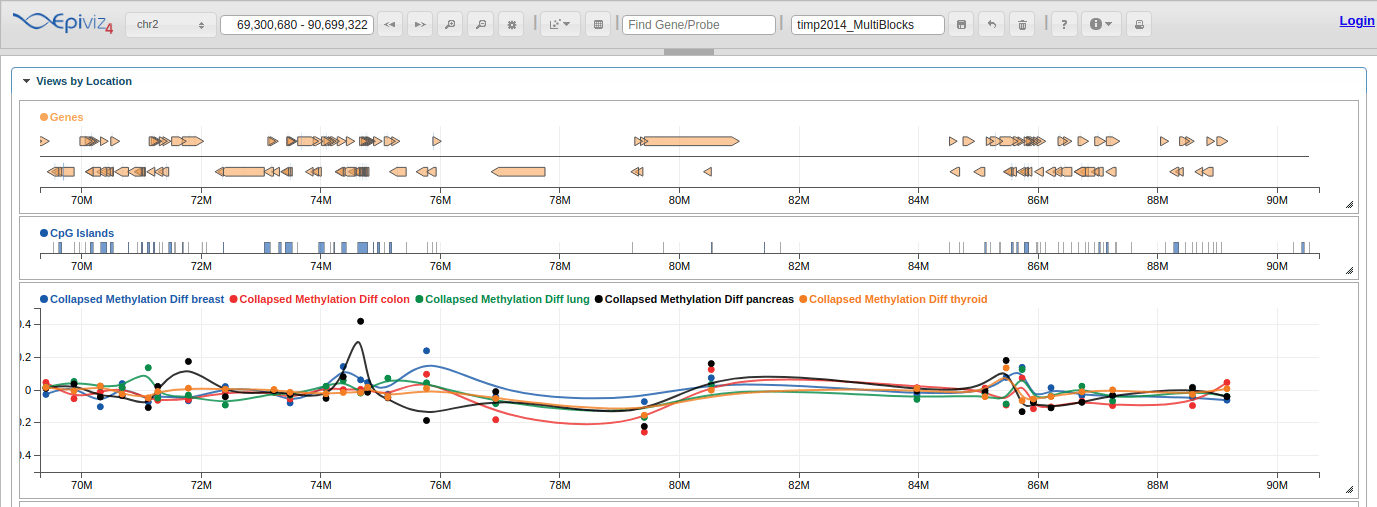
- Epiviz (img)
- GBrowse 2 (Original gbrowse paper https://doi.org/10.1101/gr.403602) (img)
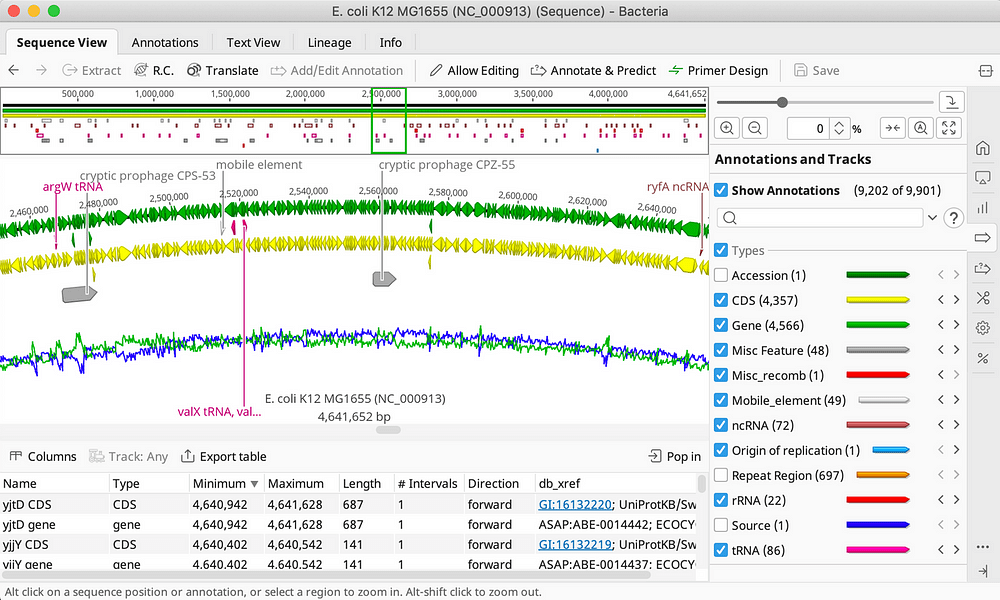
- Geneious (img)
- Genestack (img)
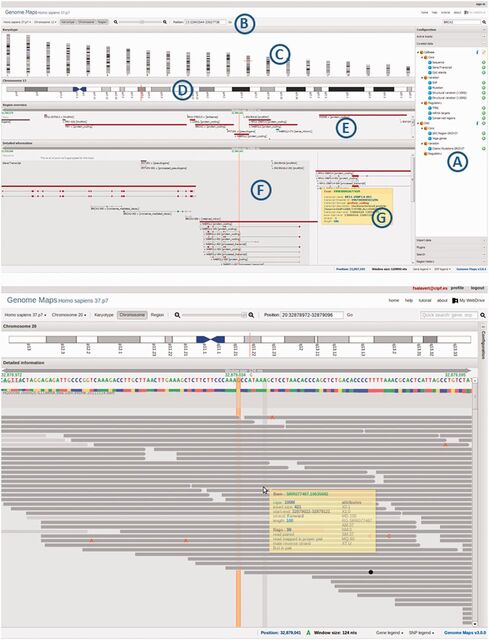
- GenomeMaps (img)
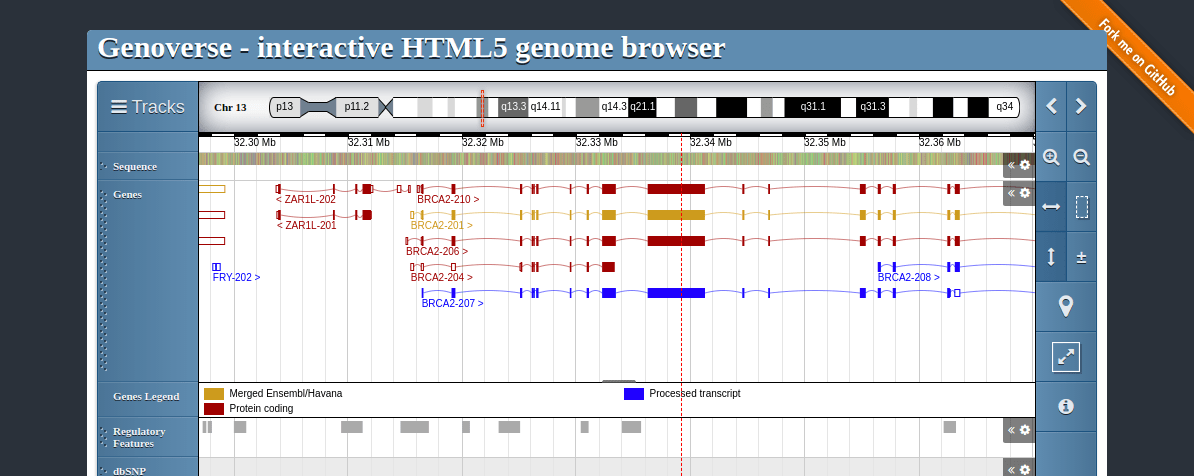
- Genoverse (img)
- Golden Helix (Free for academic use) (img)
- Gosling (Comparative views are limited to band tracks, see https://gosling.js.org/?example=BAND) (img)
- gtracks (Powered by pyGenomeTracks) (img)
- HiGlass (img)
- IGB (img)
- IGV (img)
- IGV.js (img)
- JBR (Not open source, at least not on github) (img)
- JBrowse (See also JBrowse plugin registry https://gmod.github.io/jbrowse-registry. Runs on the web or as a desktop app using Electron) (img)
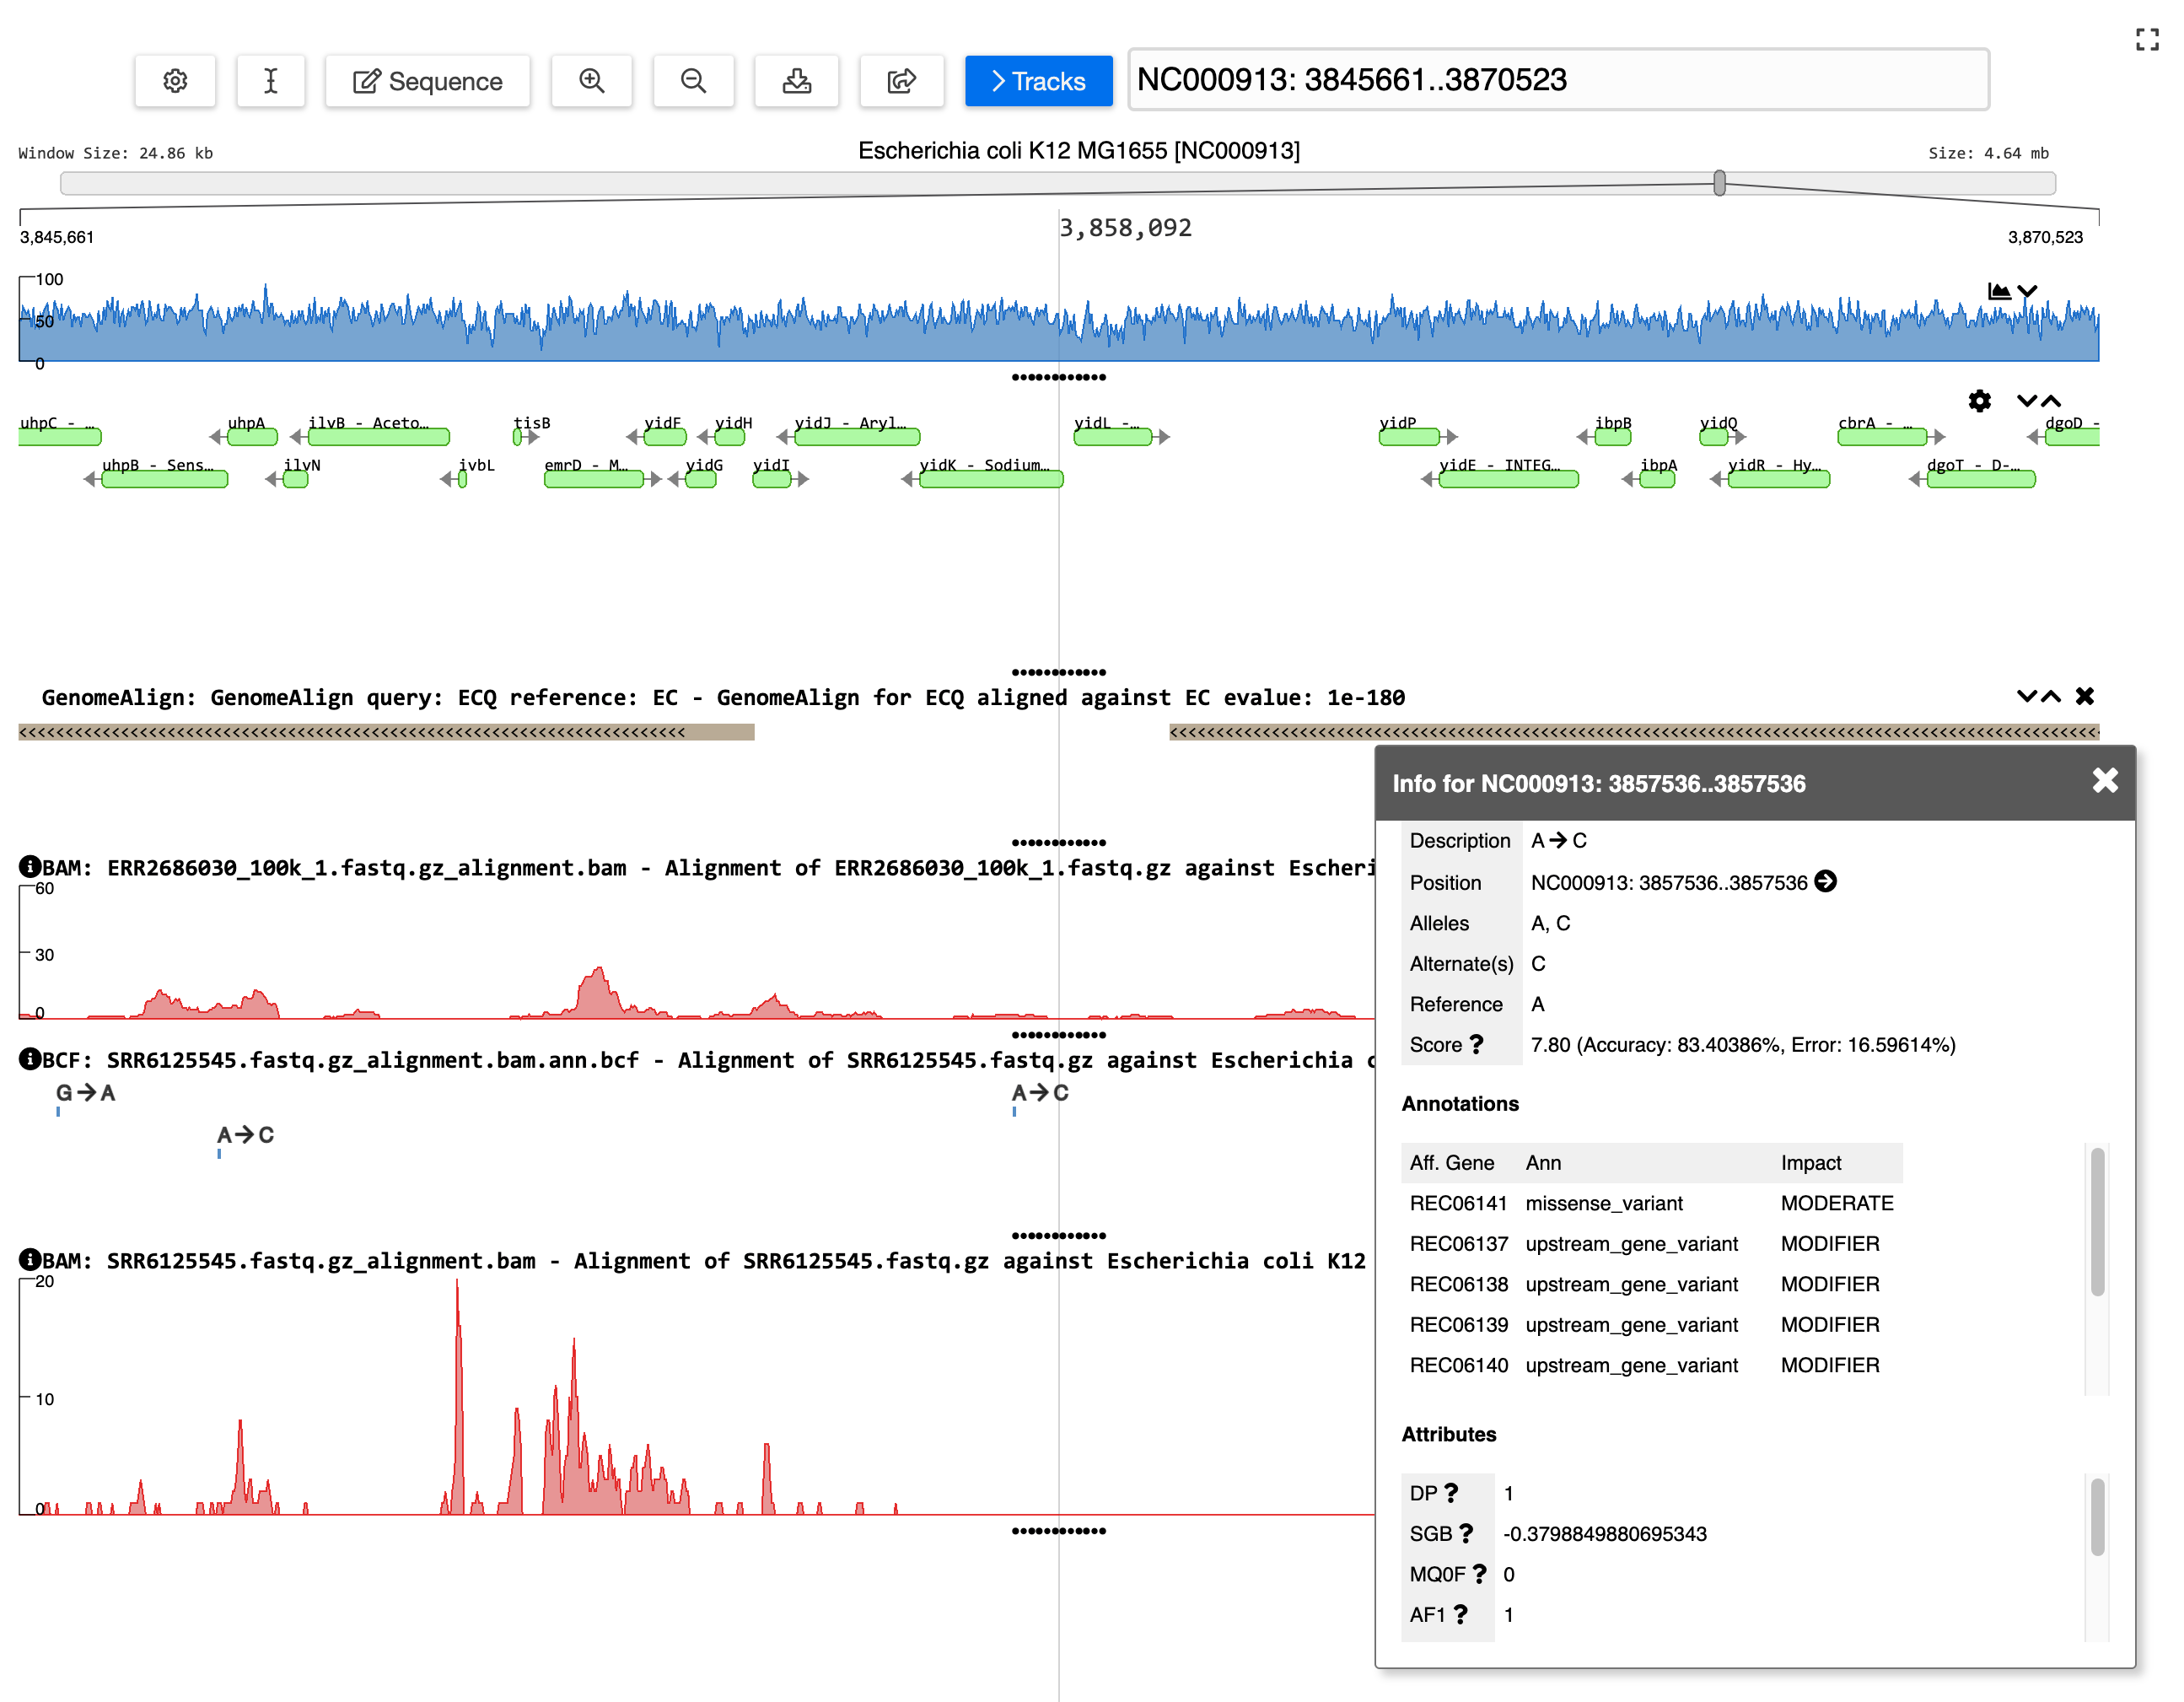
- JBrowse 2 (See gallery for more examples https://jbrowse.org/jb2/gallery) (img)
- Kero-BROWSE (Also can visualize basic synteny, see tracks e.g. https://kero.hgc.jp/tool/keyword.html#kero:chrX:153,724,868-153,744,762 human vs chimp) (img)
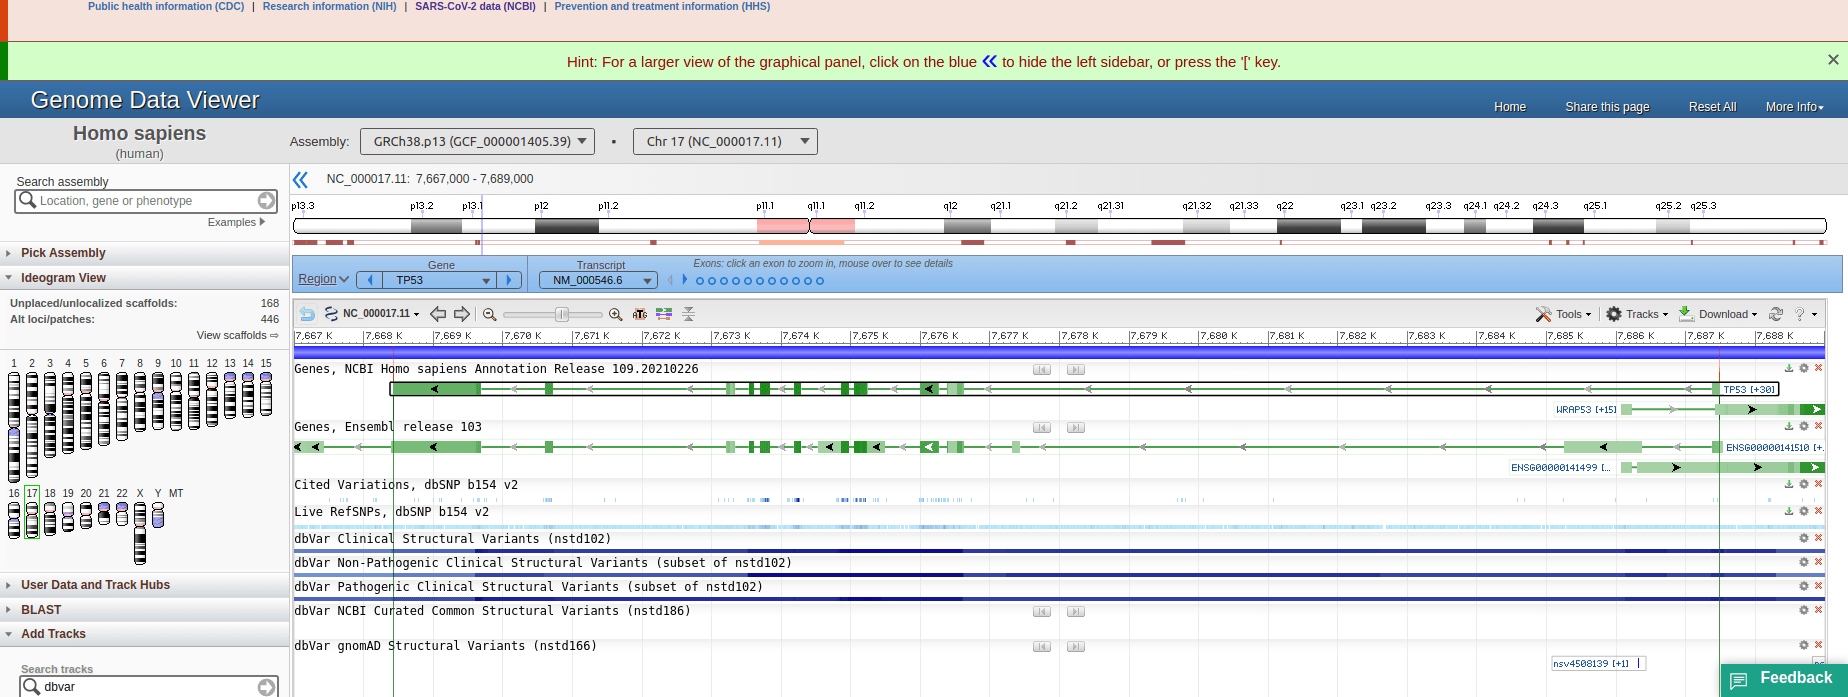
- NCBI Genome Data Viewer (img)
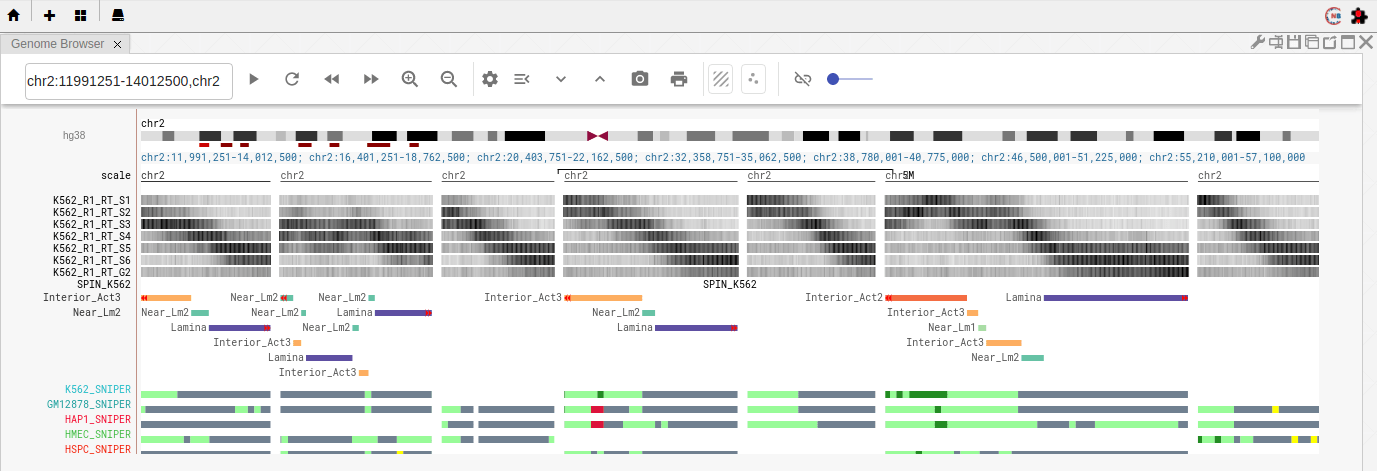
- Nucleome browser (github at https://github.com/nucleome) (img)
- Panoptes (img)
- Persephone (img)
- Pileup.js (img)
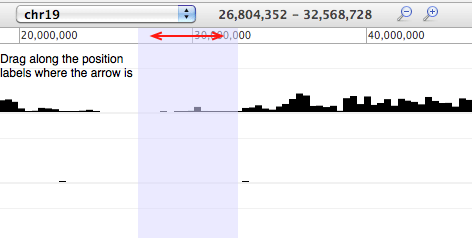
- Savant (img)
- Strand NGS (img)
- Sushi (img)
- svist4get (img)
- SWAV (img)
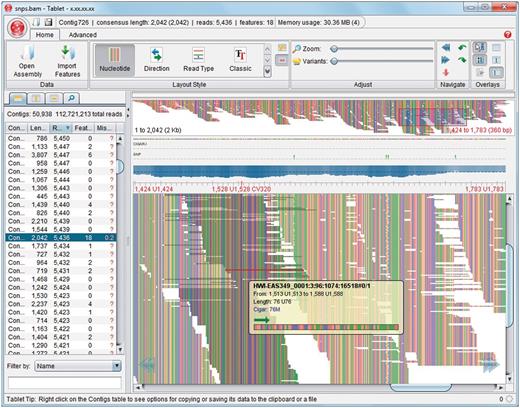
- Tablet (img)
- trackplot (python) (img)
- Trackster (img)
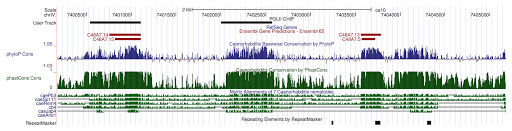
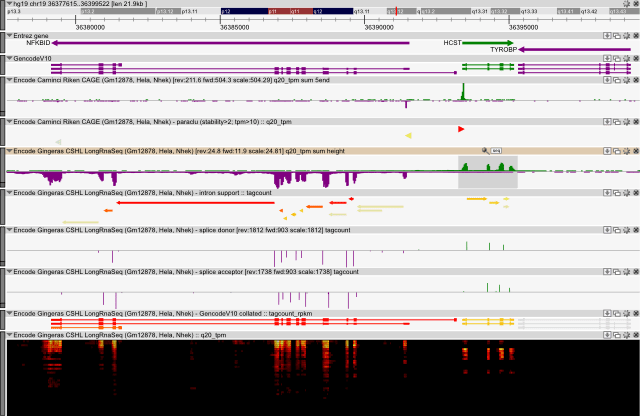
- UCSC genome browser (img)
- UGENE (img)
- UTGB (University of Tokyo Genome Browser) (img)
- Valis browser (img)
- WashU epigenomics browser (The ReactJS is a redesign, there is also a legacy version. Note also, there are comparative features https://www.biorxiv.org/content/10.1101/2022.11.29.518374v1) (img)
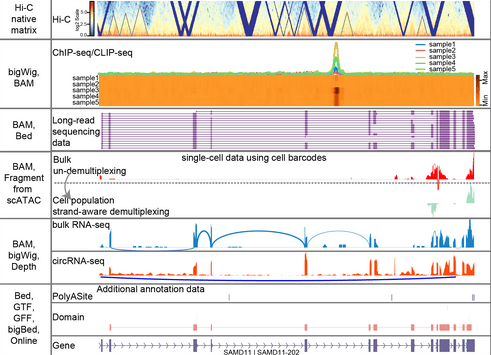
- Zenbu (img)
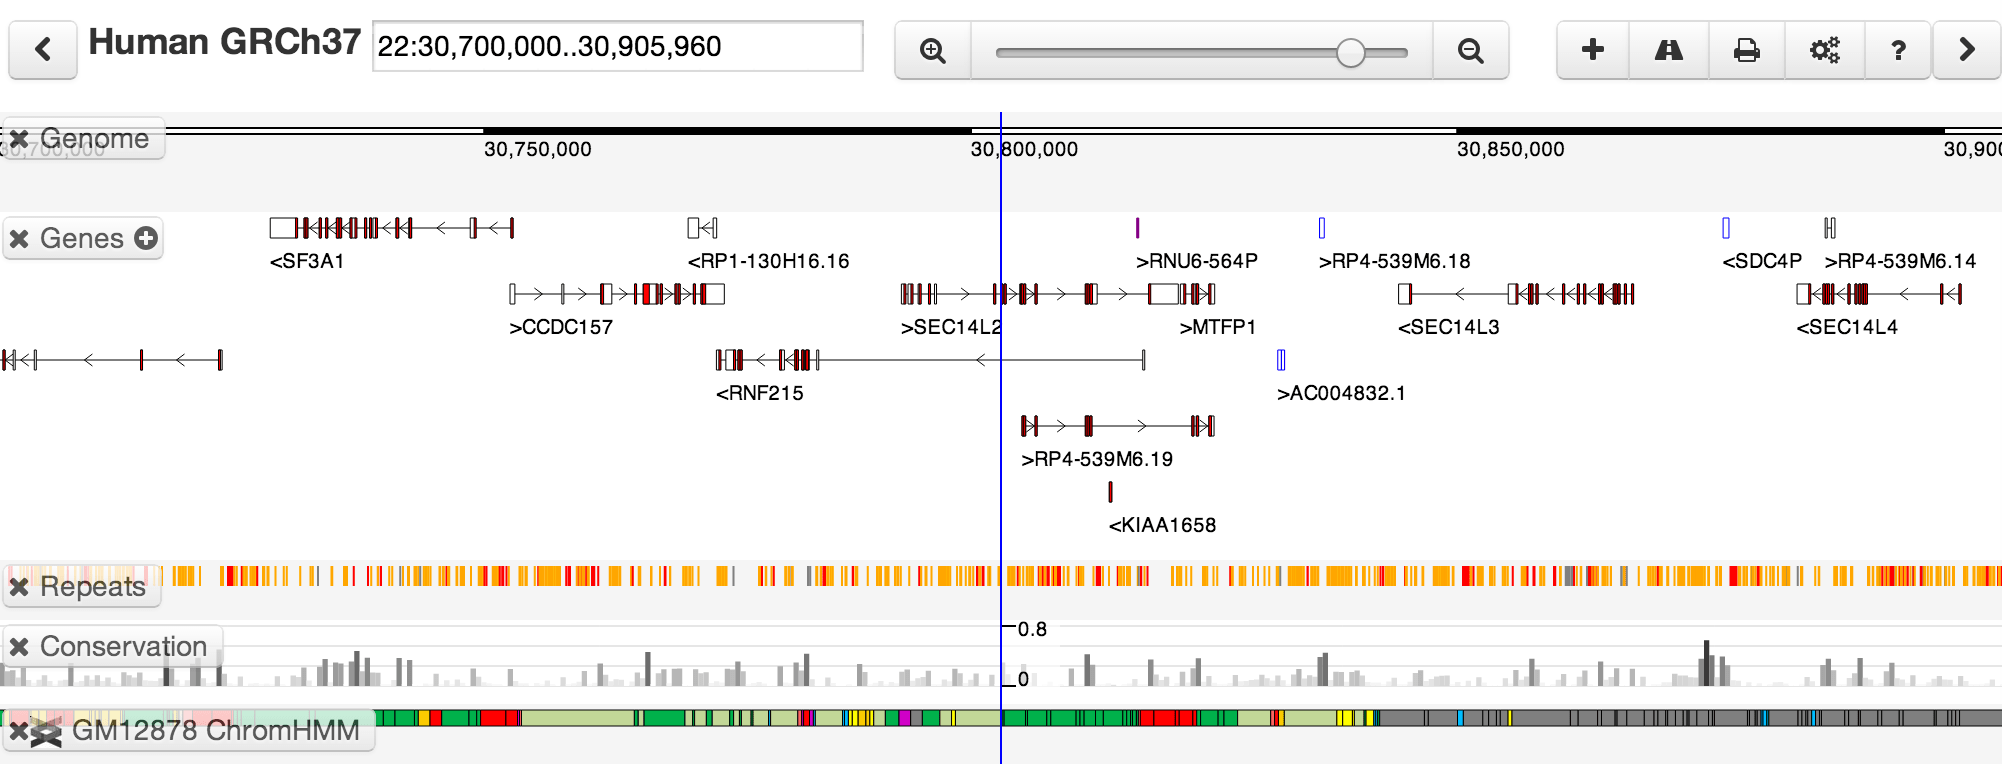
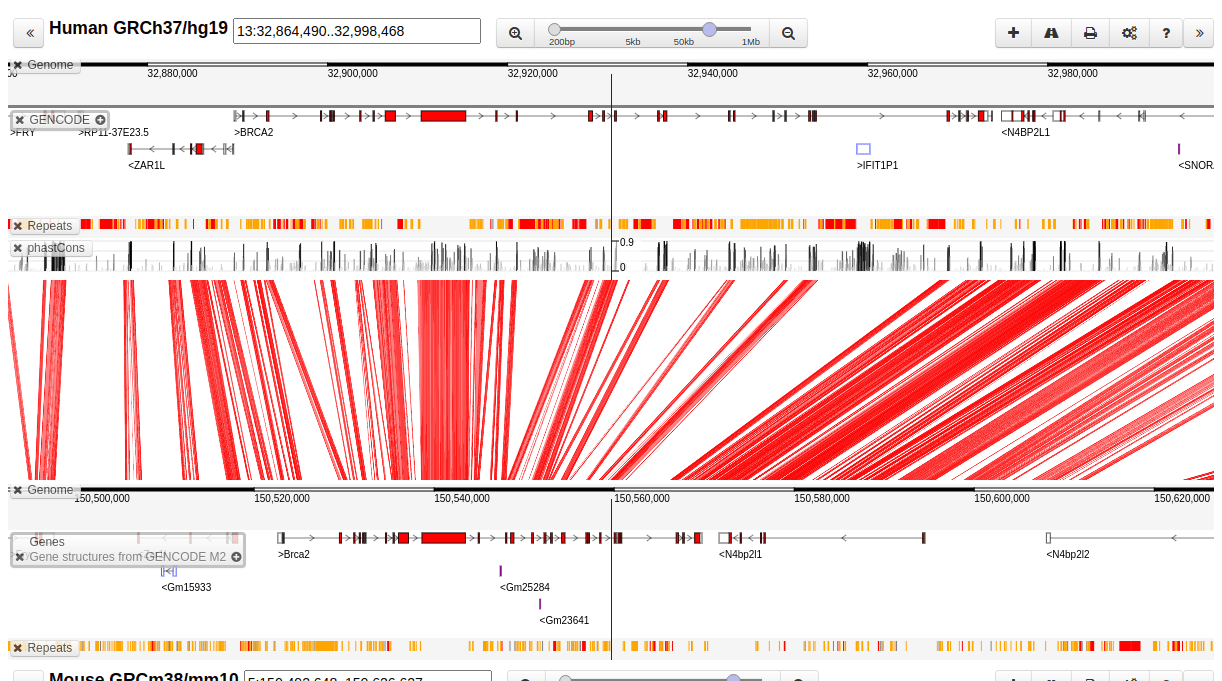
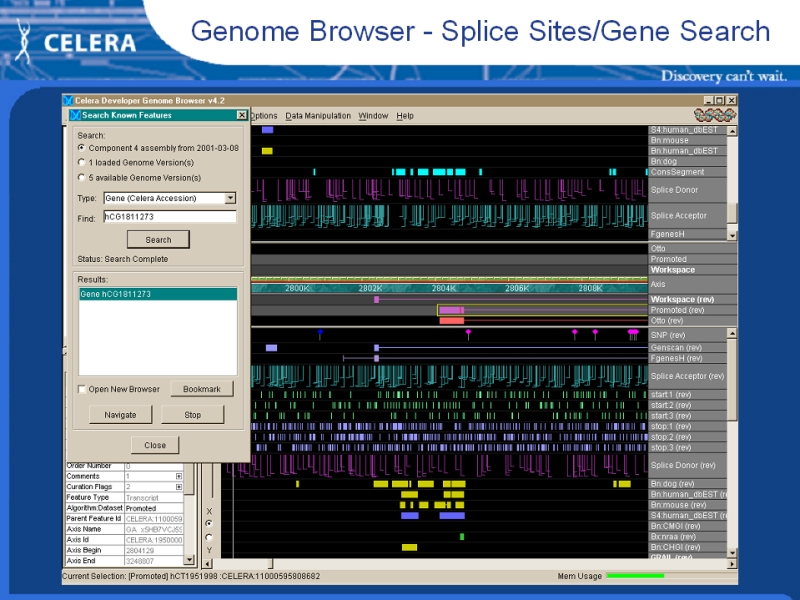
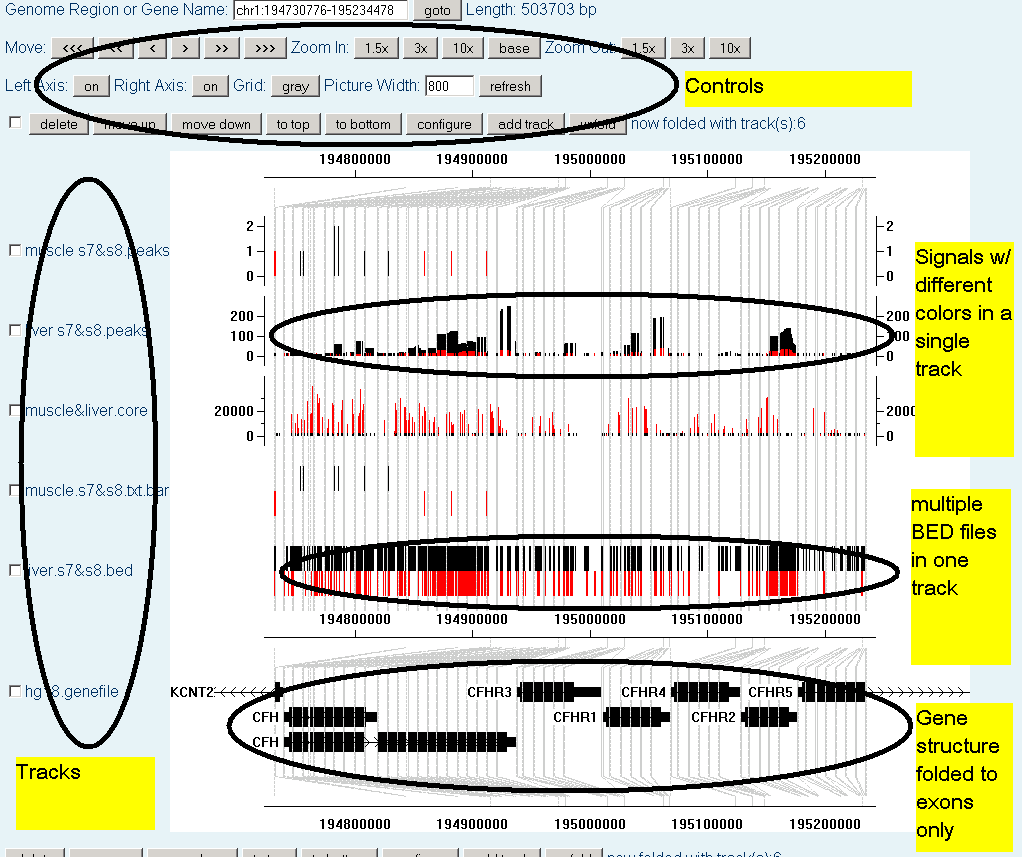
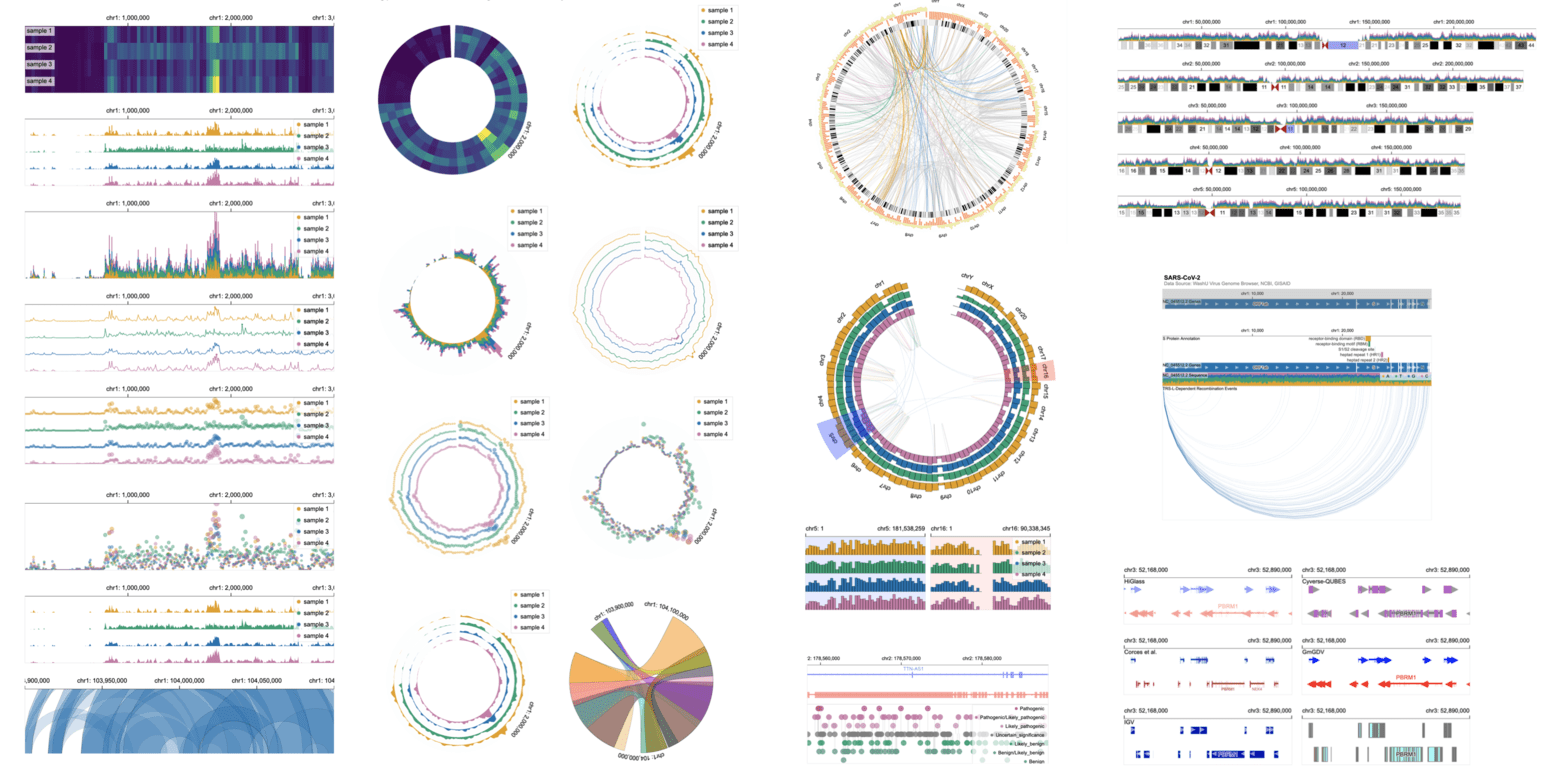
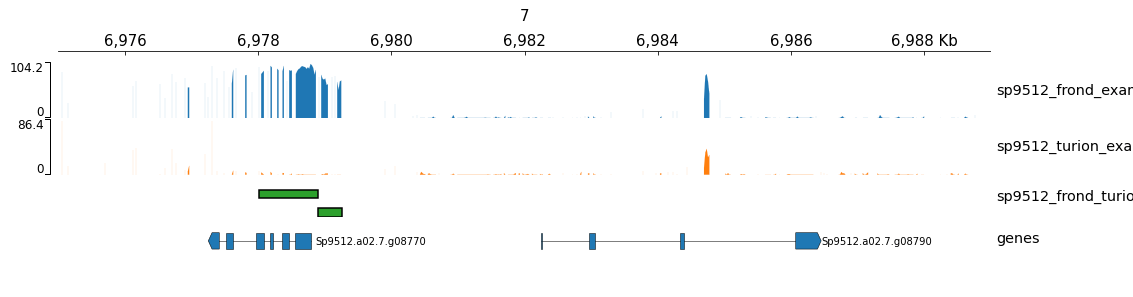
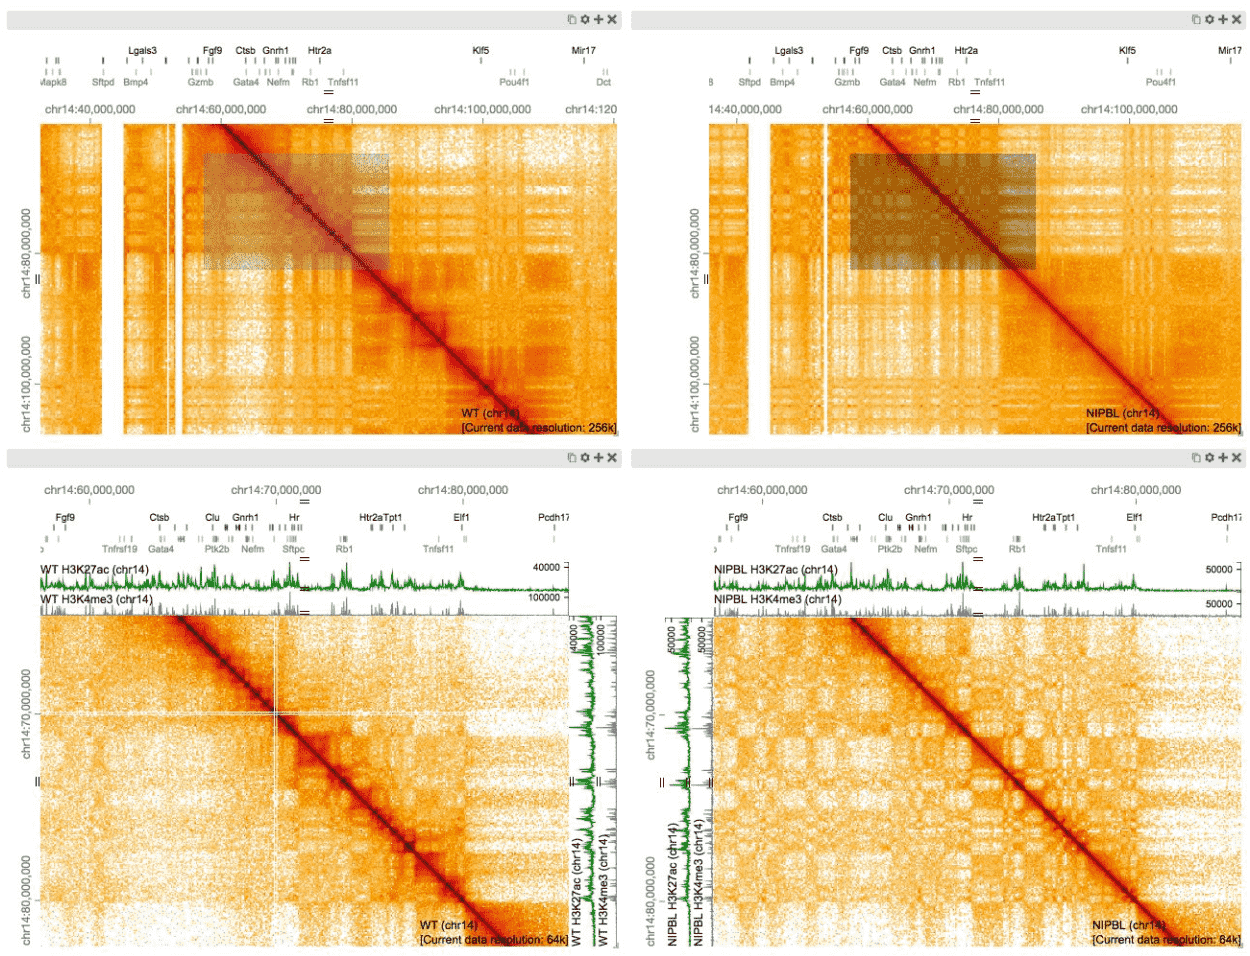
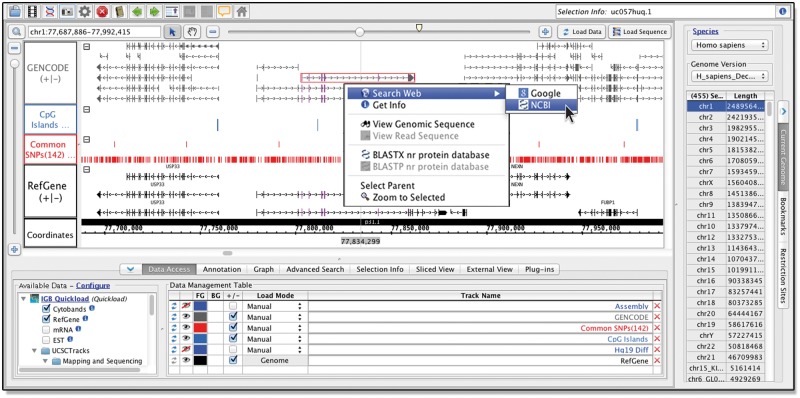
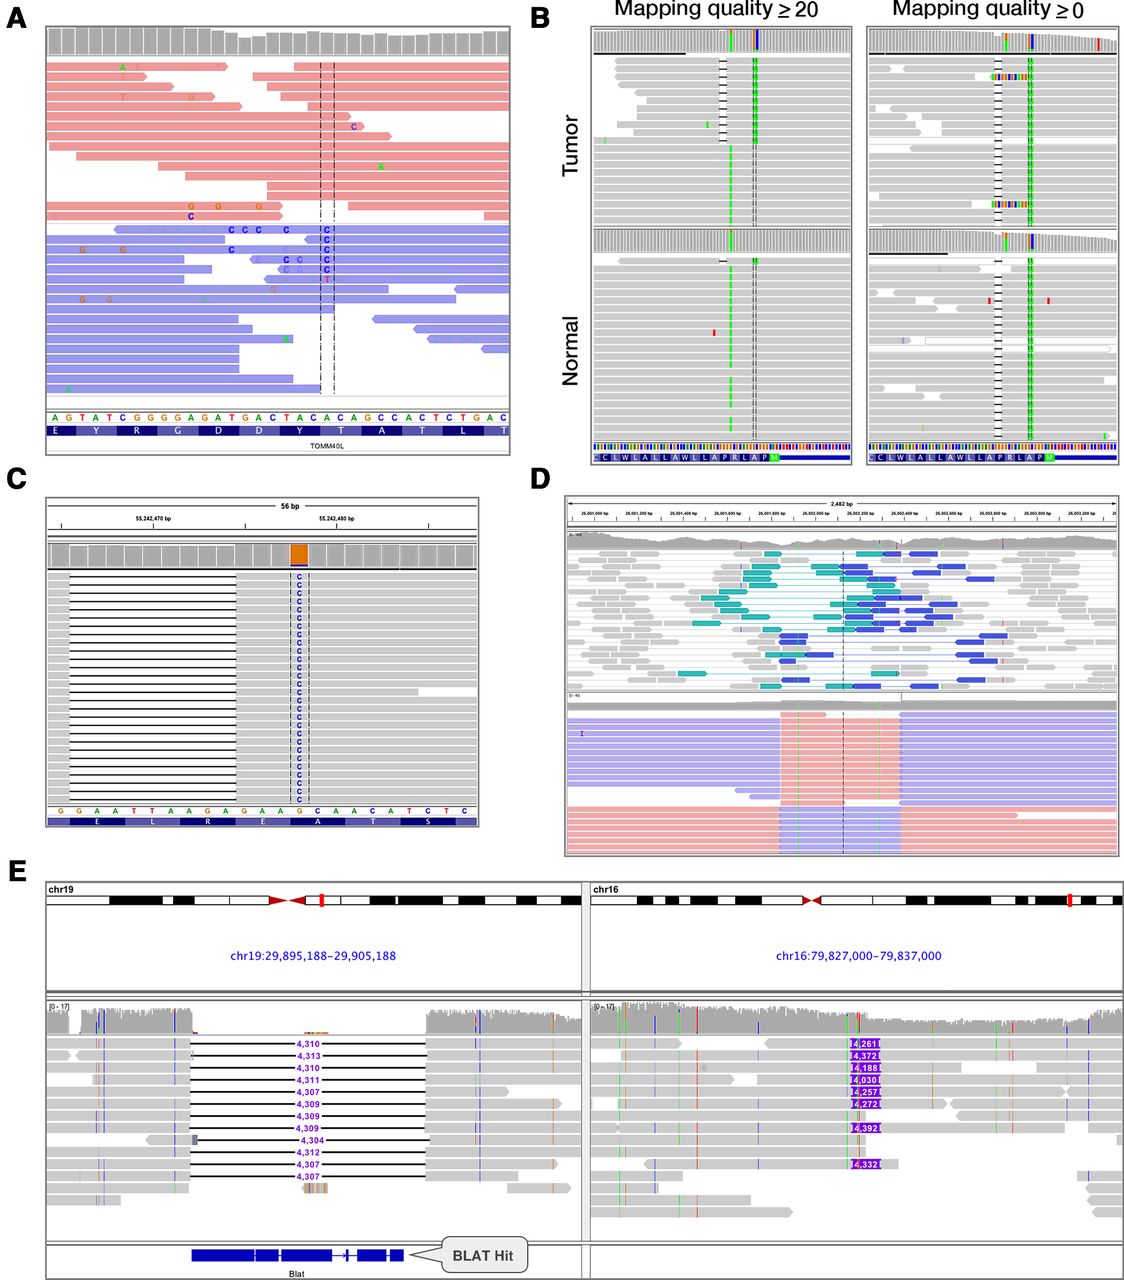
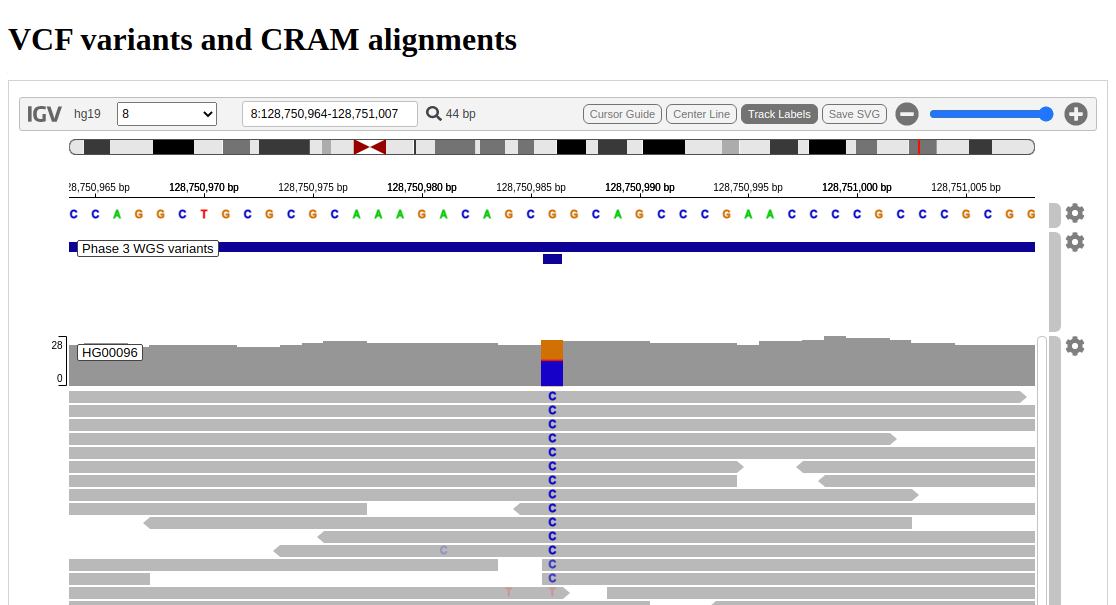
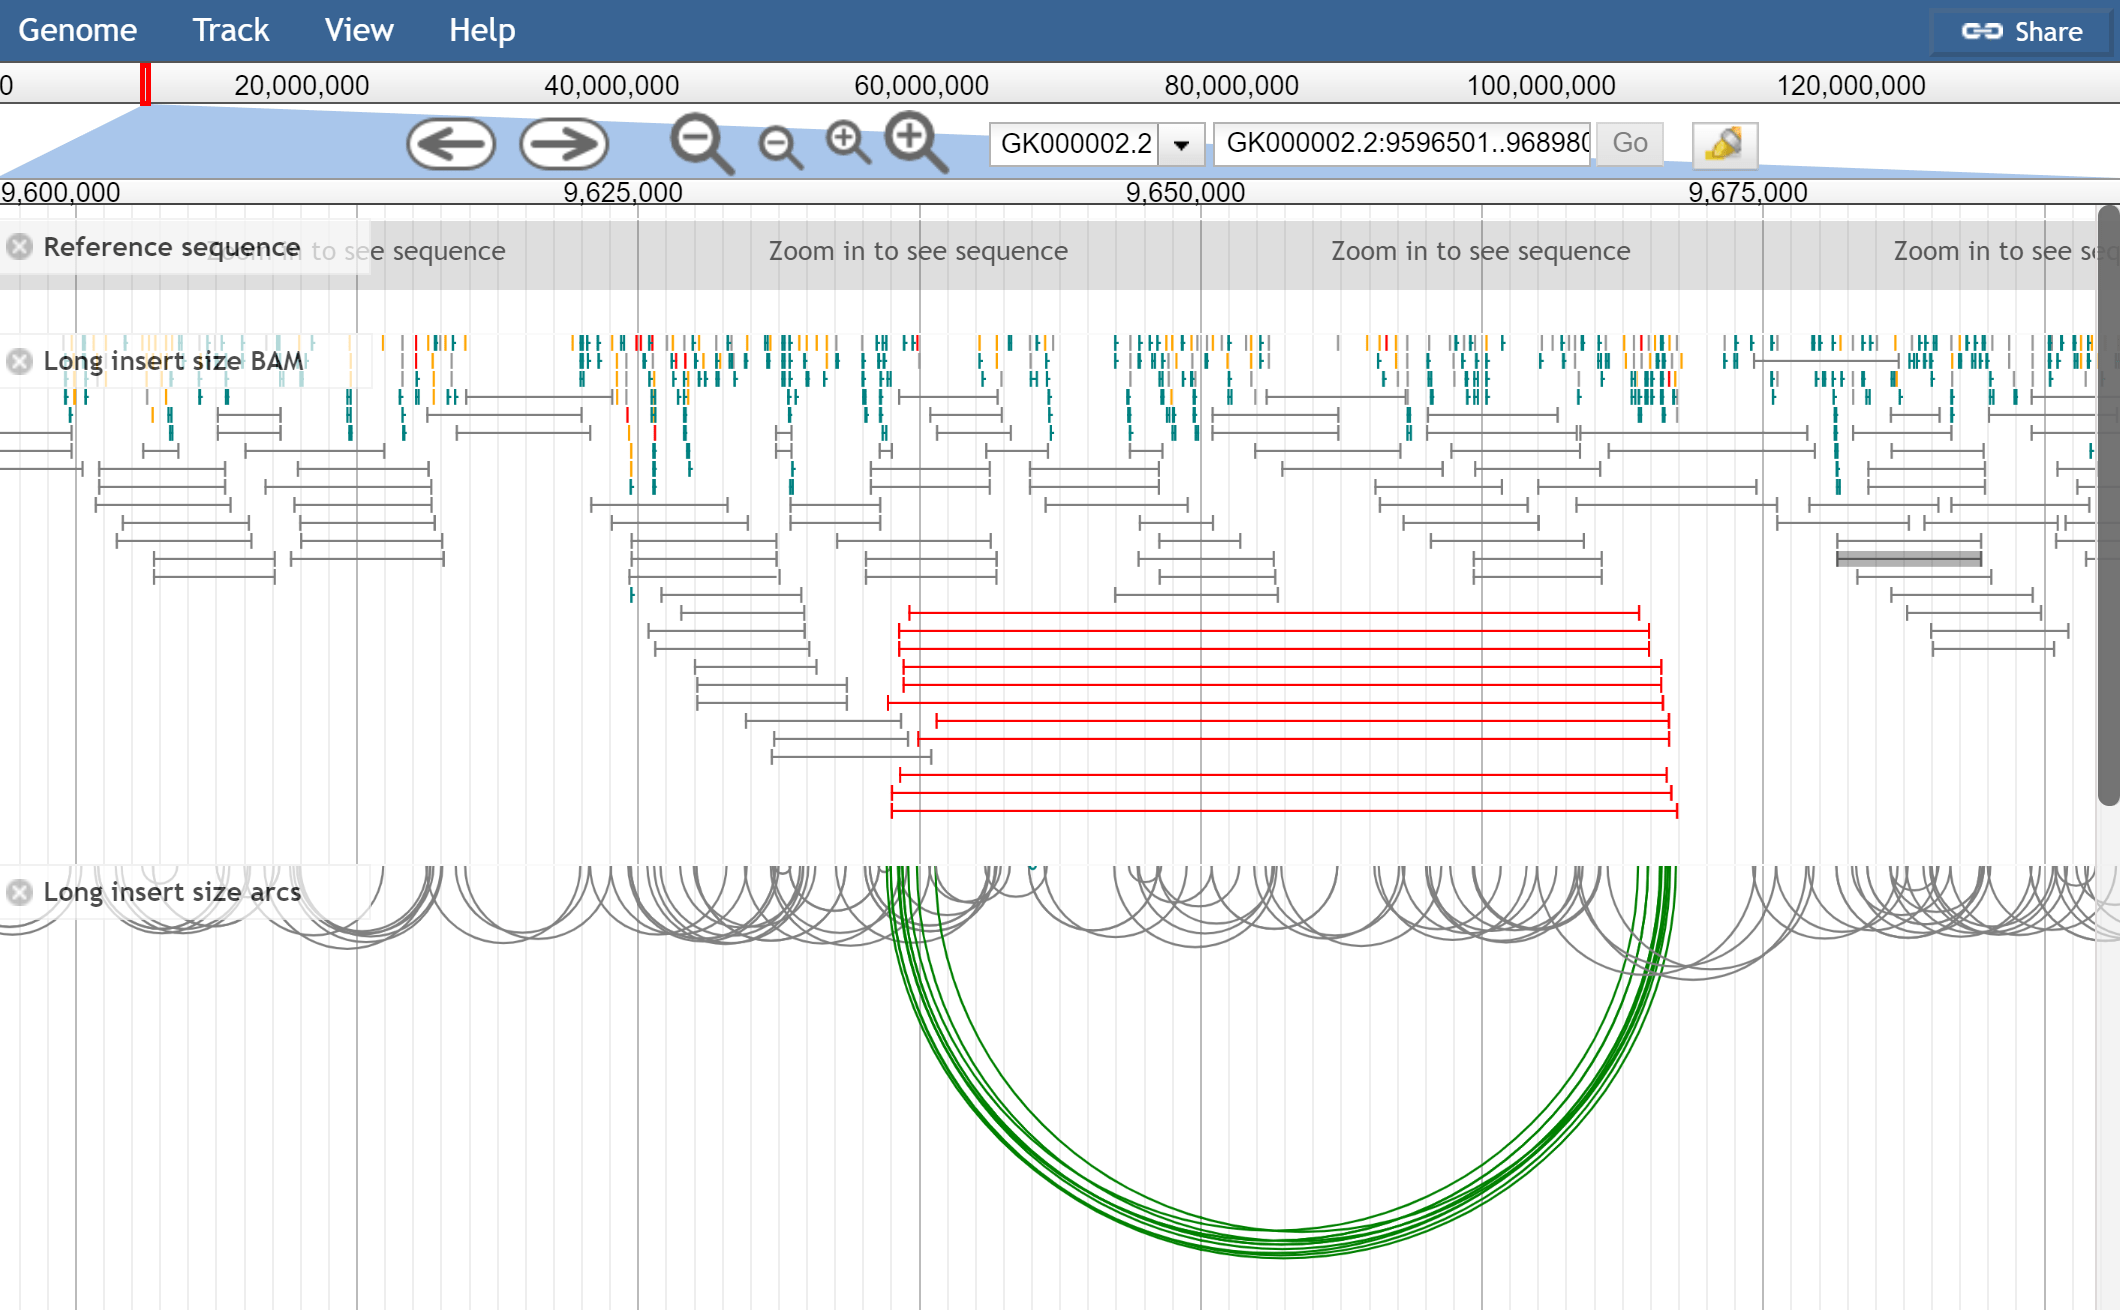
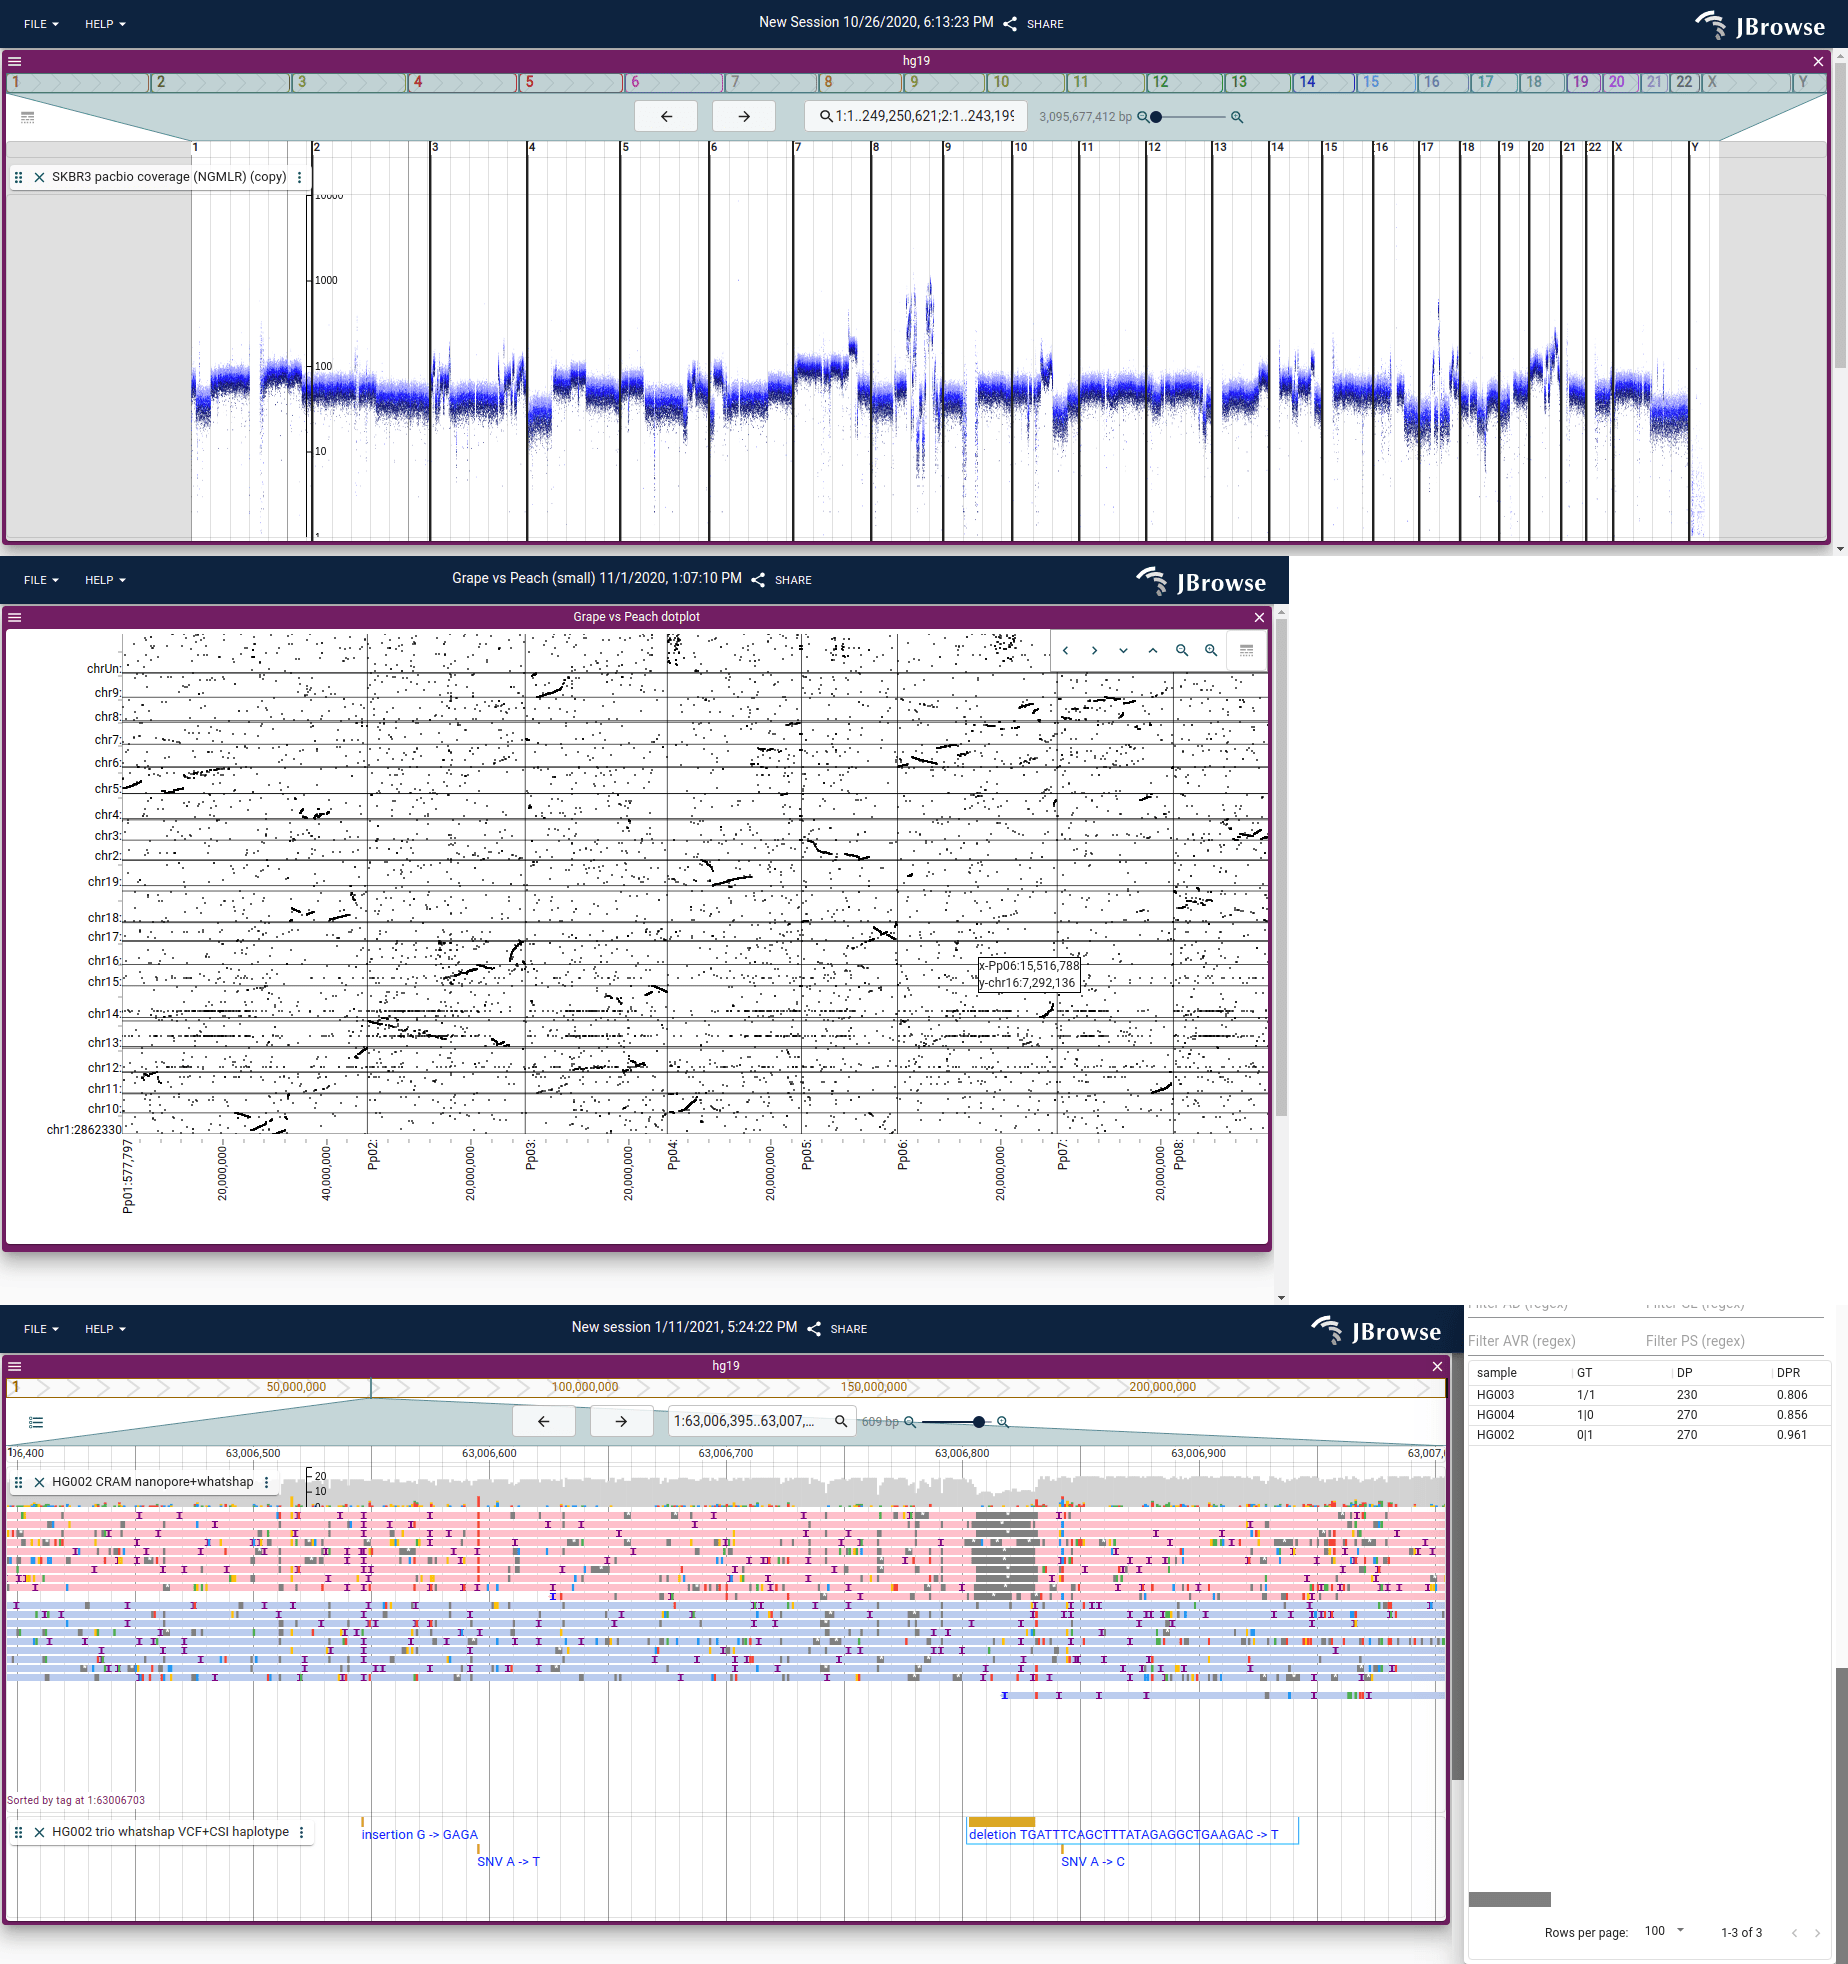
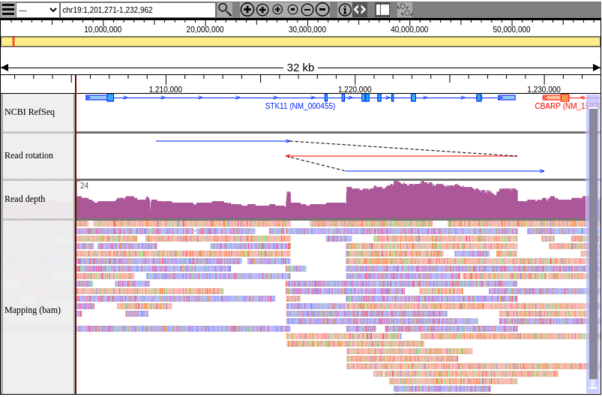
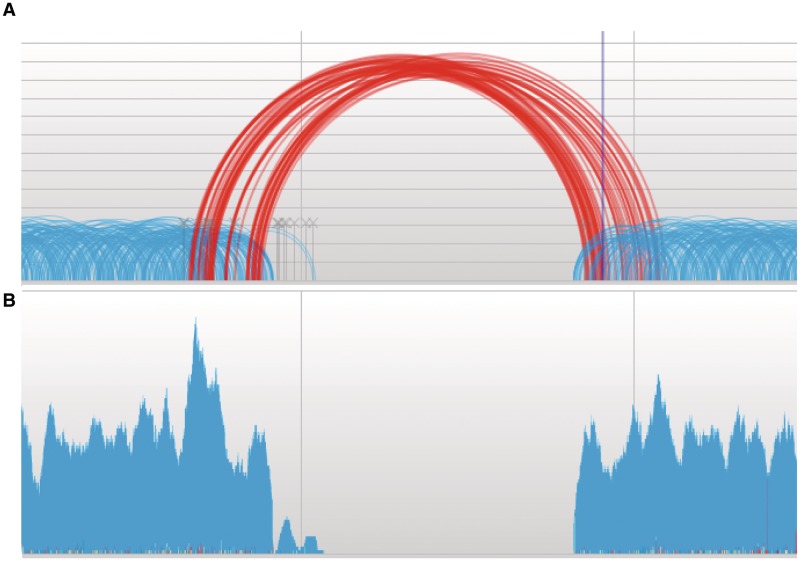
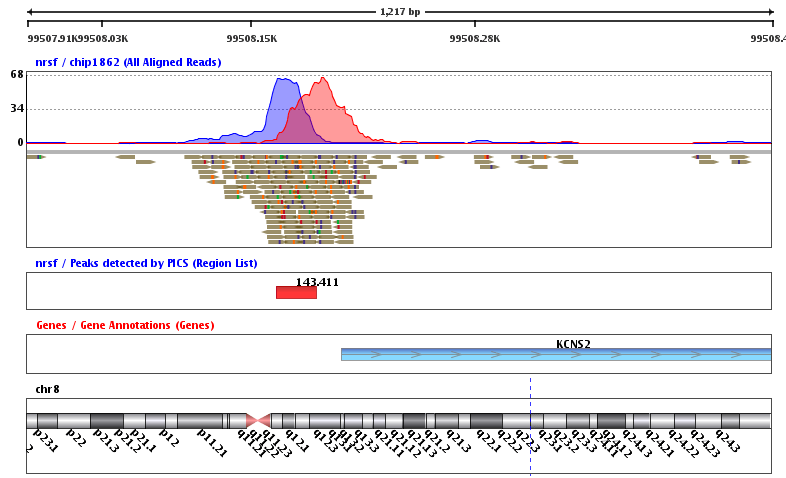
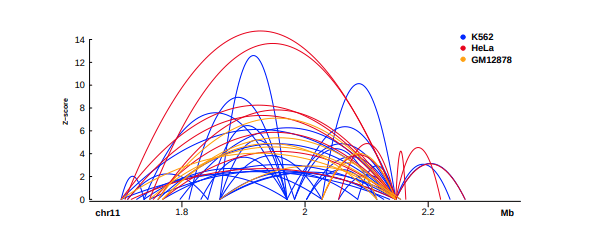
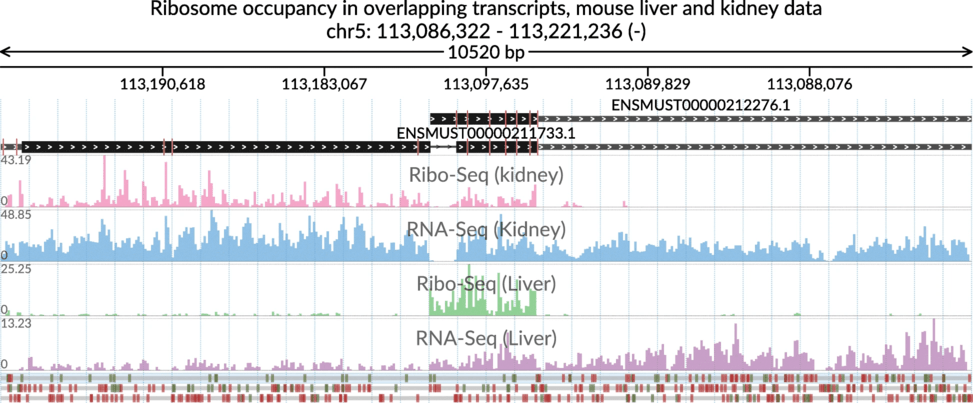
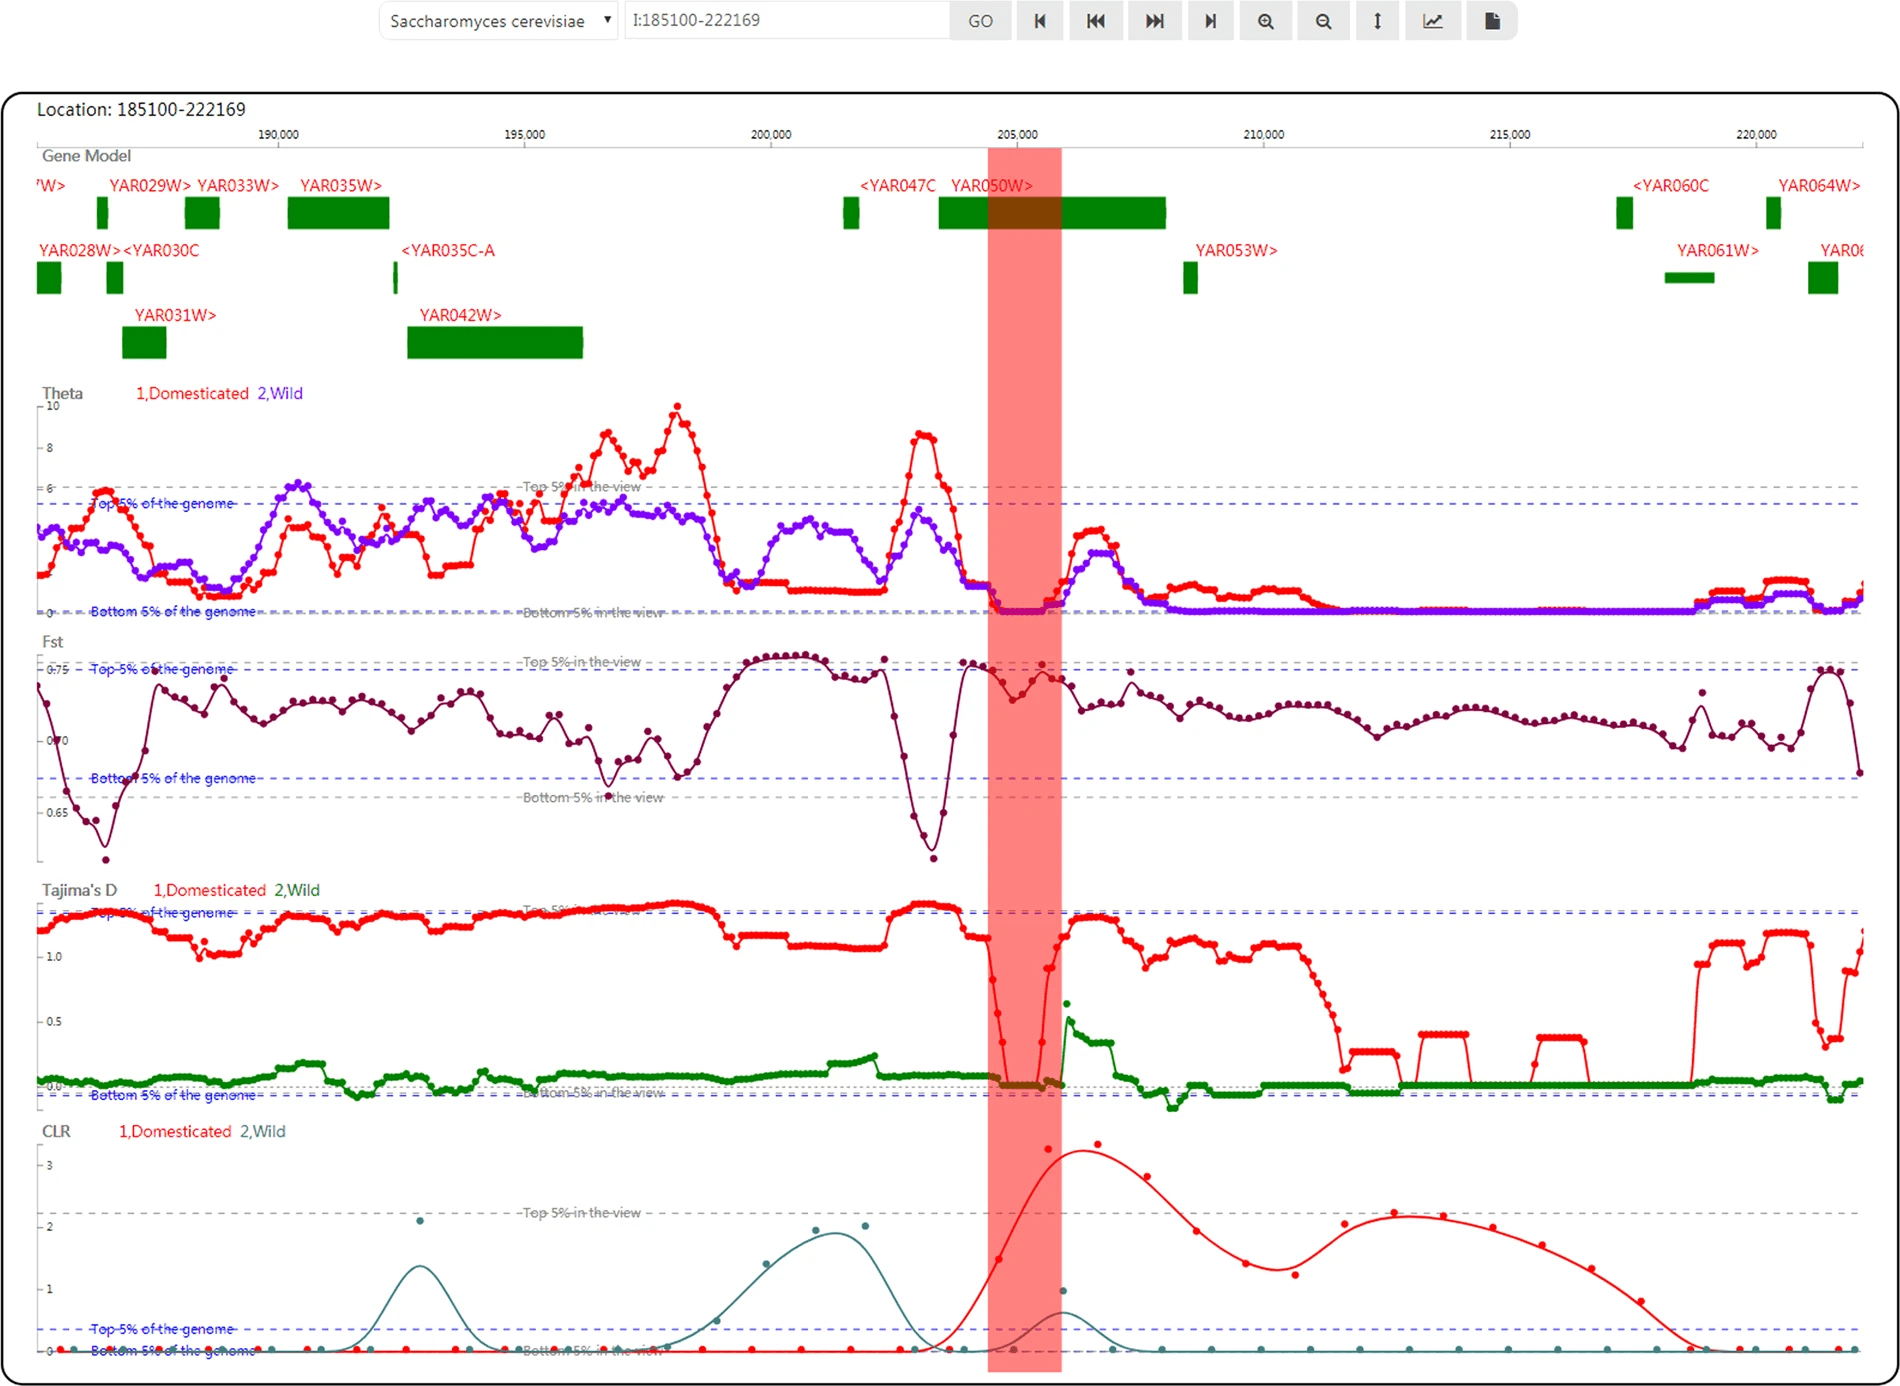
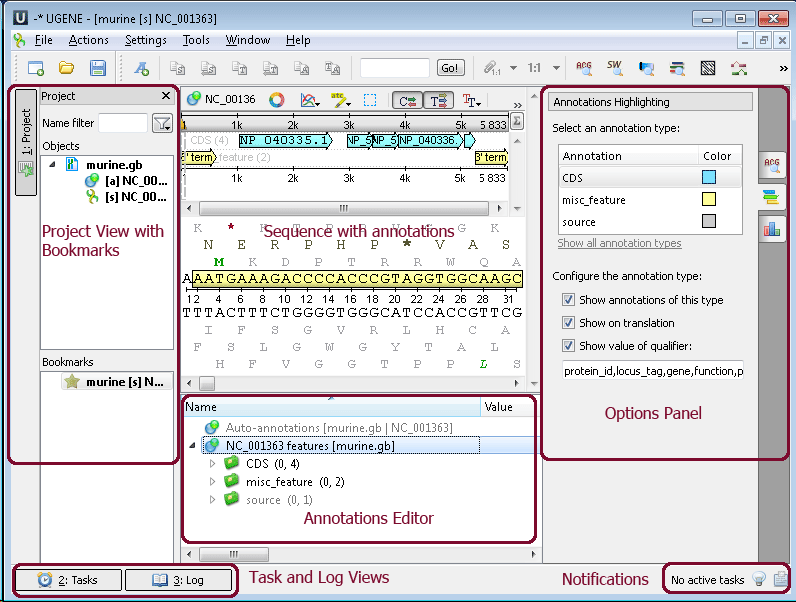
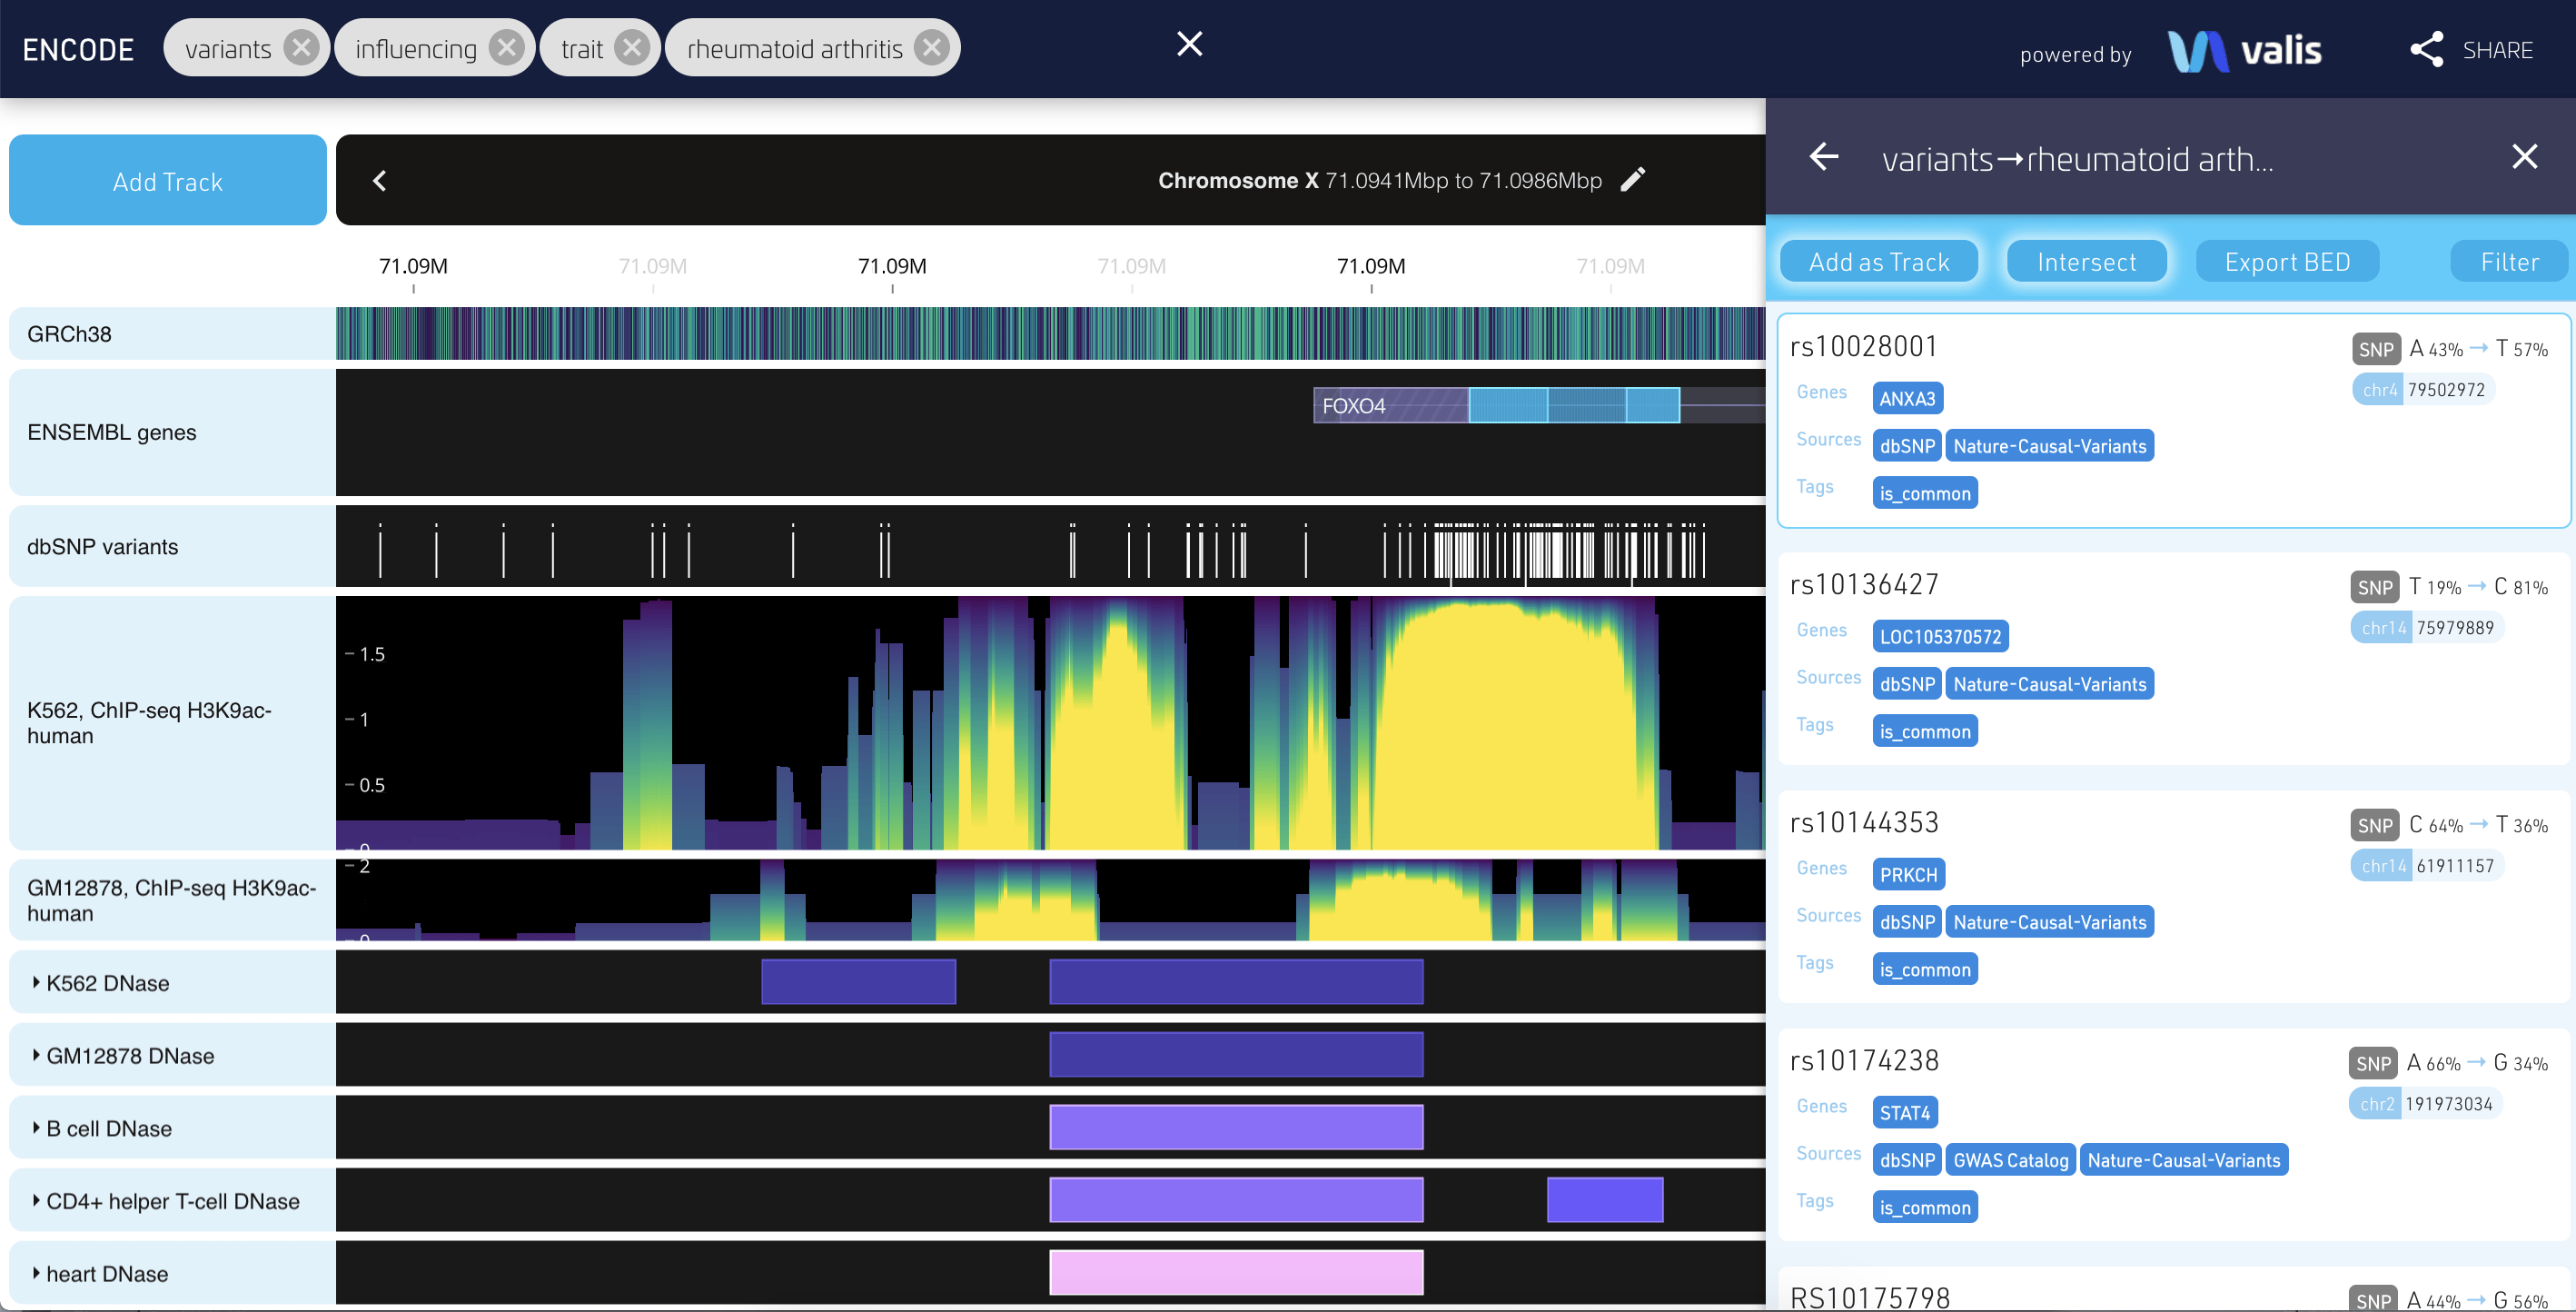
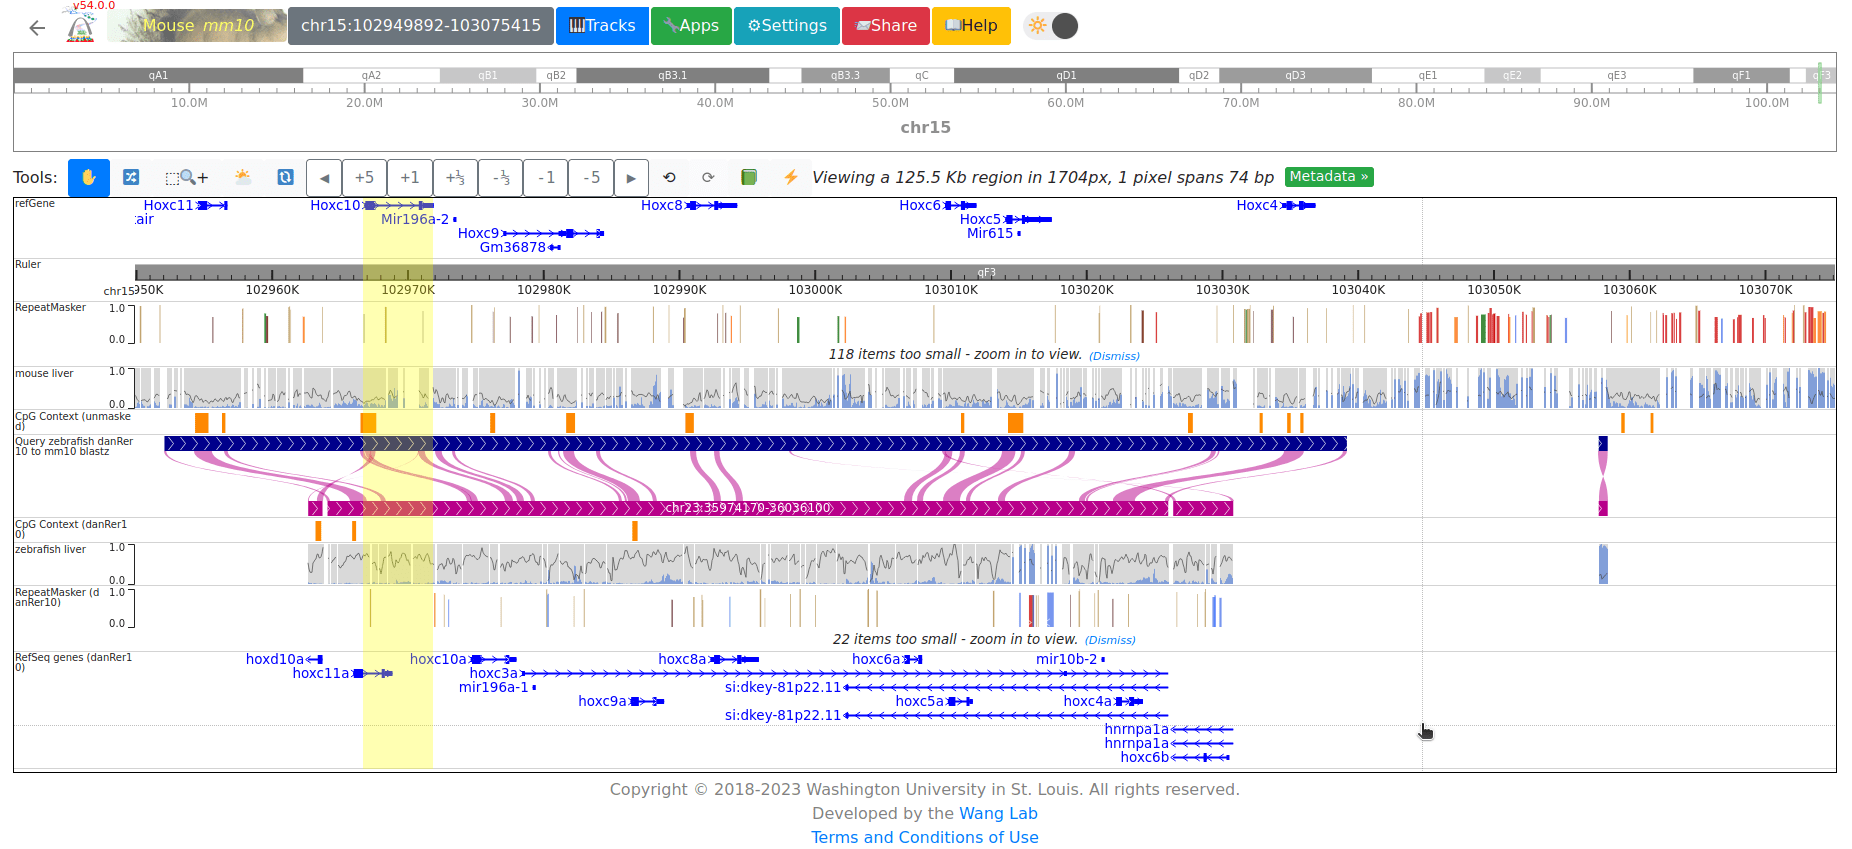
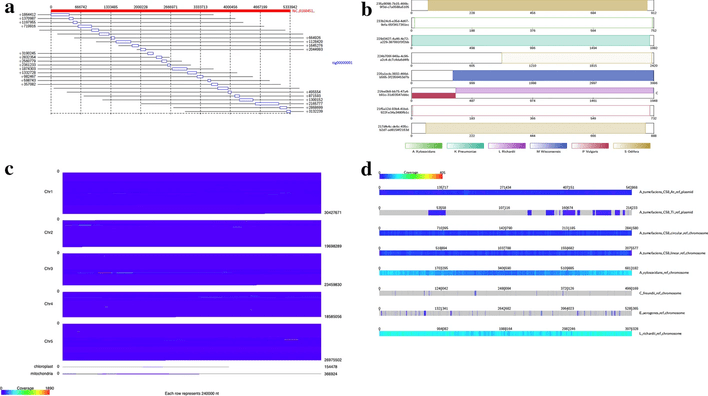
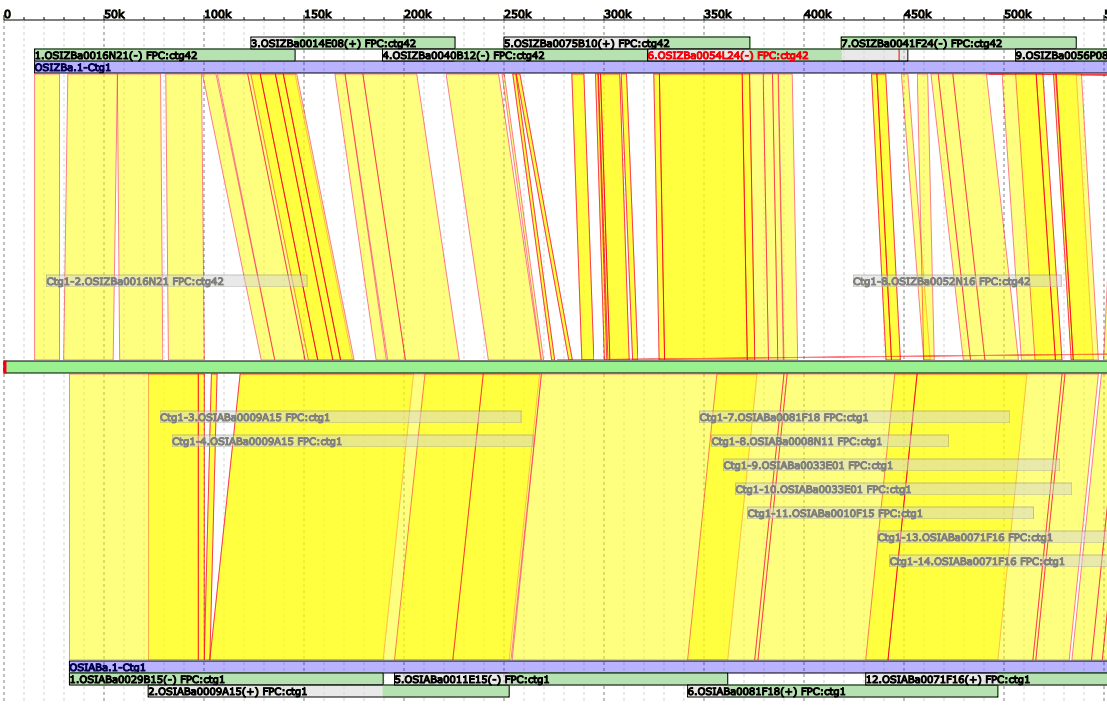
- ALVIS (chimeric alignment viewer) (img)
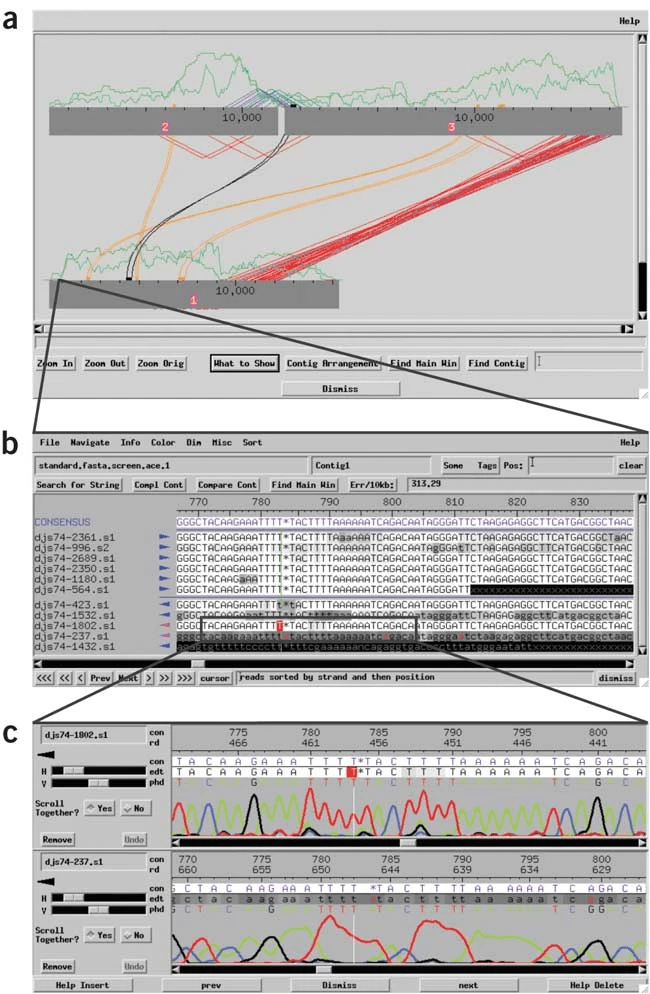
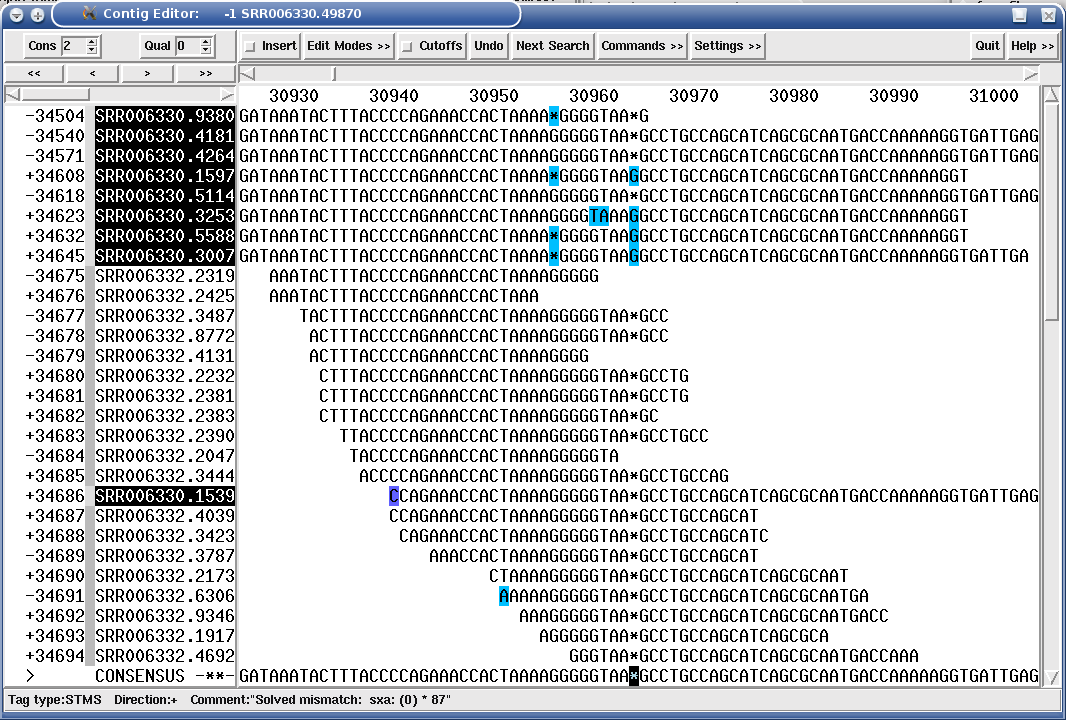
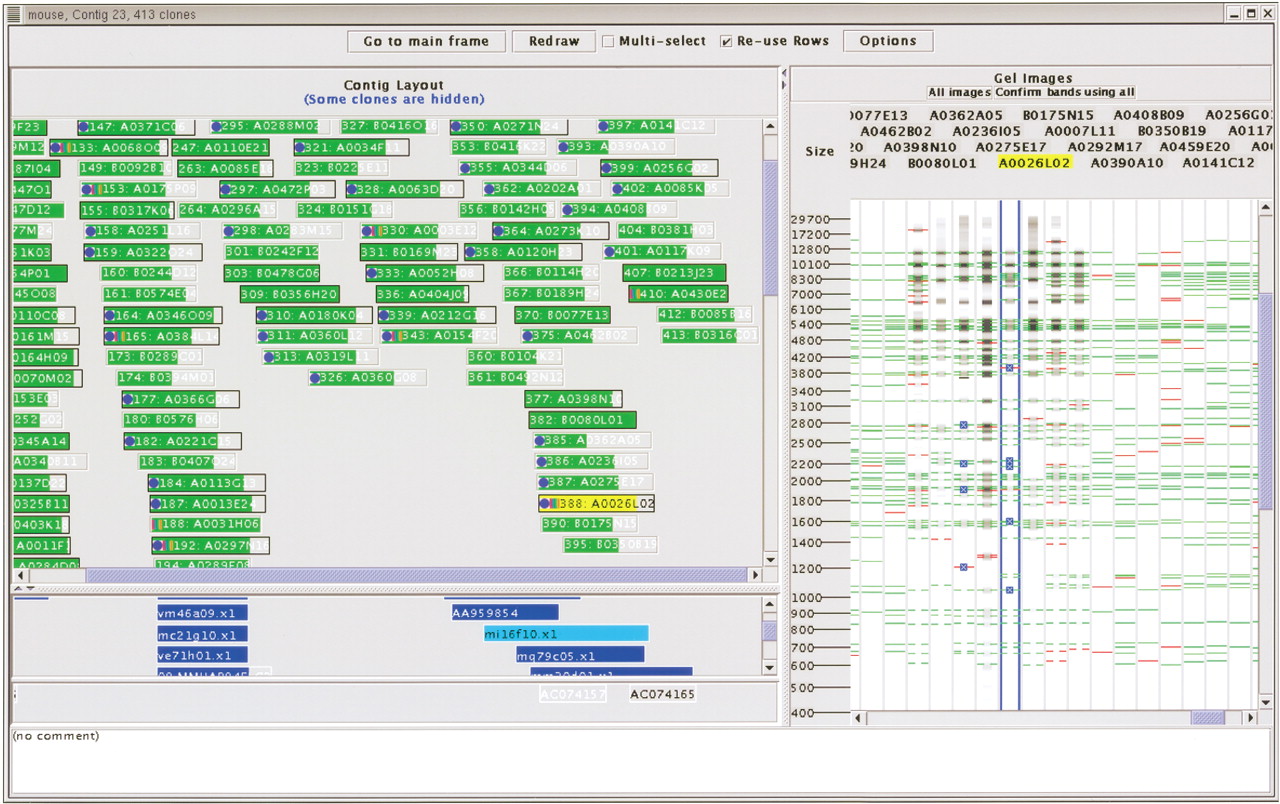
- Consed (img)
- GCI (img)
- Genome Puzzle Master (GPM) (img)
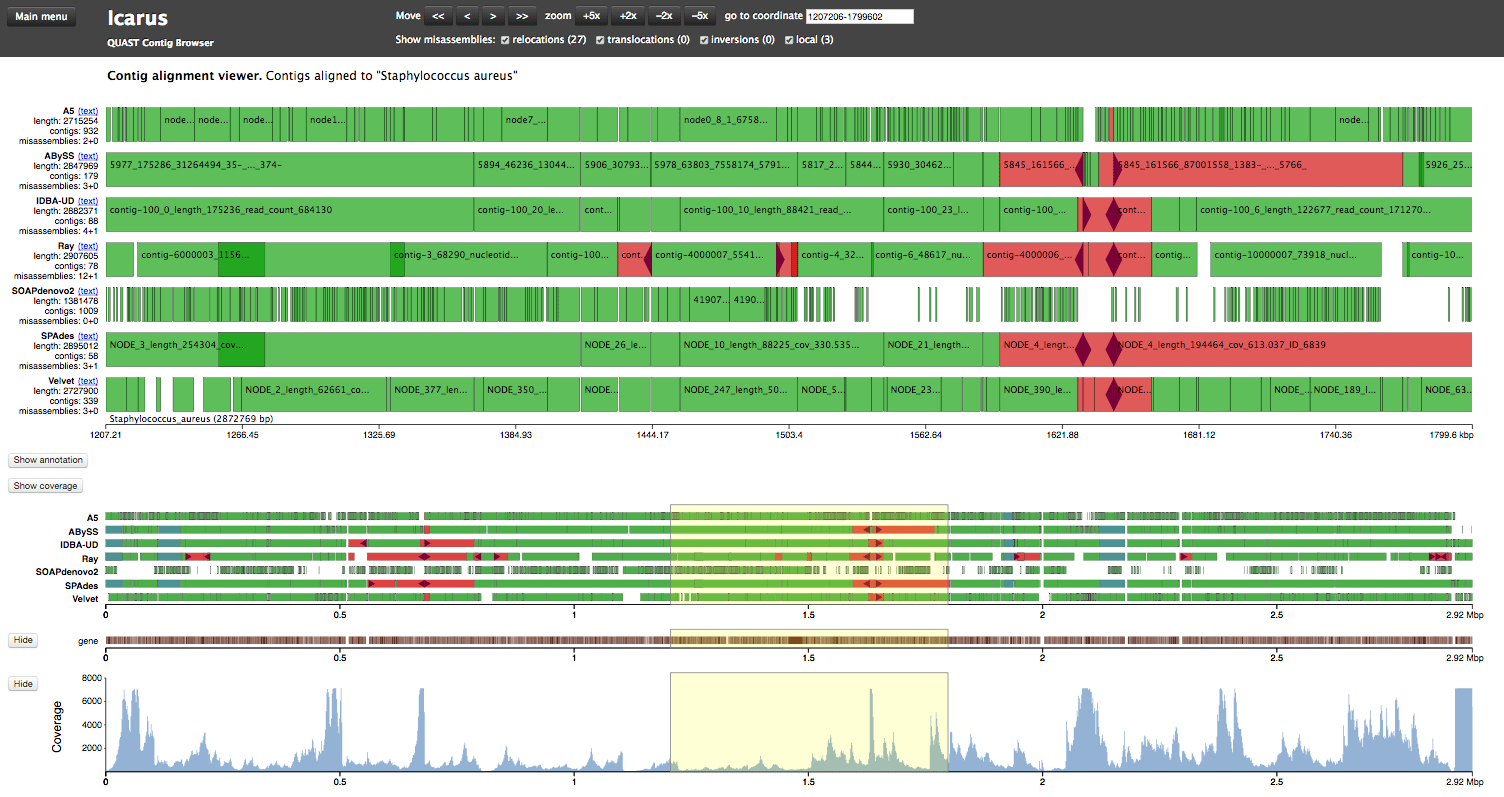
- Icarus QUAST (img)
- MIRA (orig paper also describes mira here http://citeseerx.ist.psu.edu/viewdoc/download?doi=10.1.1.23.7465&rep=rep1&type=pdf) (img)
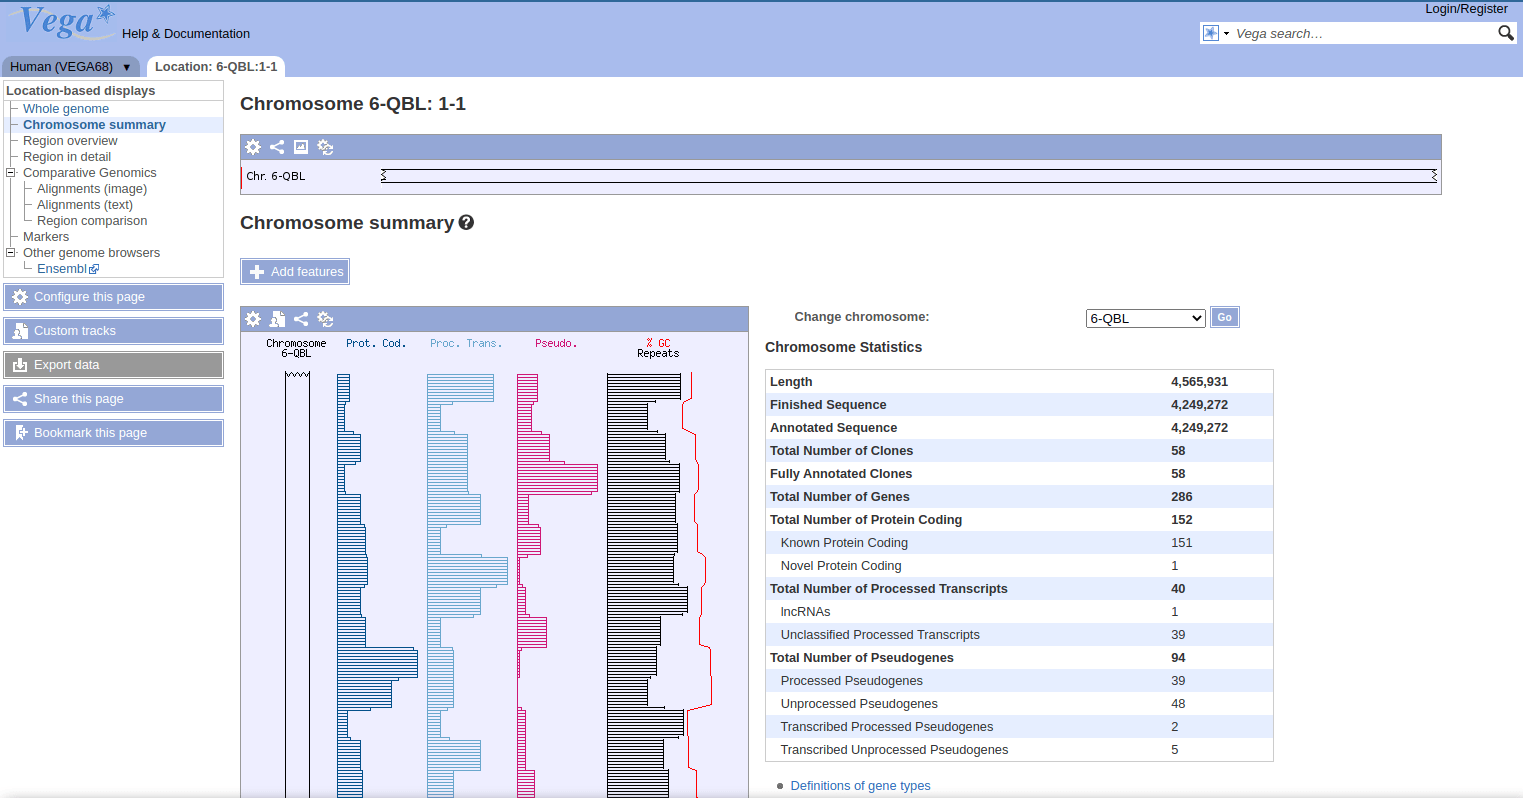
- vega (Mentioned in https://www.biorxiv.org/content/10.1101/2021.07.02.450883v1.full.pdf also note: vega standards for vertebrate genome annotation database) (img)

- BLAST+ (reading -outfmt 0 pairwise output is the original CLI bioinformatics!)
- SequenceServer (img)
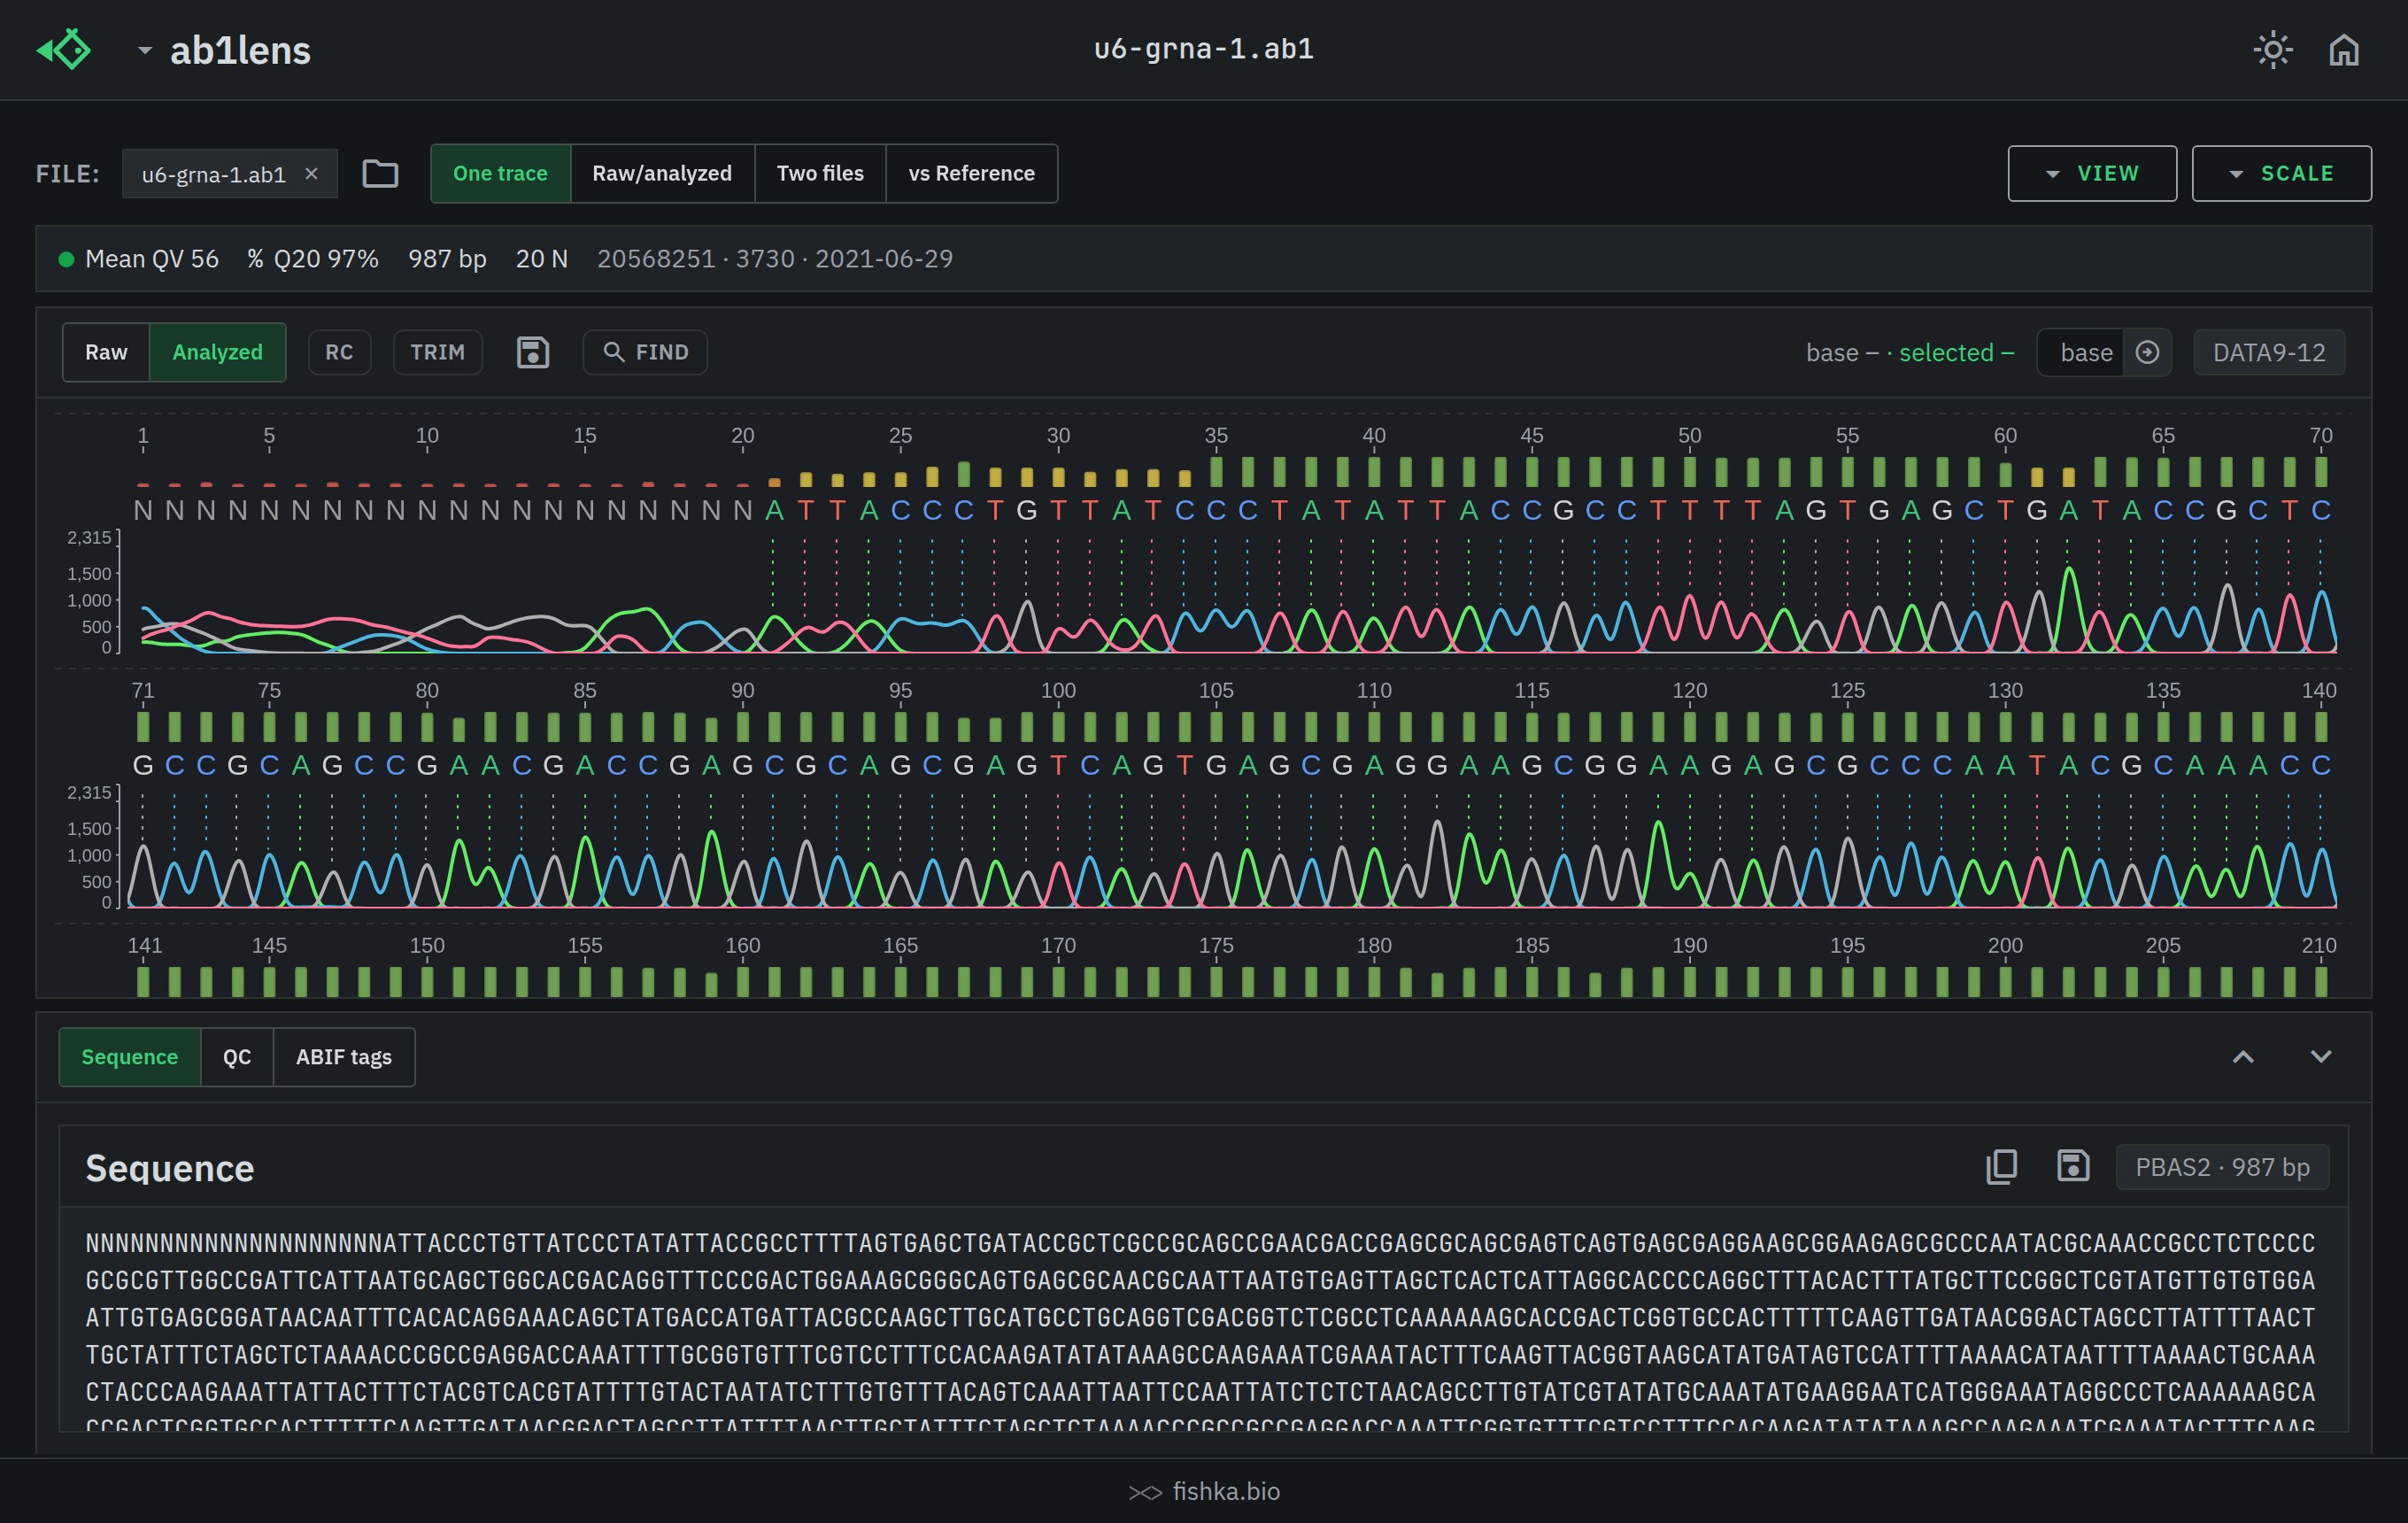
- ab1lens (Free, browser-based Sanger / .ab1 chromatogram viewer. View and compare raw vs analyzed traces and basecalls, align a read to a reference to find mismatches, and export a high-resolution image. Runs entirely client-side — data never leaves the browser.) (img)
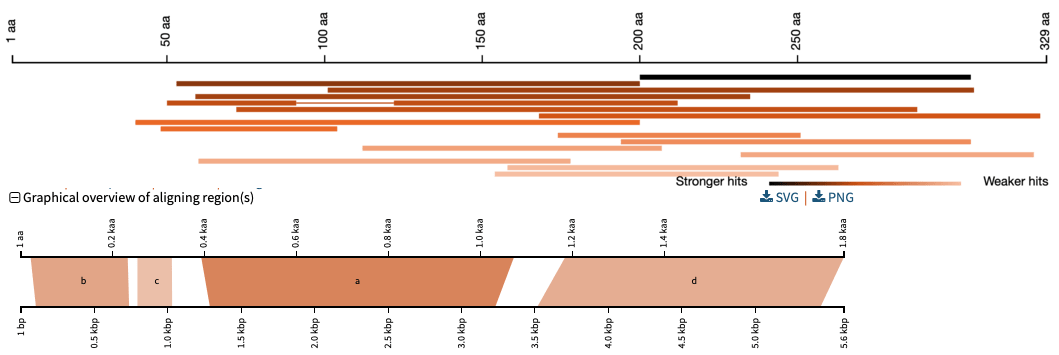
- Anvio
- BioCircos.js (img)
- BRICK (BRIG-like circular knowledgebase) (See also BRIG) (img)
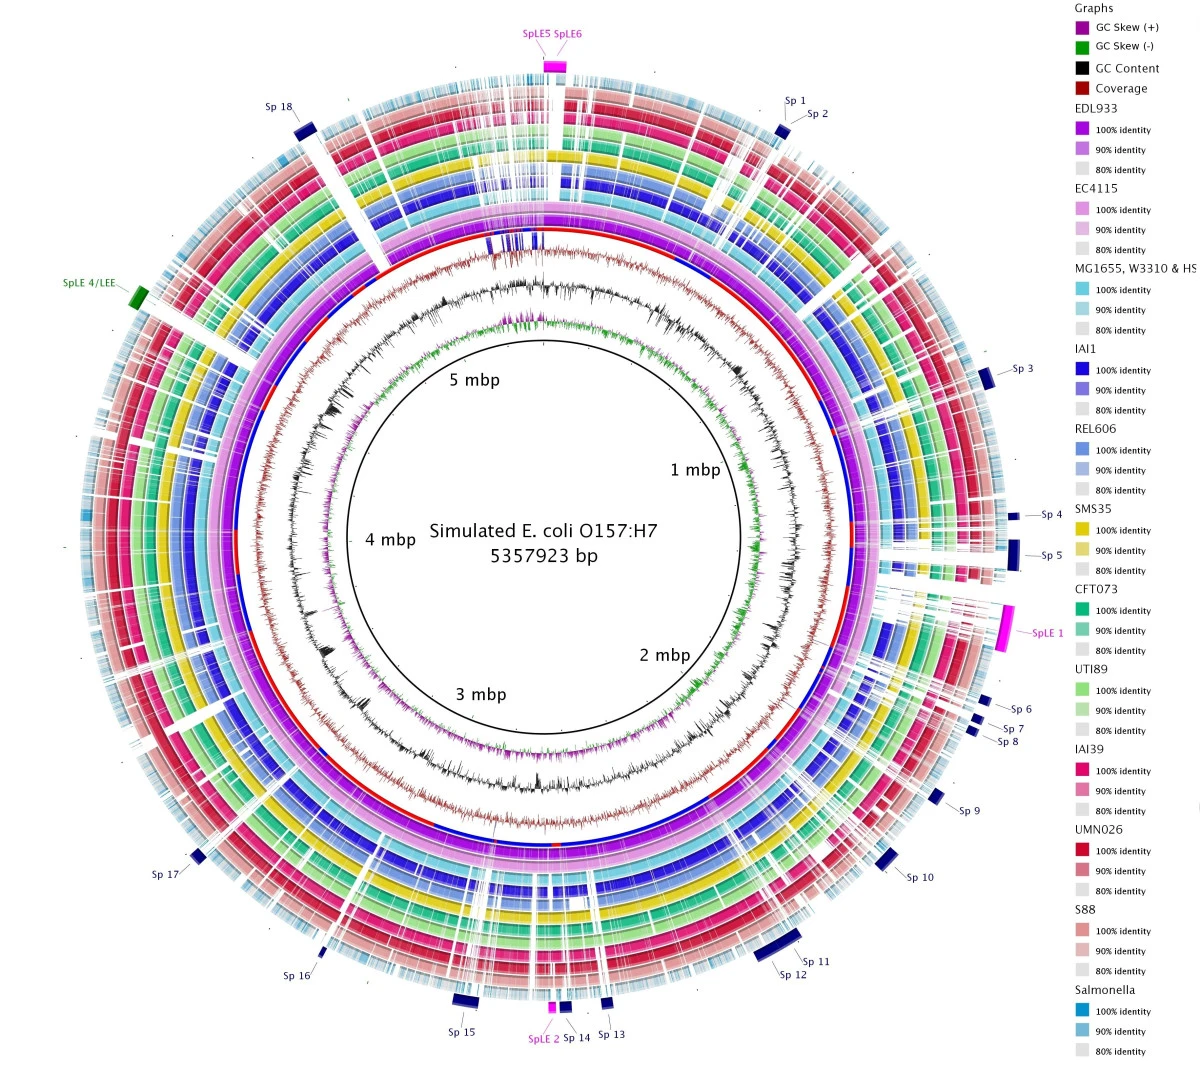
- BRIG (img)
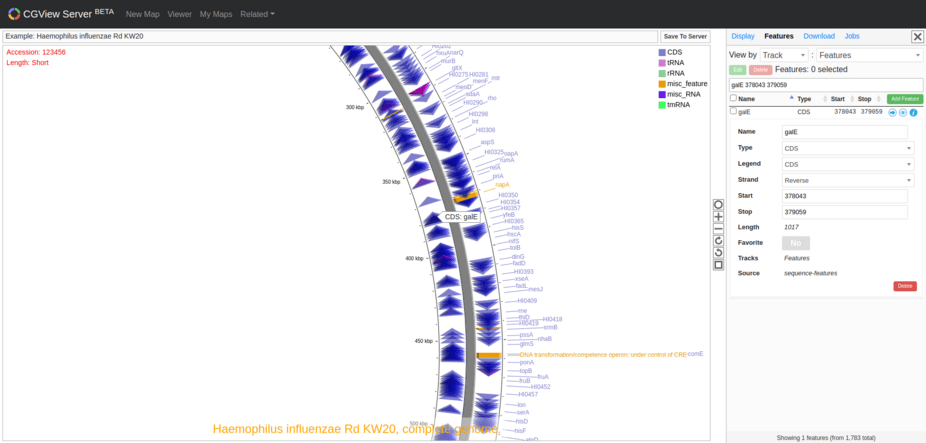
- CGView (See also CGView comparison tool and other related https://paulstothard.github.io/cgview_comparison_tool/) (img)
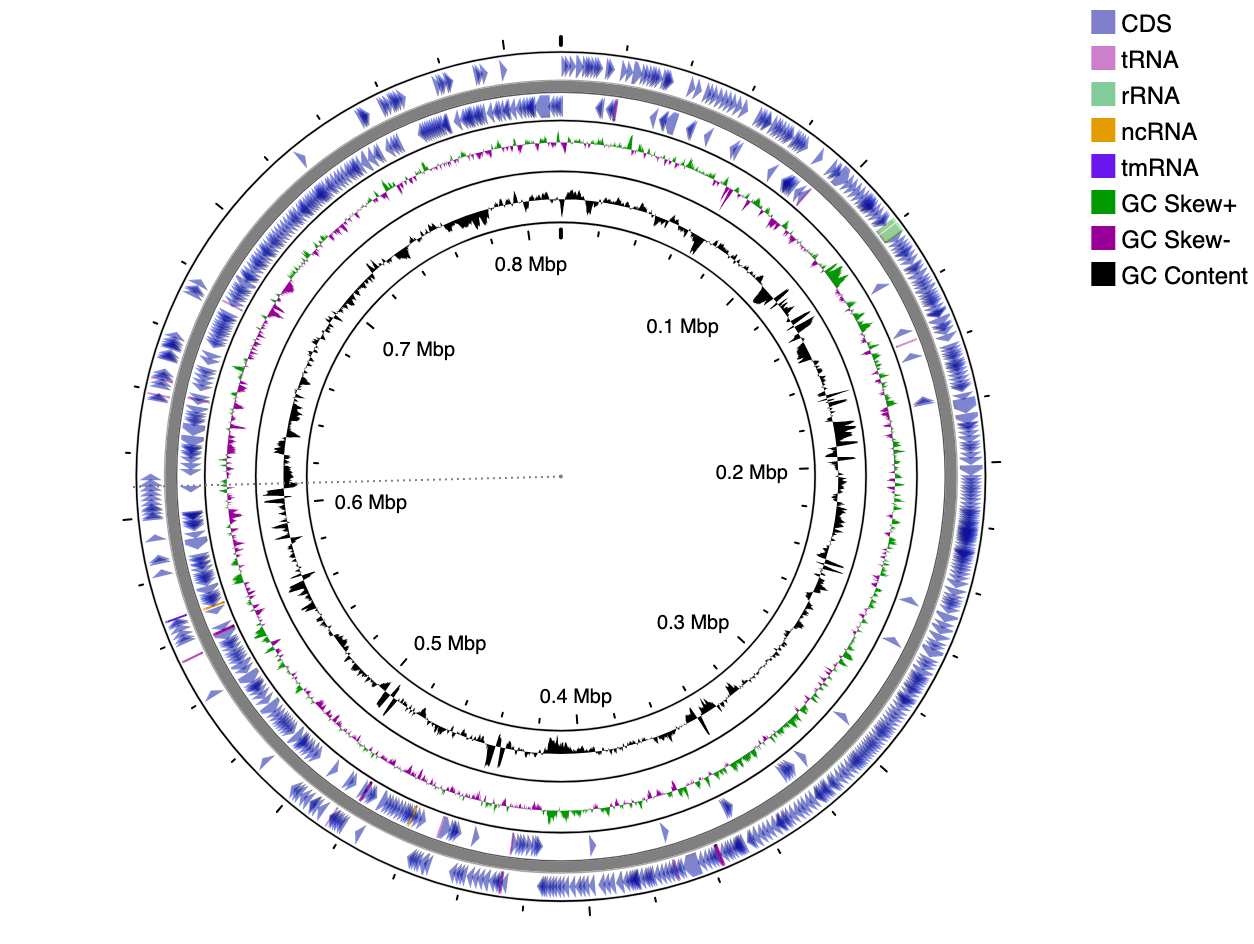
- CGView.js (Used by proksee) (img)
- Circa (img)
- Circleator (img)
- circlize (img)
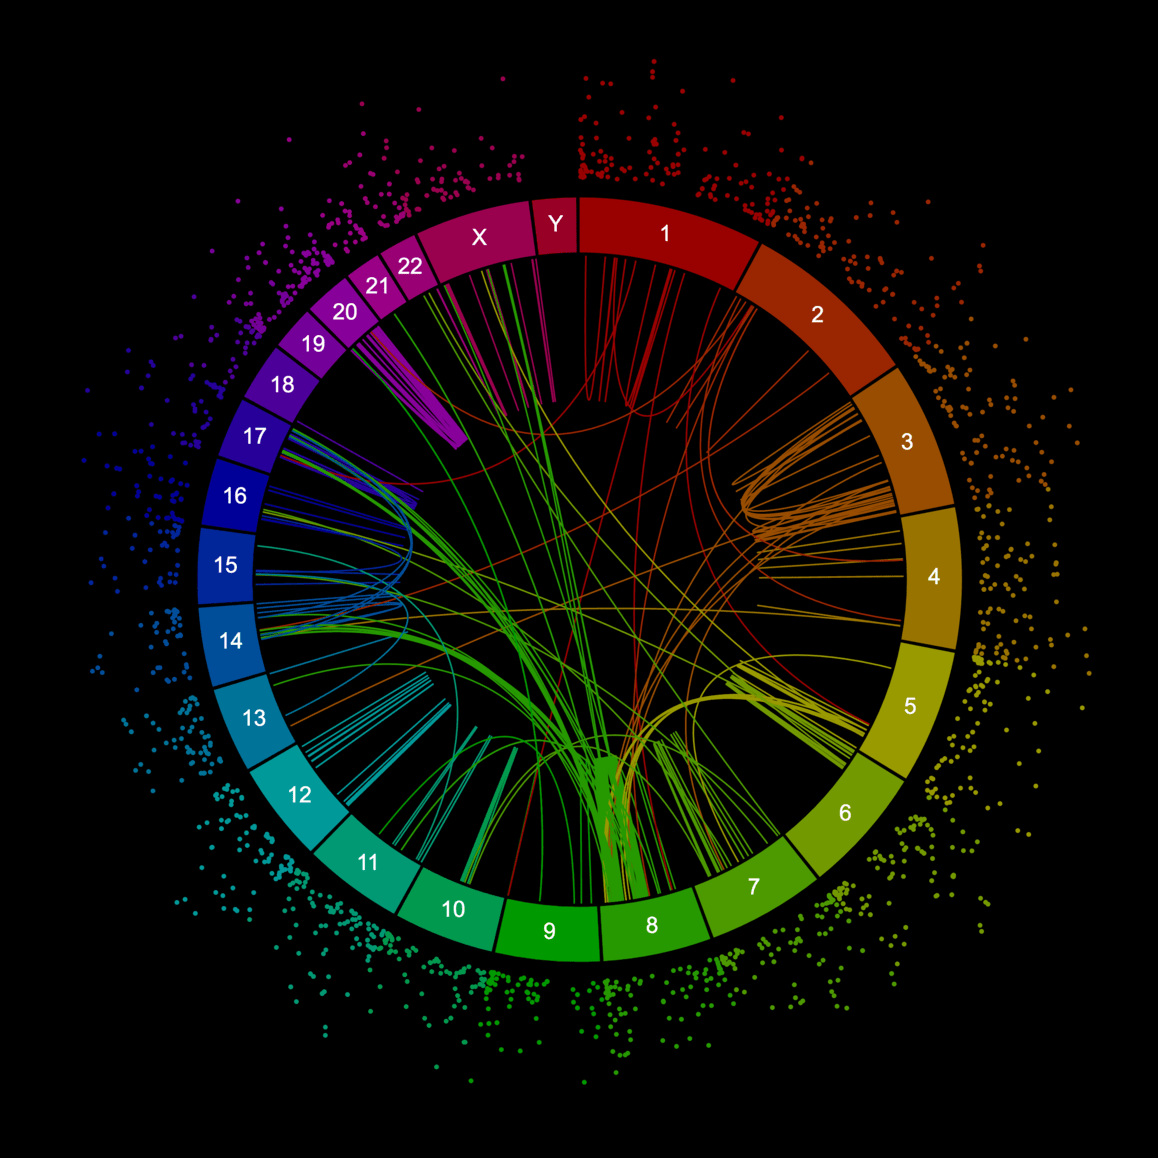
- Circos (no official github to my knowledge) (img)
- CircosJS (img)
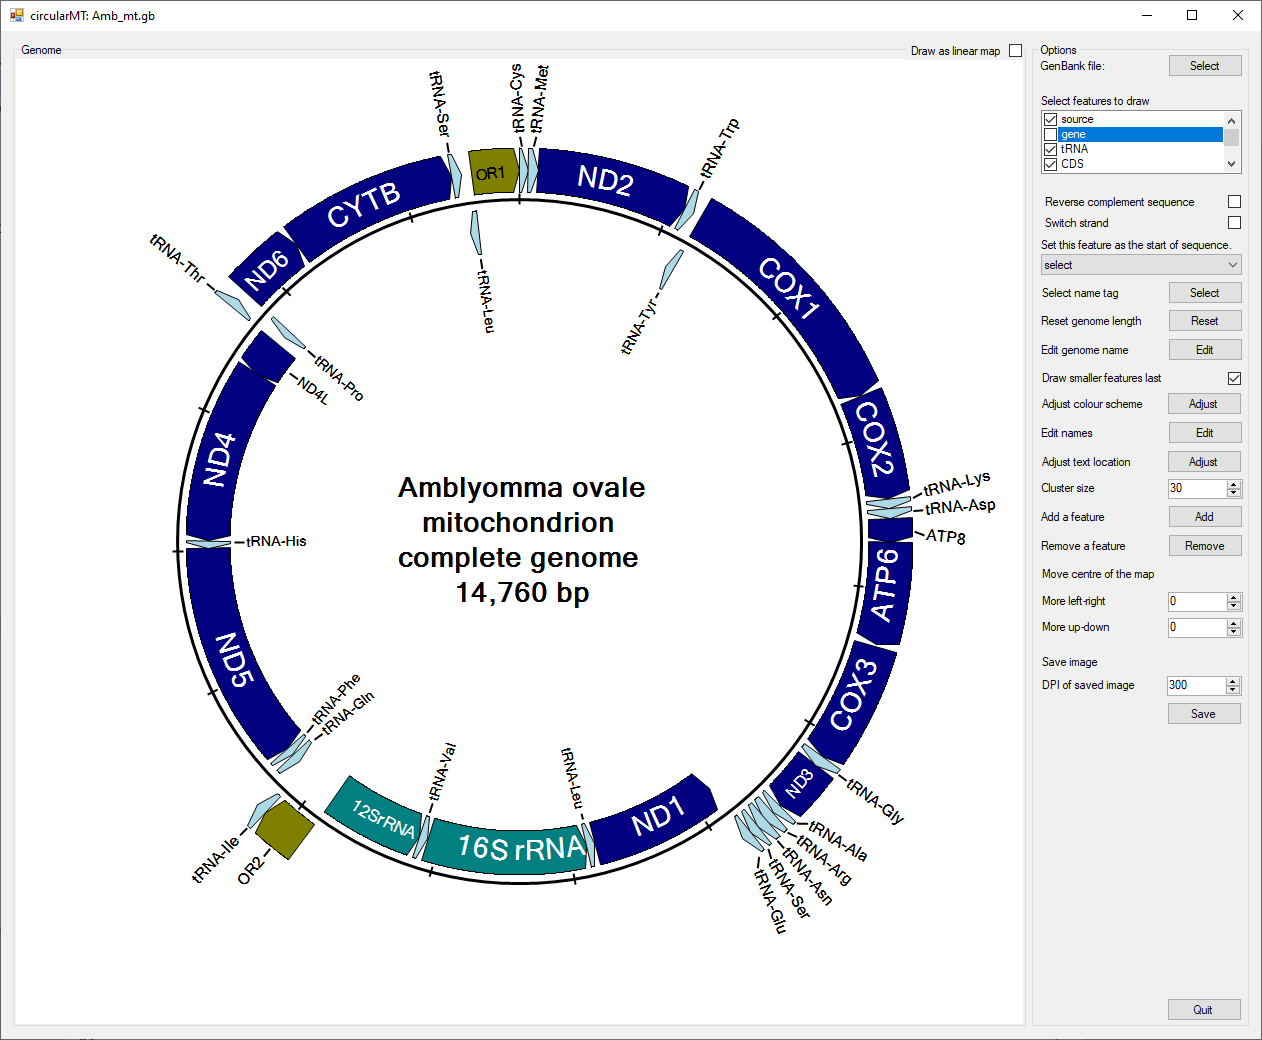
- circularMT (img)
- DNAPlotter (img)
- gbdraw (img)
- GenomeProjector (img)
- genoVi (img)
- GGisy (img)
- Gview (img)
- JupiterPlot (img)
- mummer2circos (img)
- OGDRAW (img)
- OmicCircos (img)
- pyCirclize (img)
- pyCircos (See also https://github.com/ponnhide/plasmidviewer) (img)
- RegulomeExplorer (img)
- seqviz (img)
- SyntenyPortal (img)
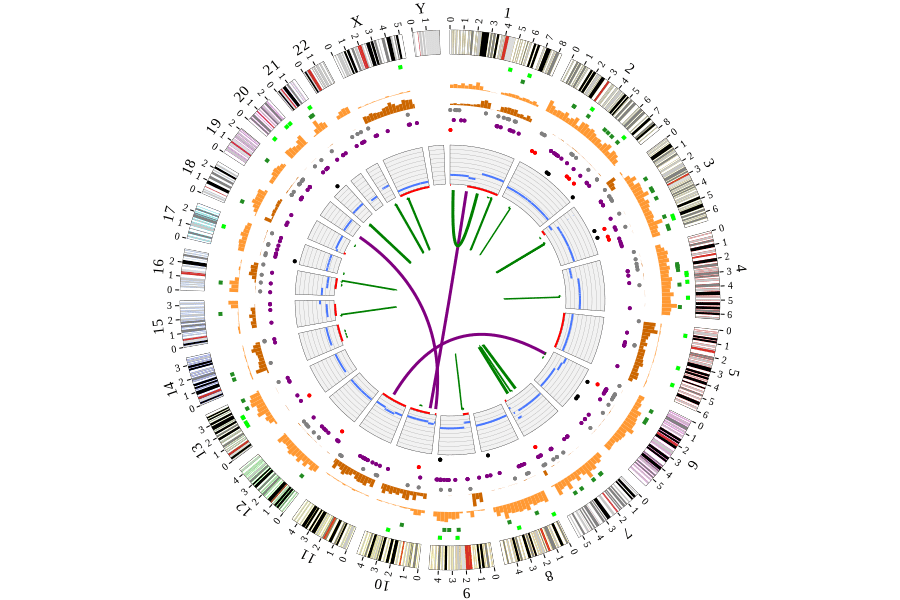
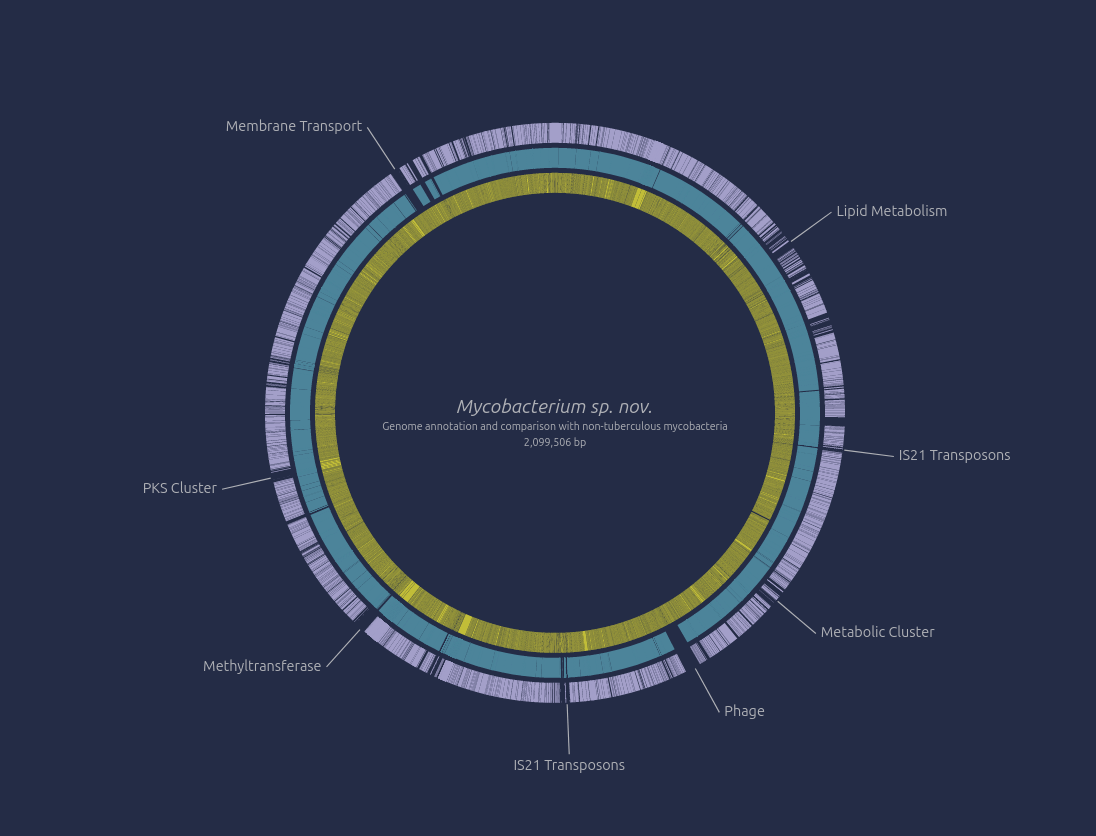
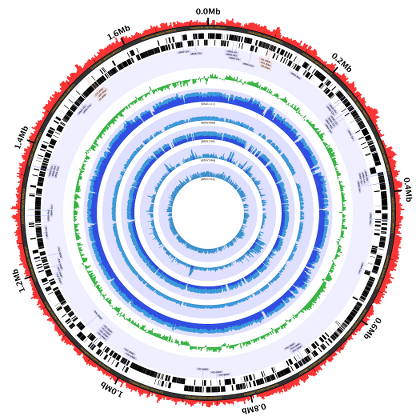
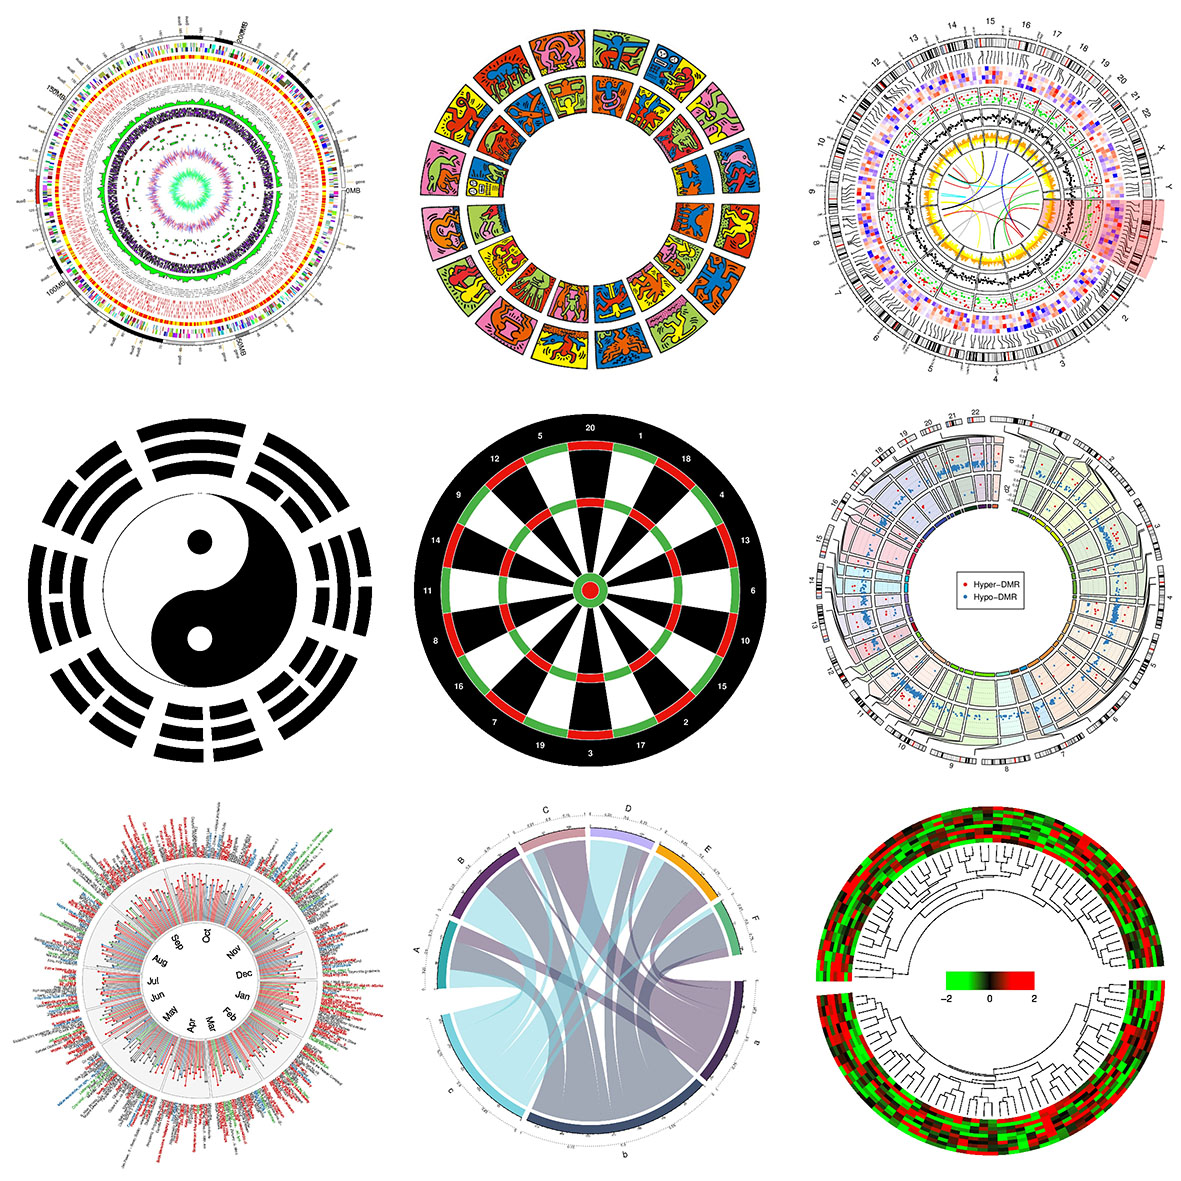
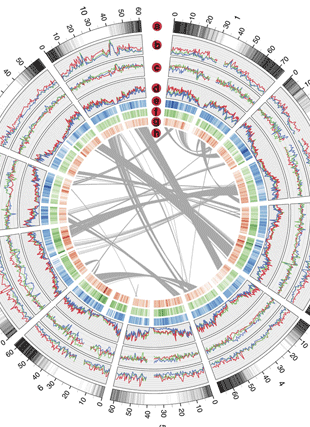
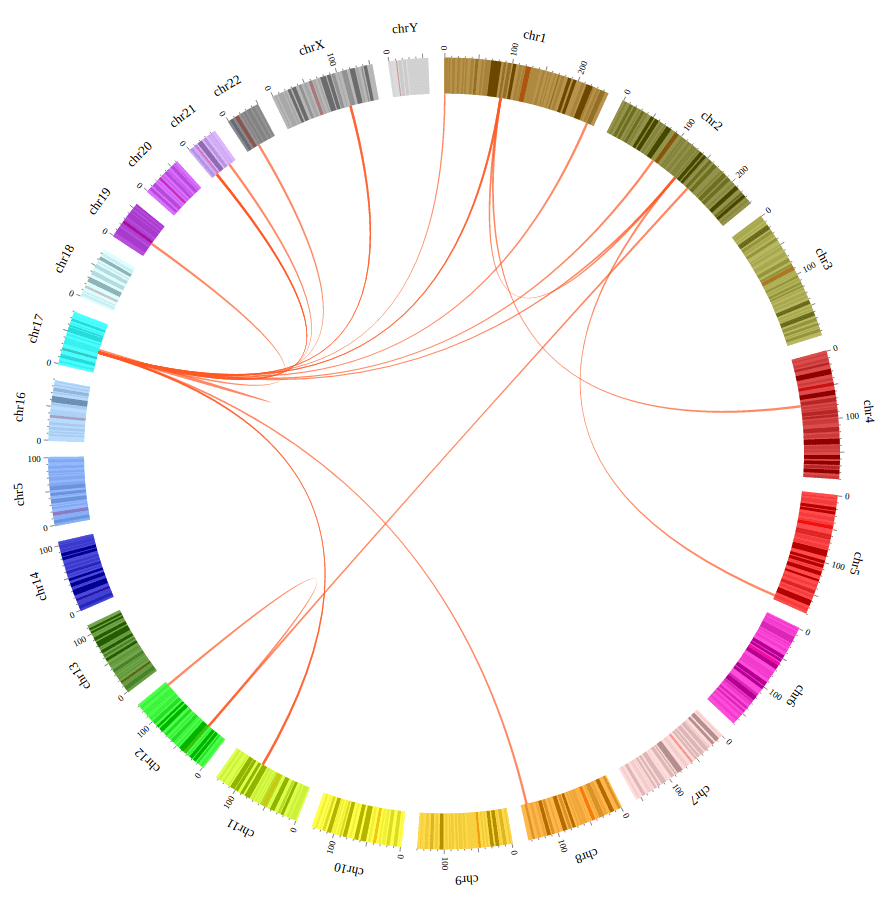
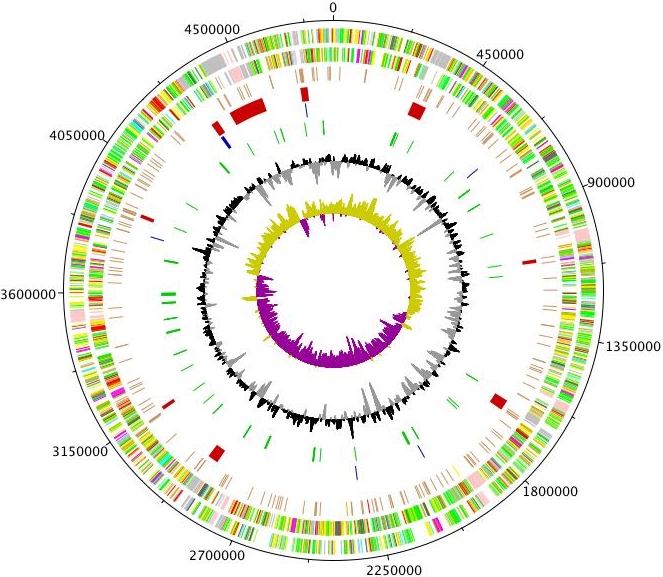
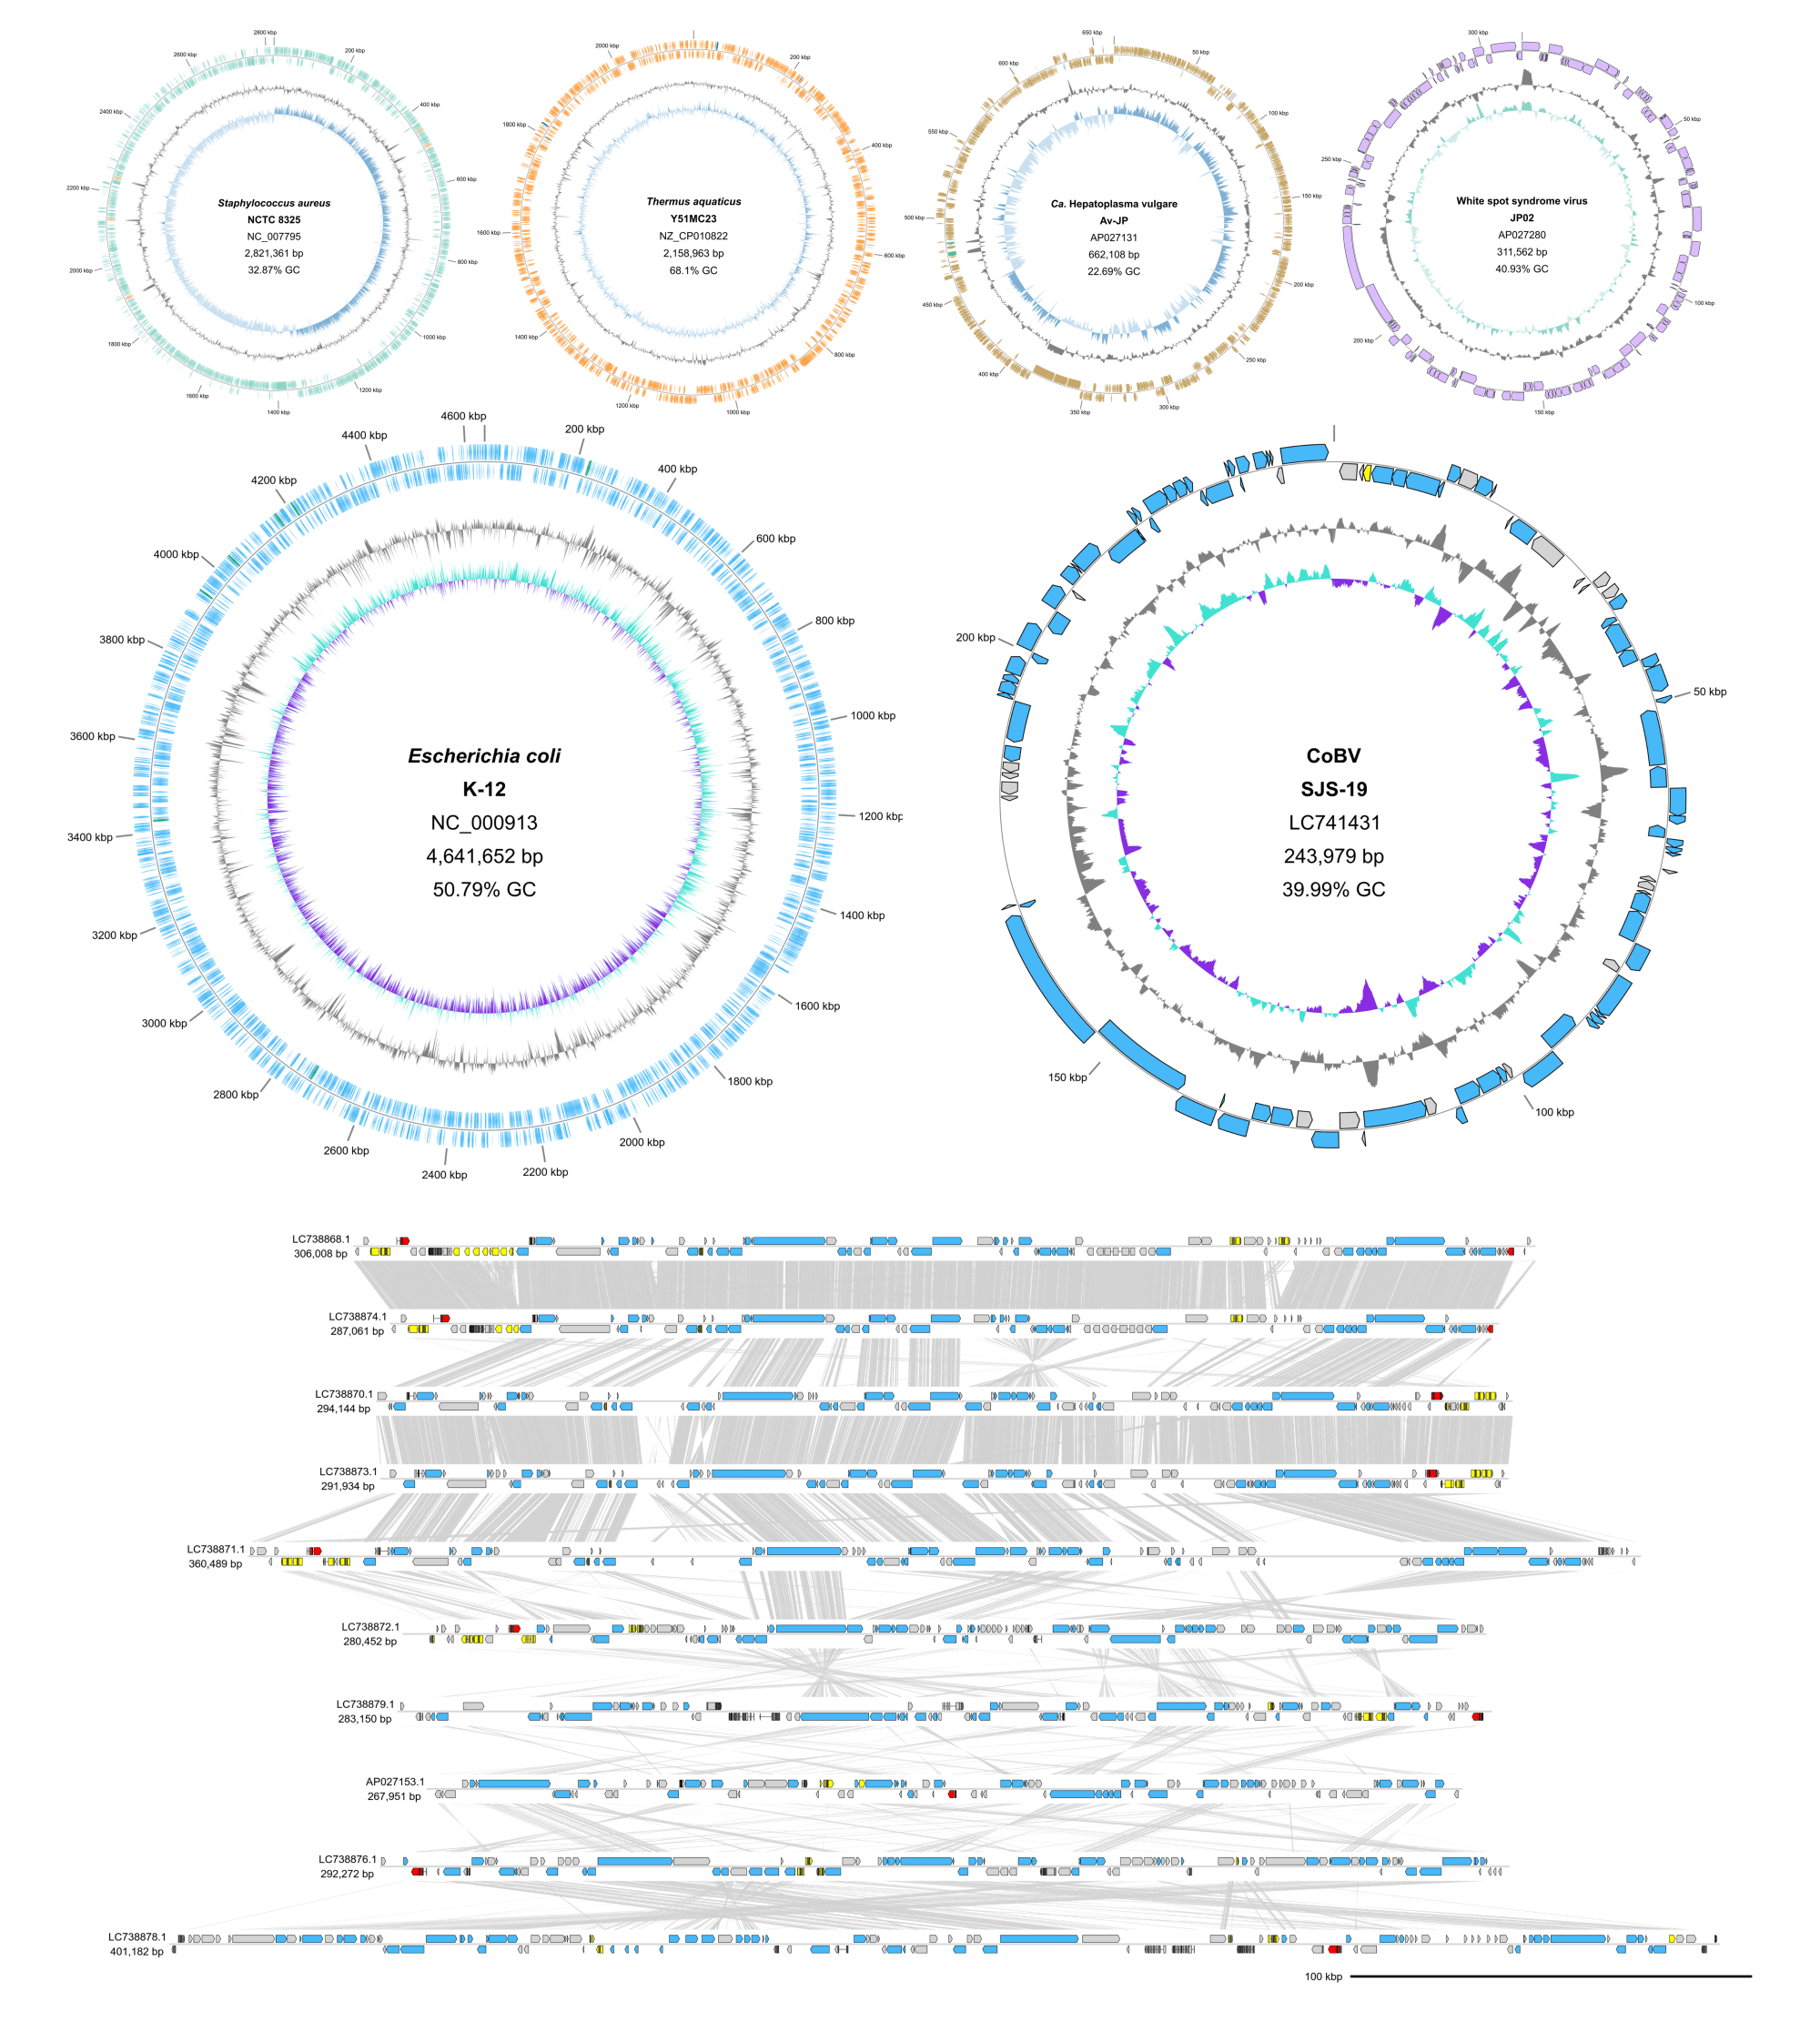
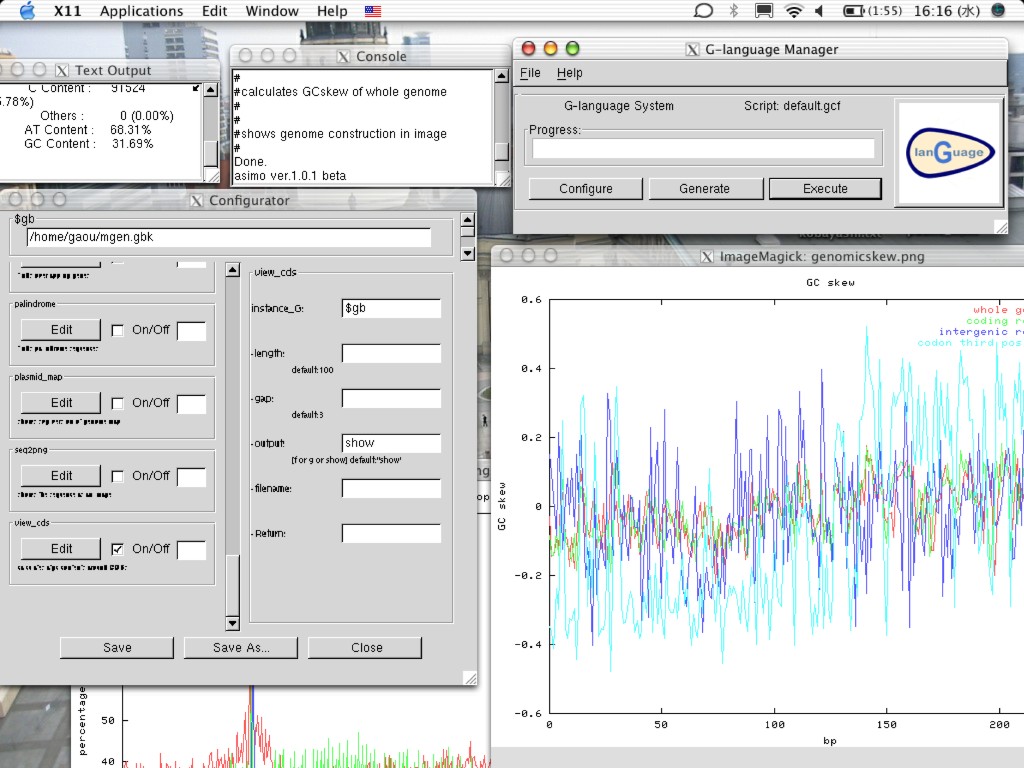
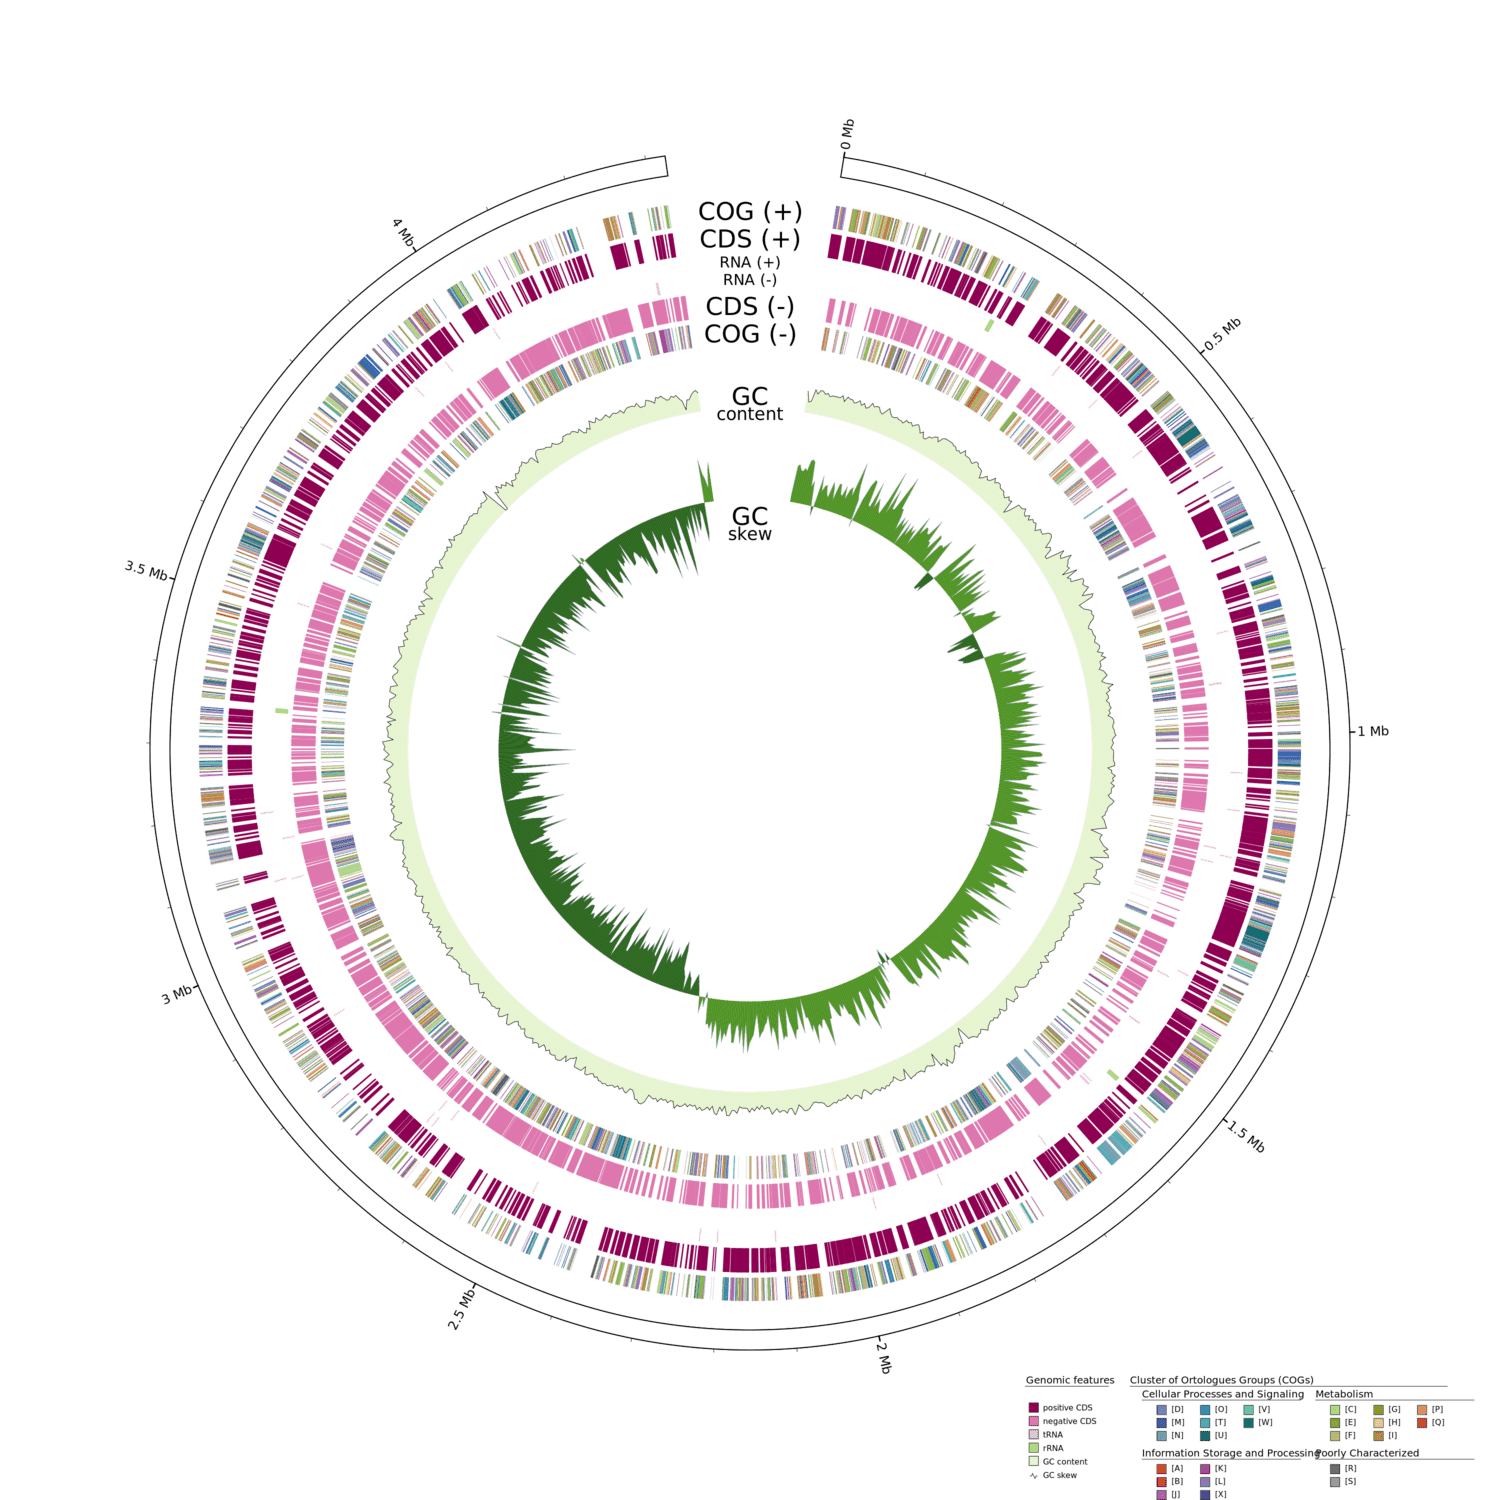
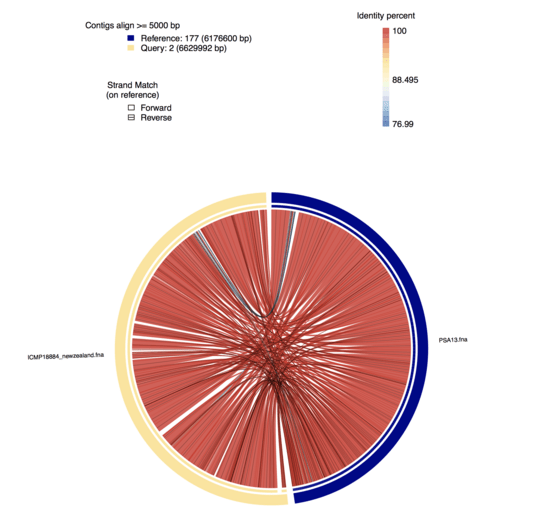
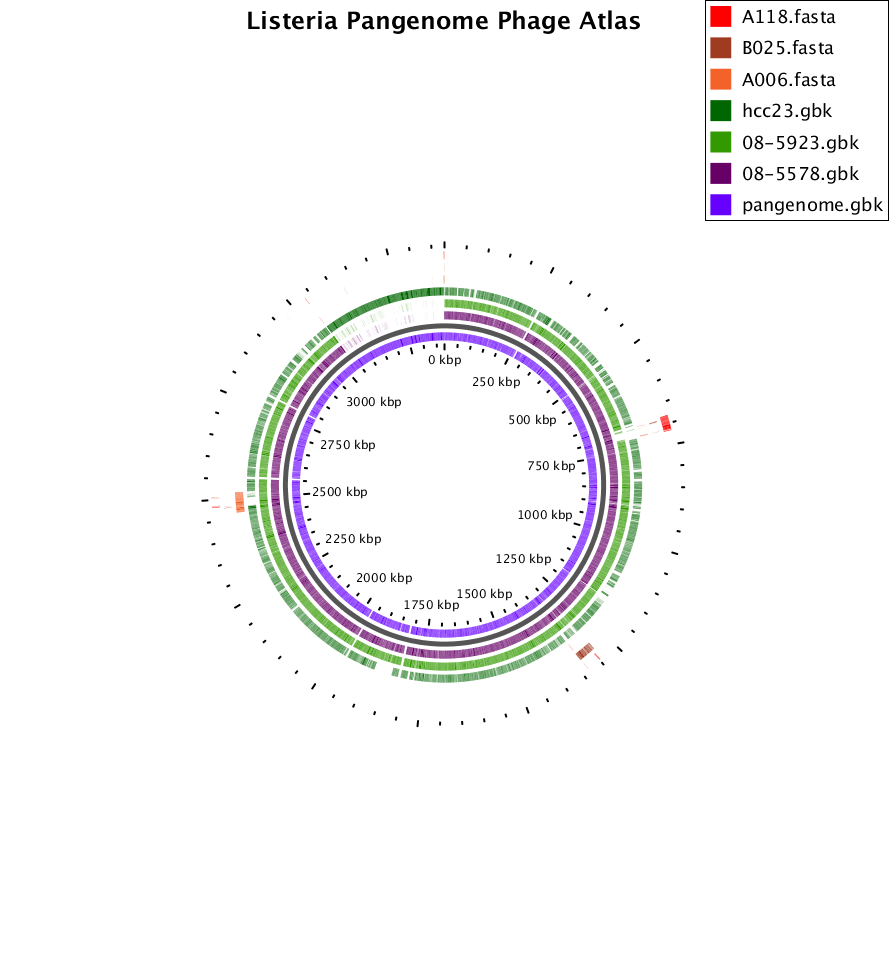
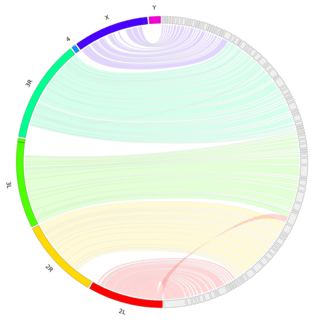
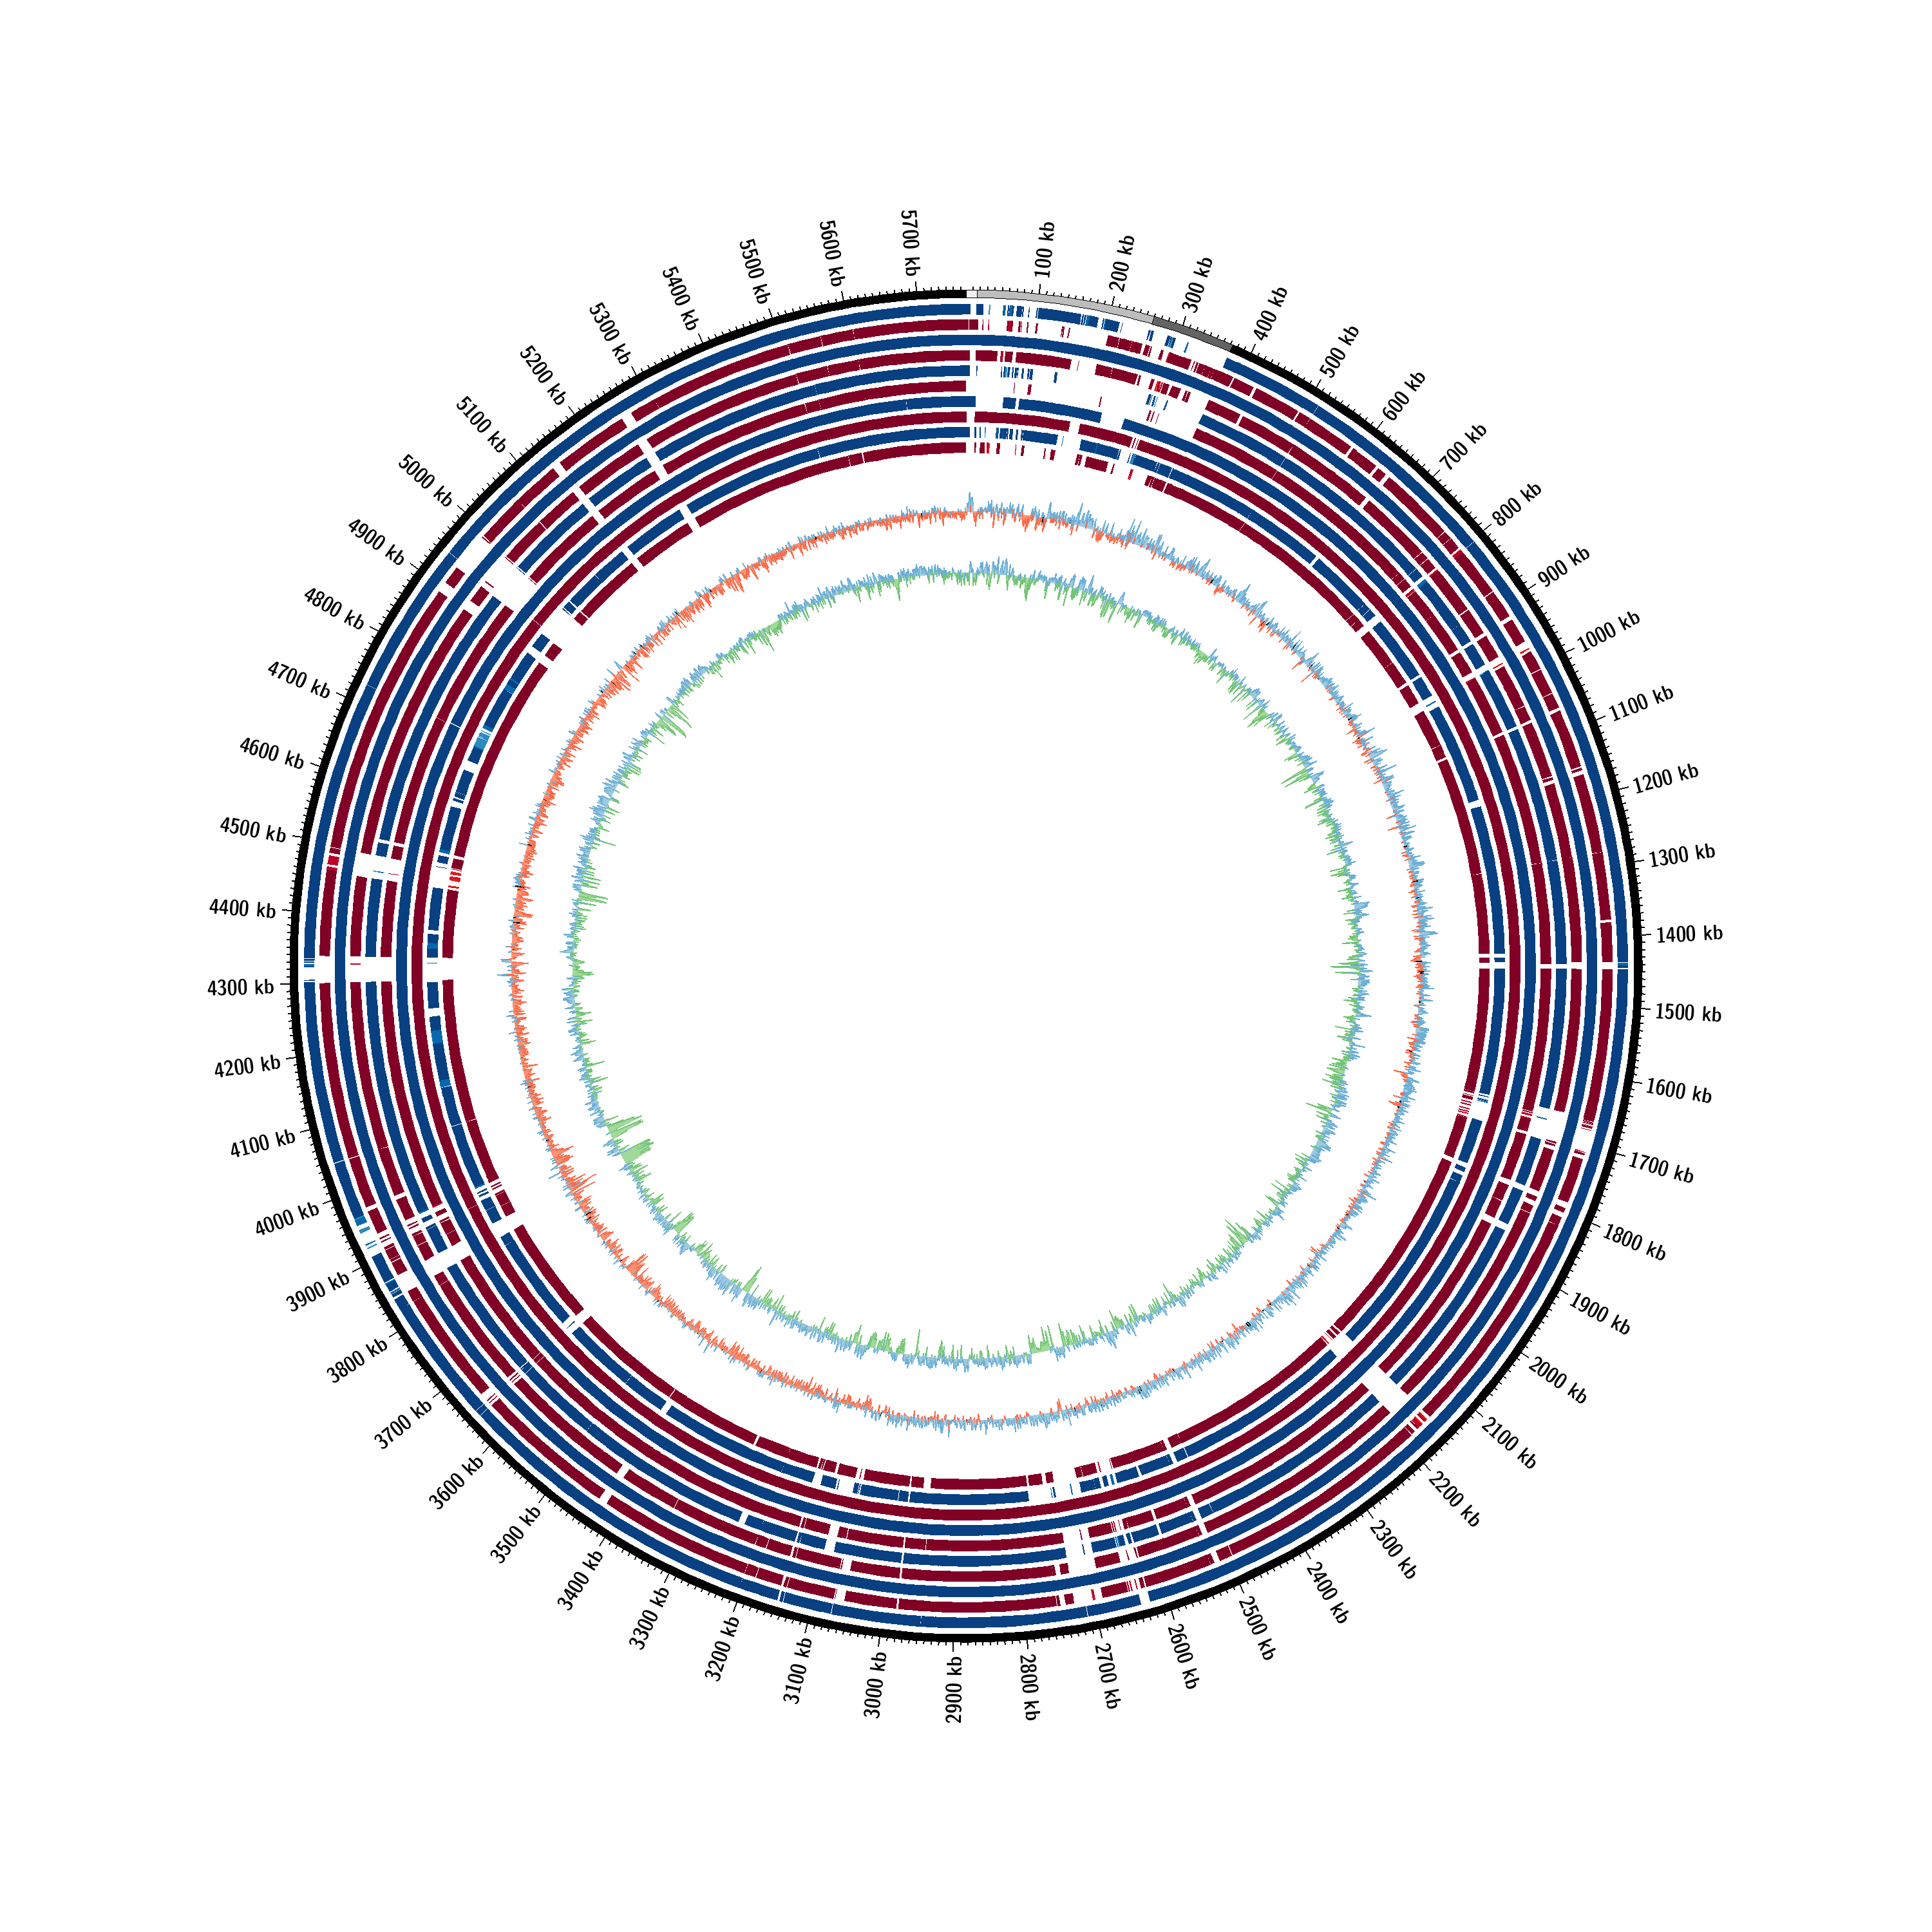
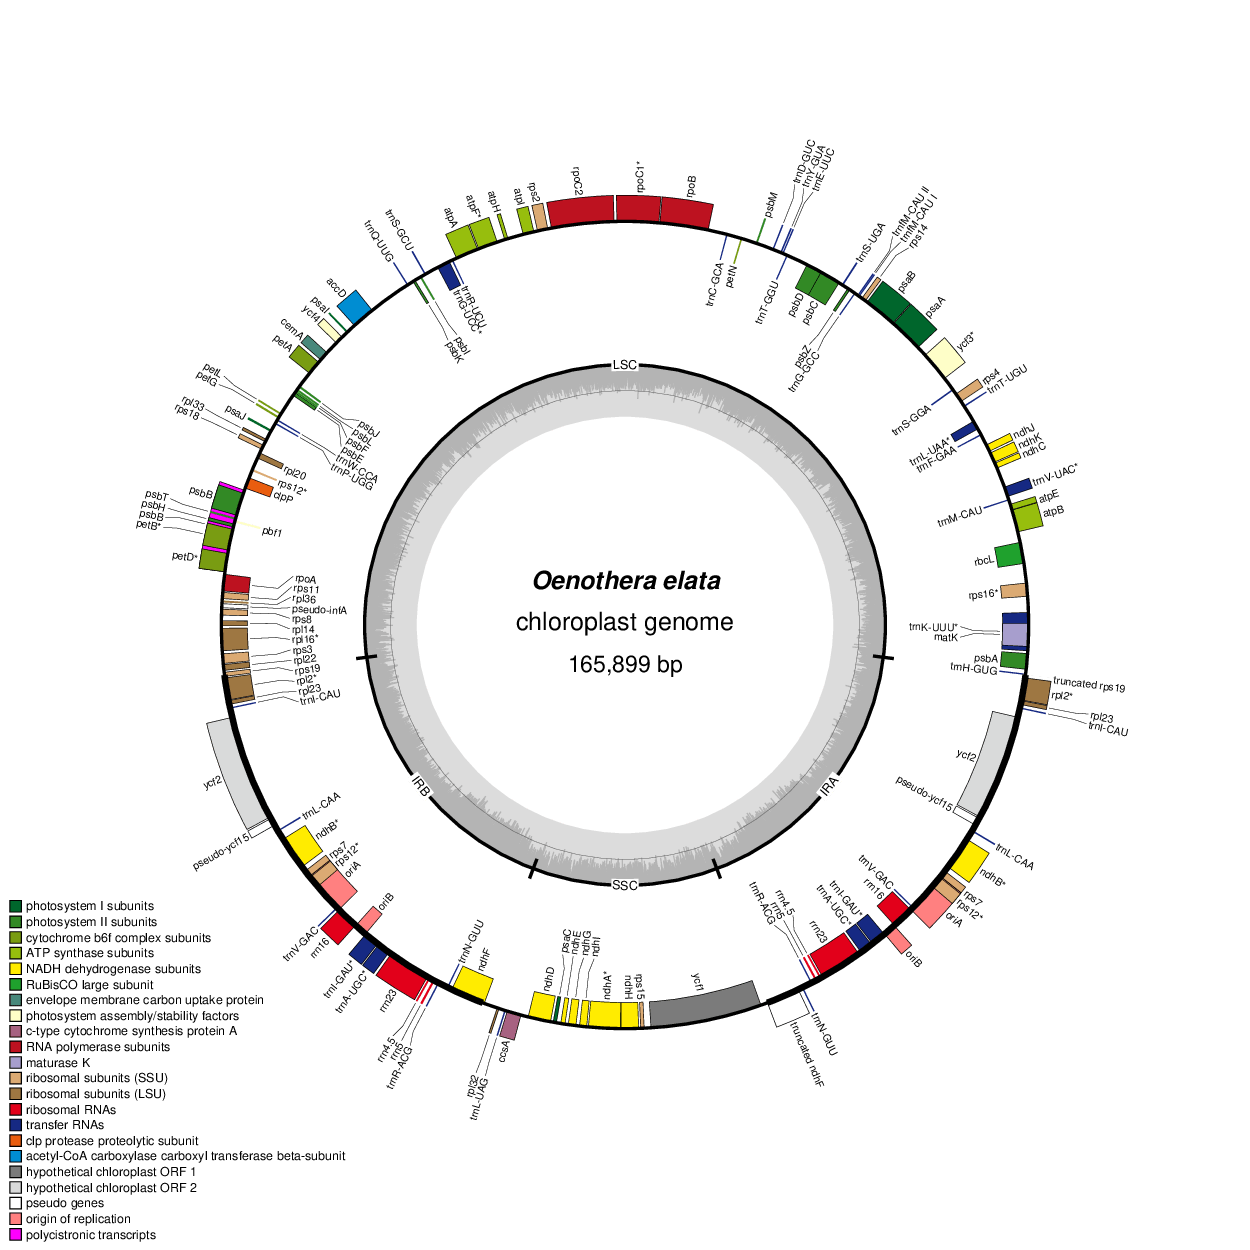
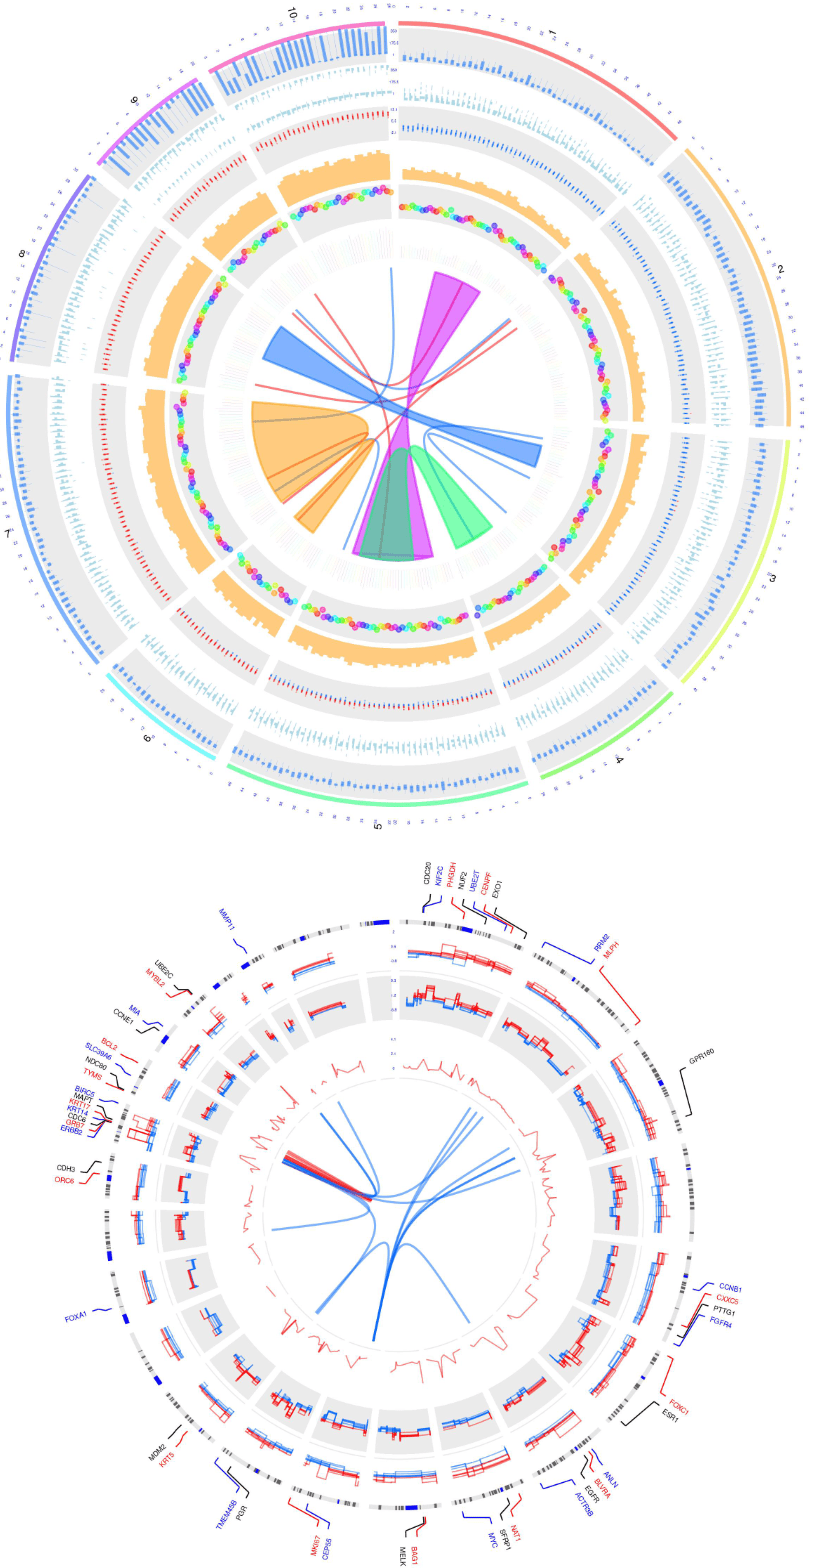
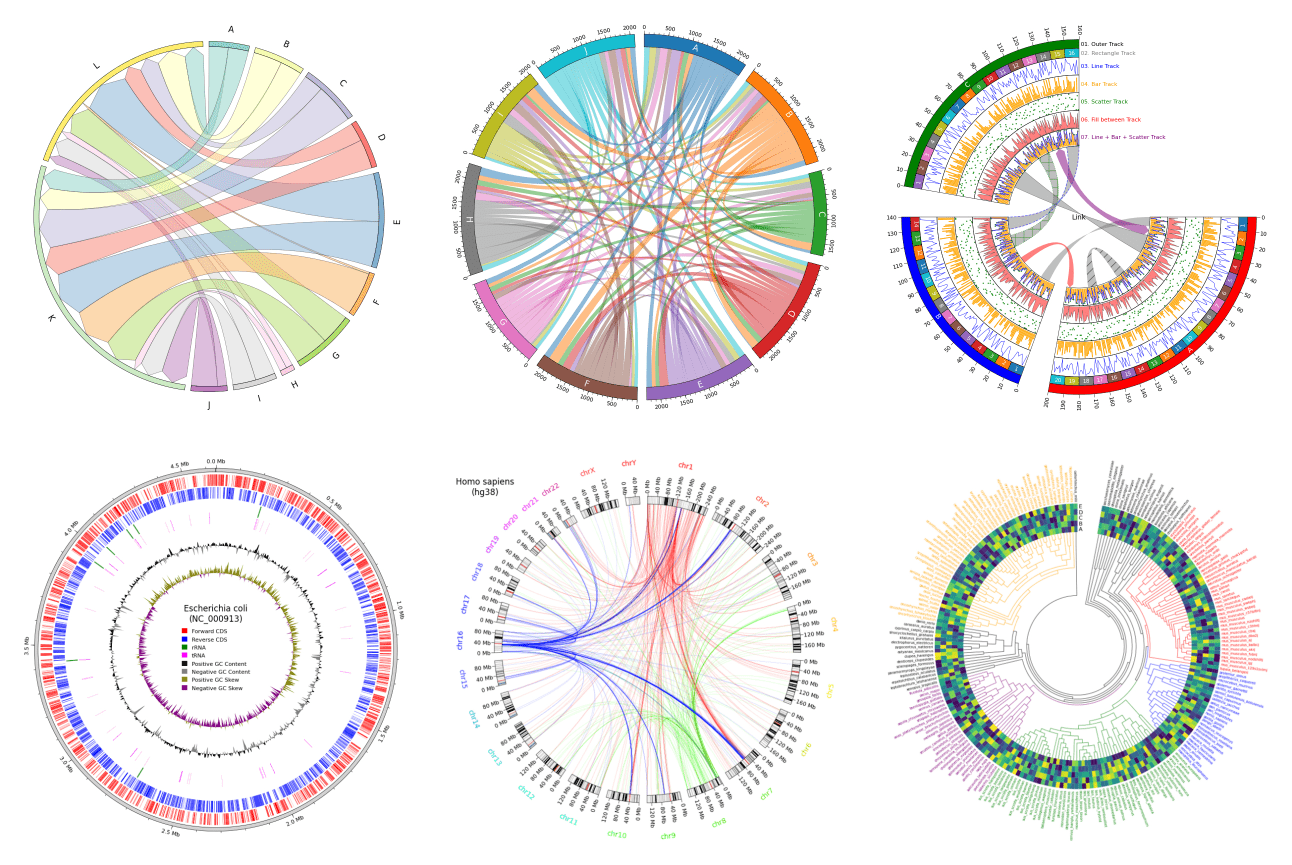
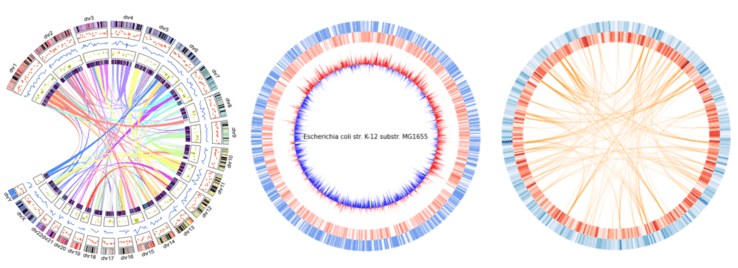
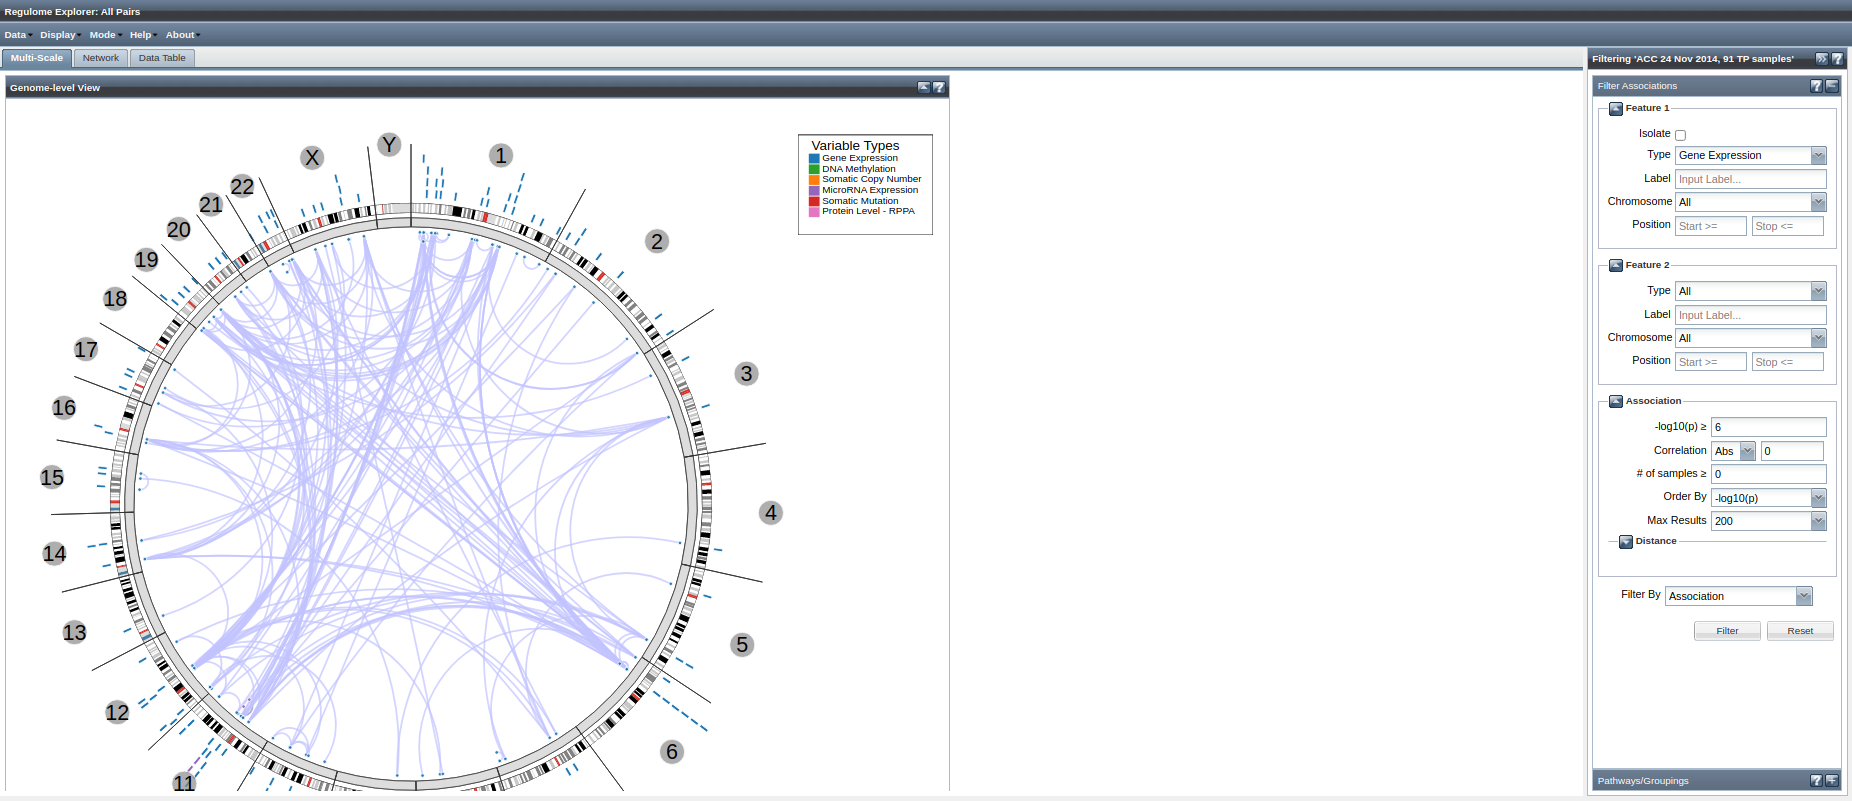
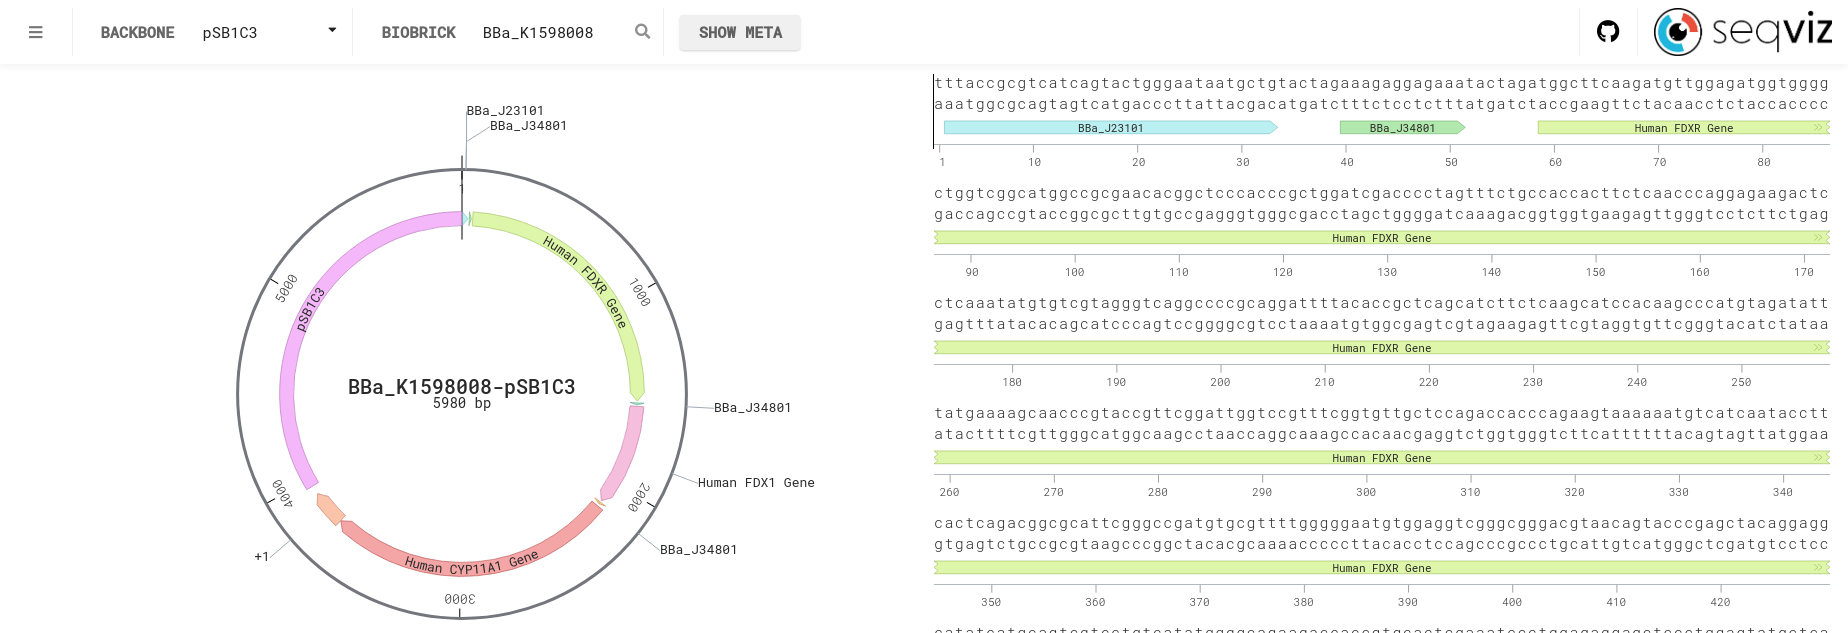
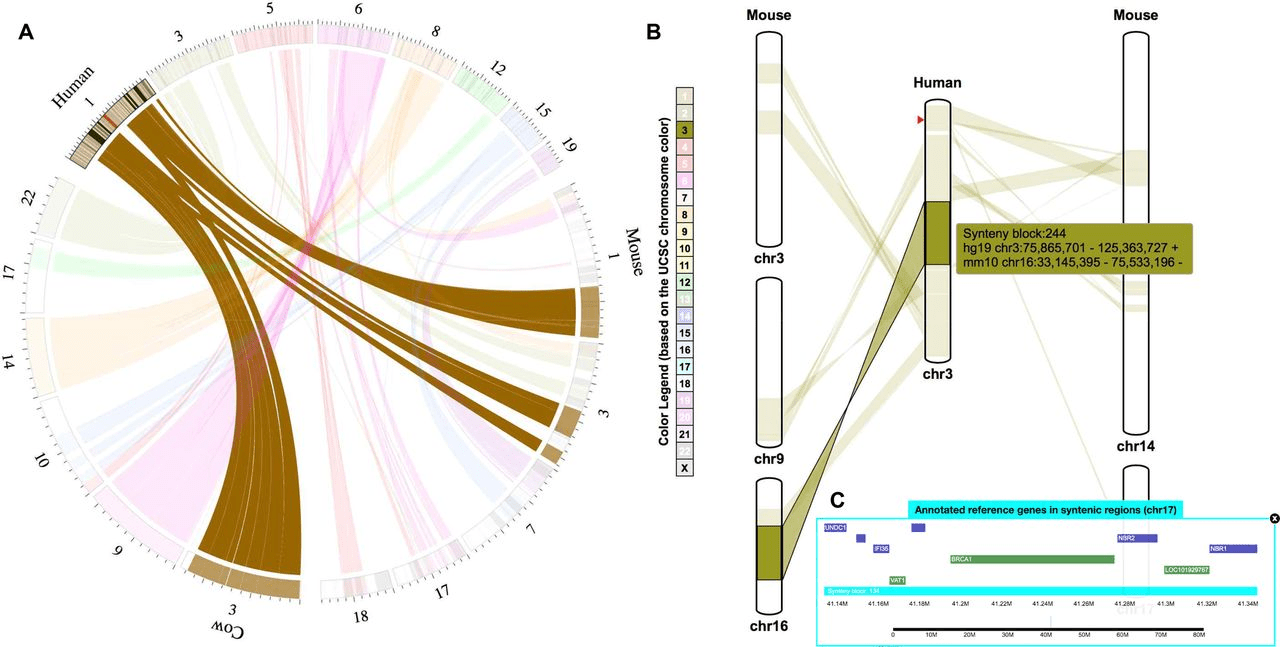
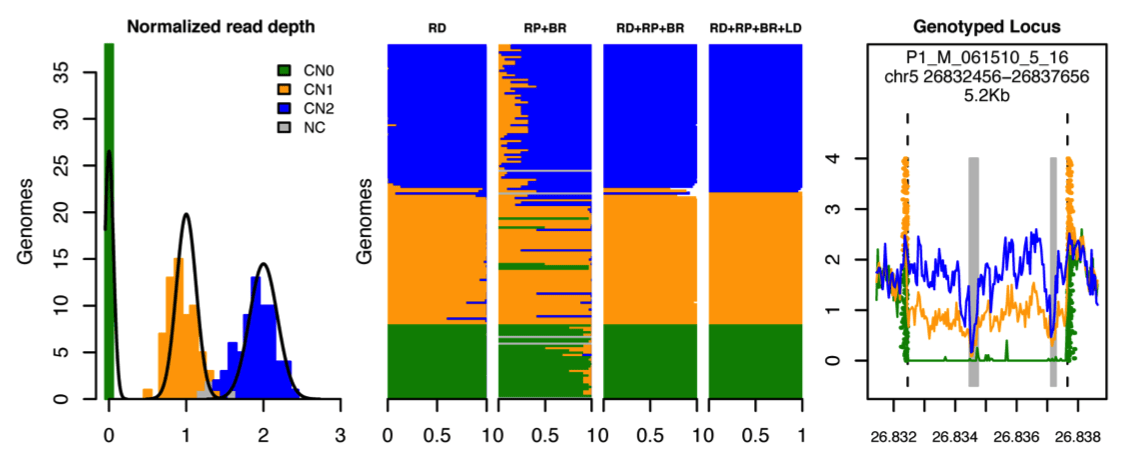
- aCNVViewer (img)
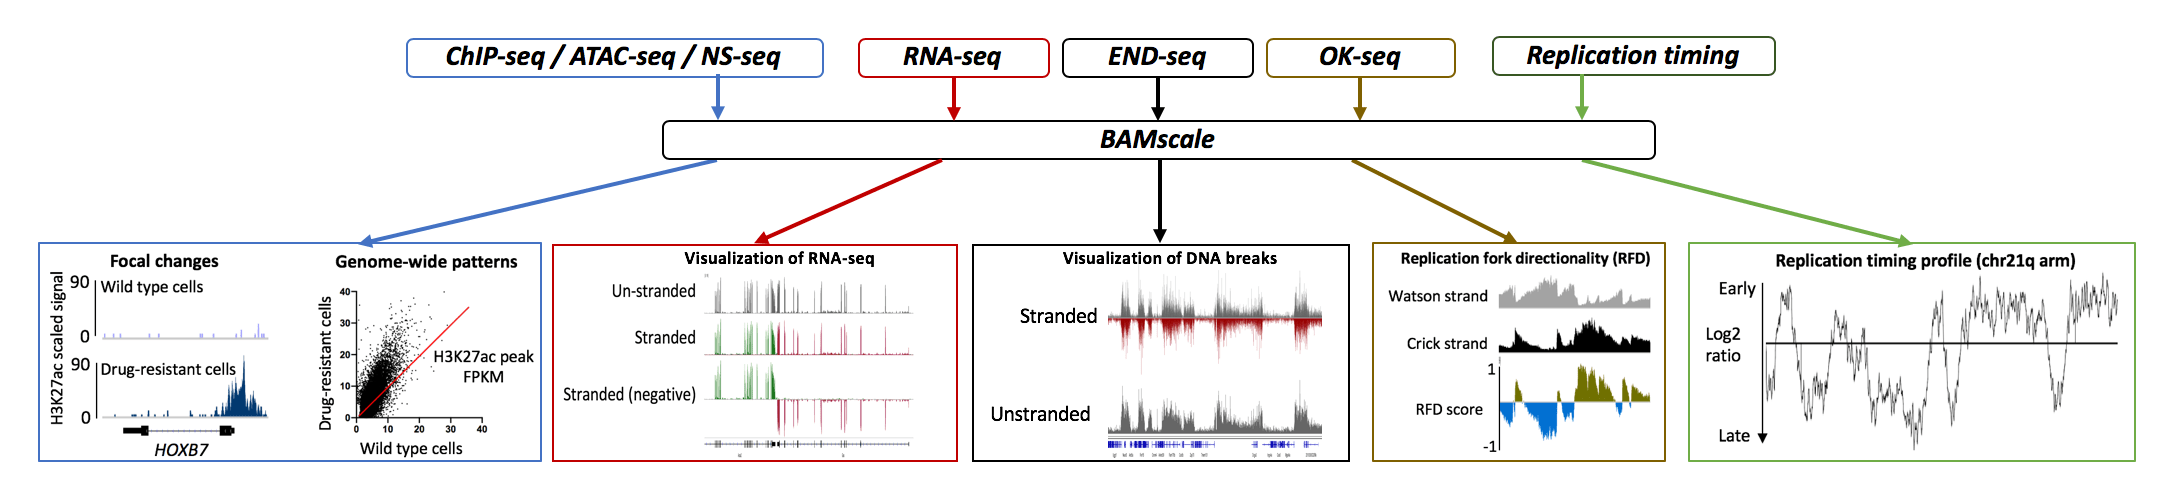
- BAMScale (img)
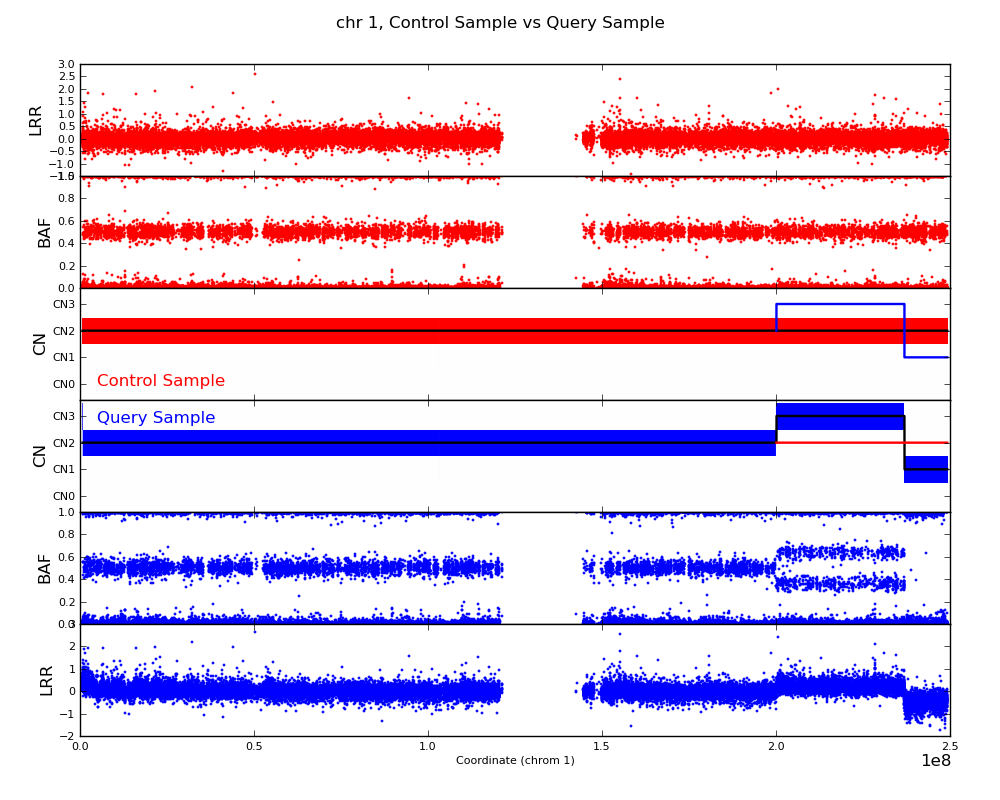
- bcftools cnv (img)
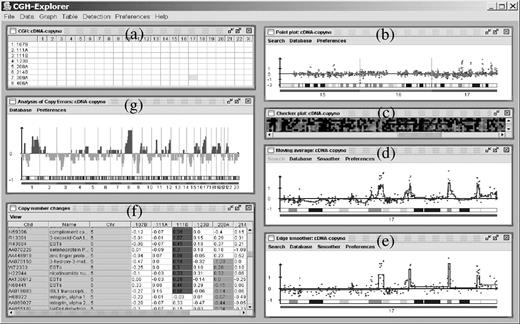
- CGH-Explorer (img)
- CNANorm (img)
- CNSpector (img)
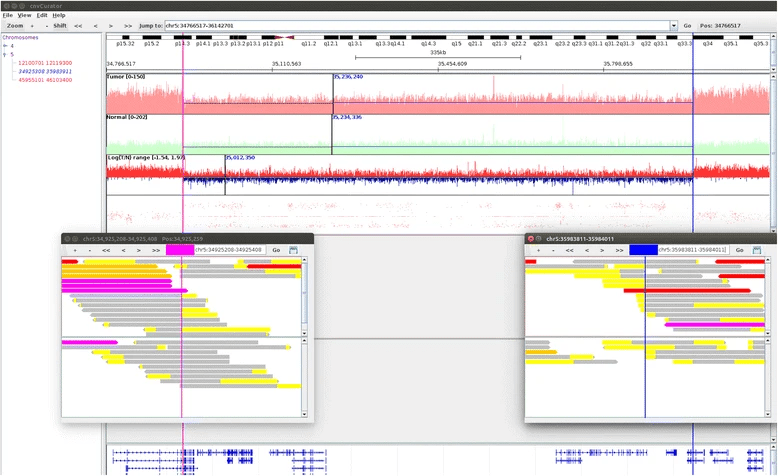
- cnvCurator (img)
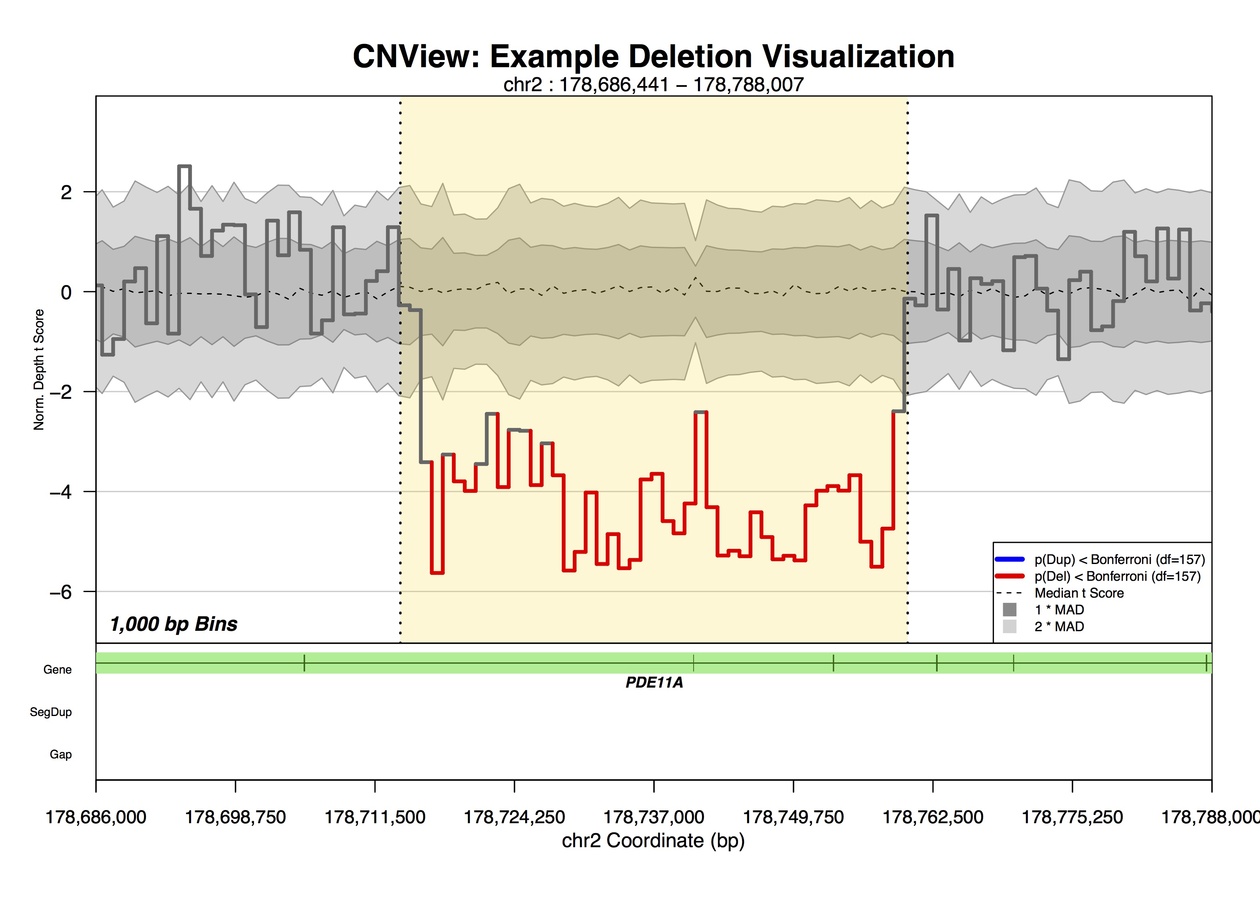
- CNView (img)
- CNVkit (img)
- CNVPlot (img)
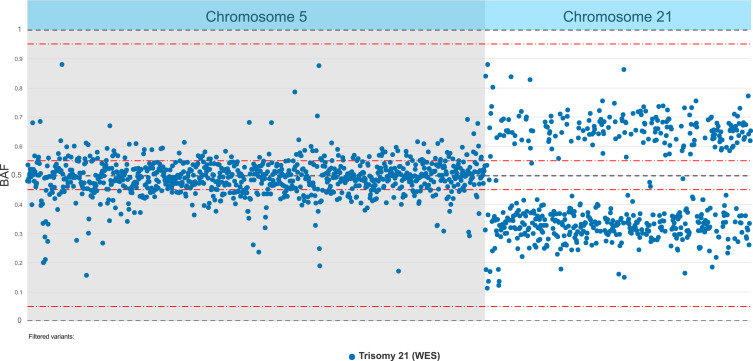
- CNVpytor (img)
- copynumber (img)
- CoveragePlotter (See also http://lindenb.github.io/jvarkit/WGSCoveragePlotter.html for multi-chromosome) (img)
- covviz (img)
- genevisR (img)
- genome_coverage_plotter (img)
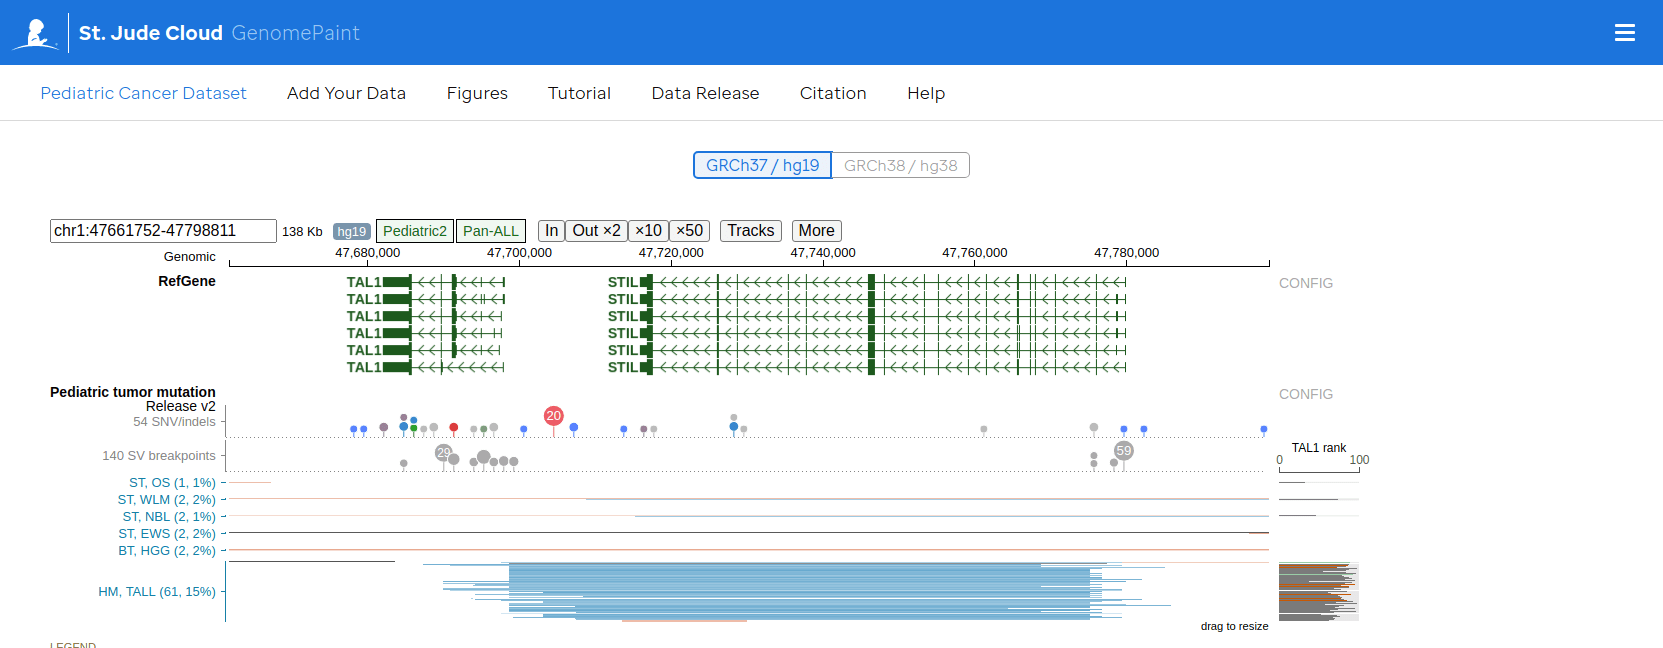
- GenomePaint (Demos https://proteinpaint.stjude.org/bam/) (img)
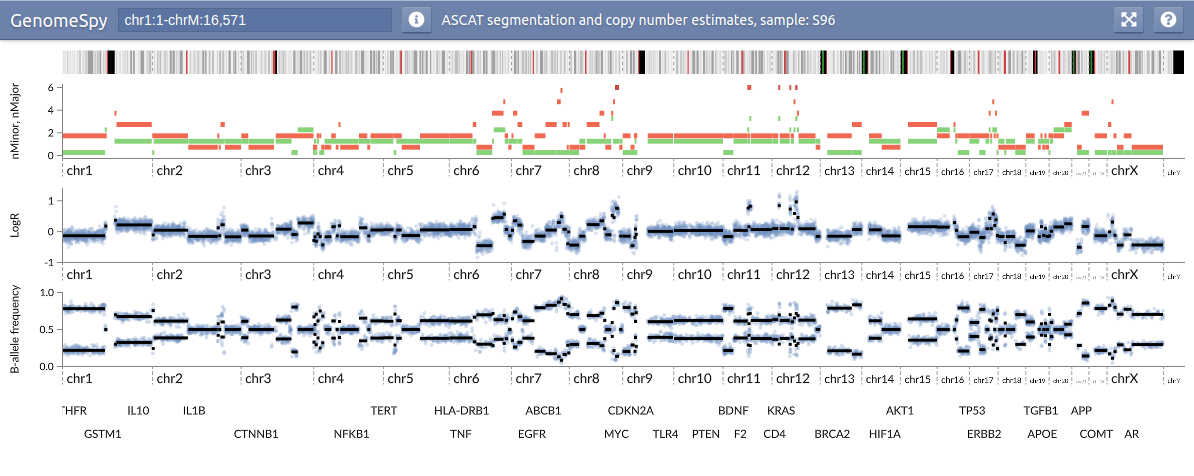
- GenomeSpy (img)
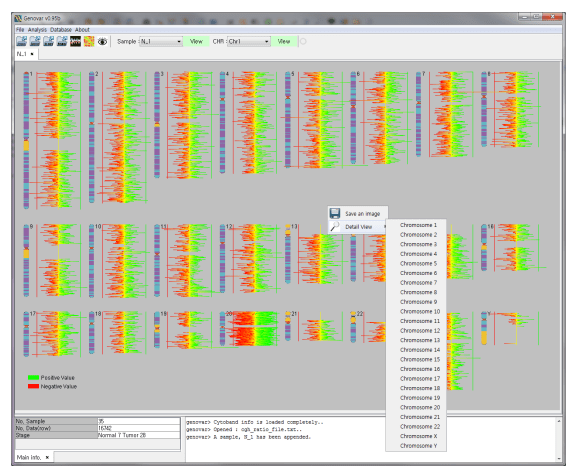
- Genovar (img)
- mocha (Has a full analysis pipeline associated with end result visualizations) (img)
- Orchestral (img)
- PURPLE (intermutation-distance rainfall plots/katagesis plots are not technically in genomic coordinates, but do indicate genomic cluster of variants) (img)
- SeeNV (img)
- sequenza (also see https://sequenzatools.bitbucket.io/#/home) (img)
- SFARI (img)
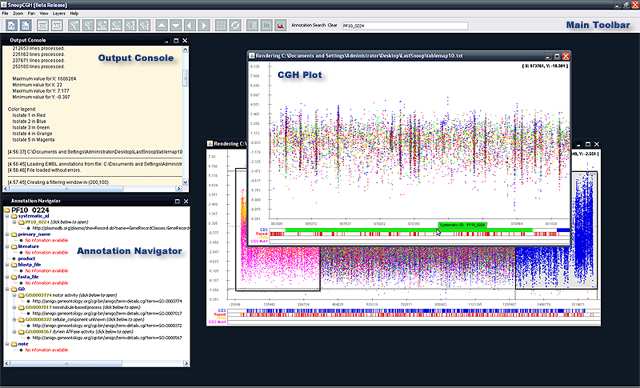
- SnoopCGH (img)
- SNPitty (img)
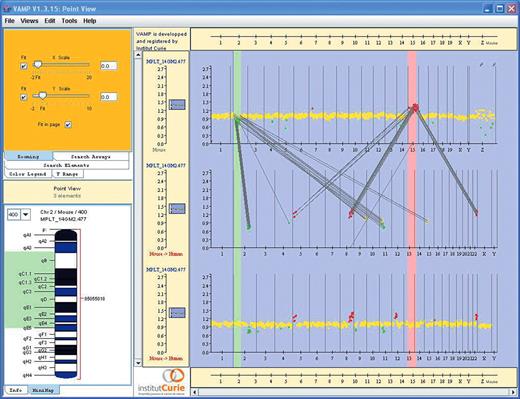
- VAMP (img)
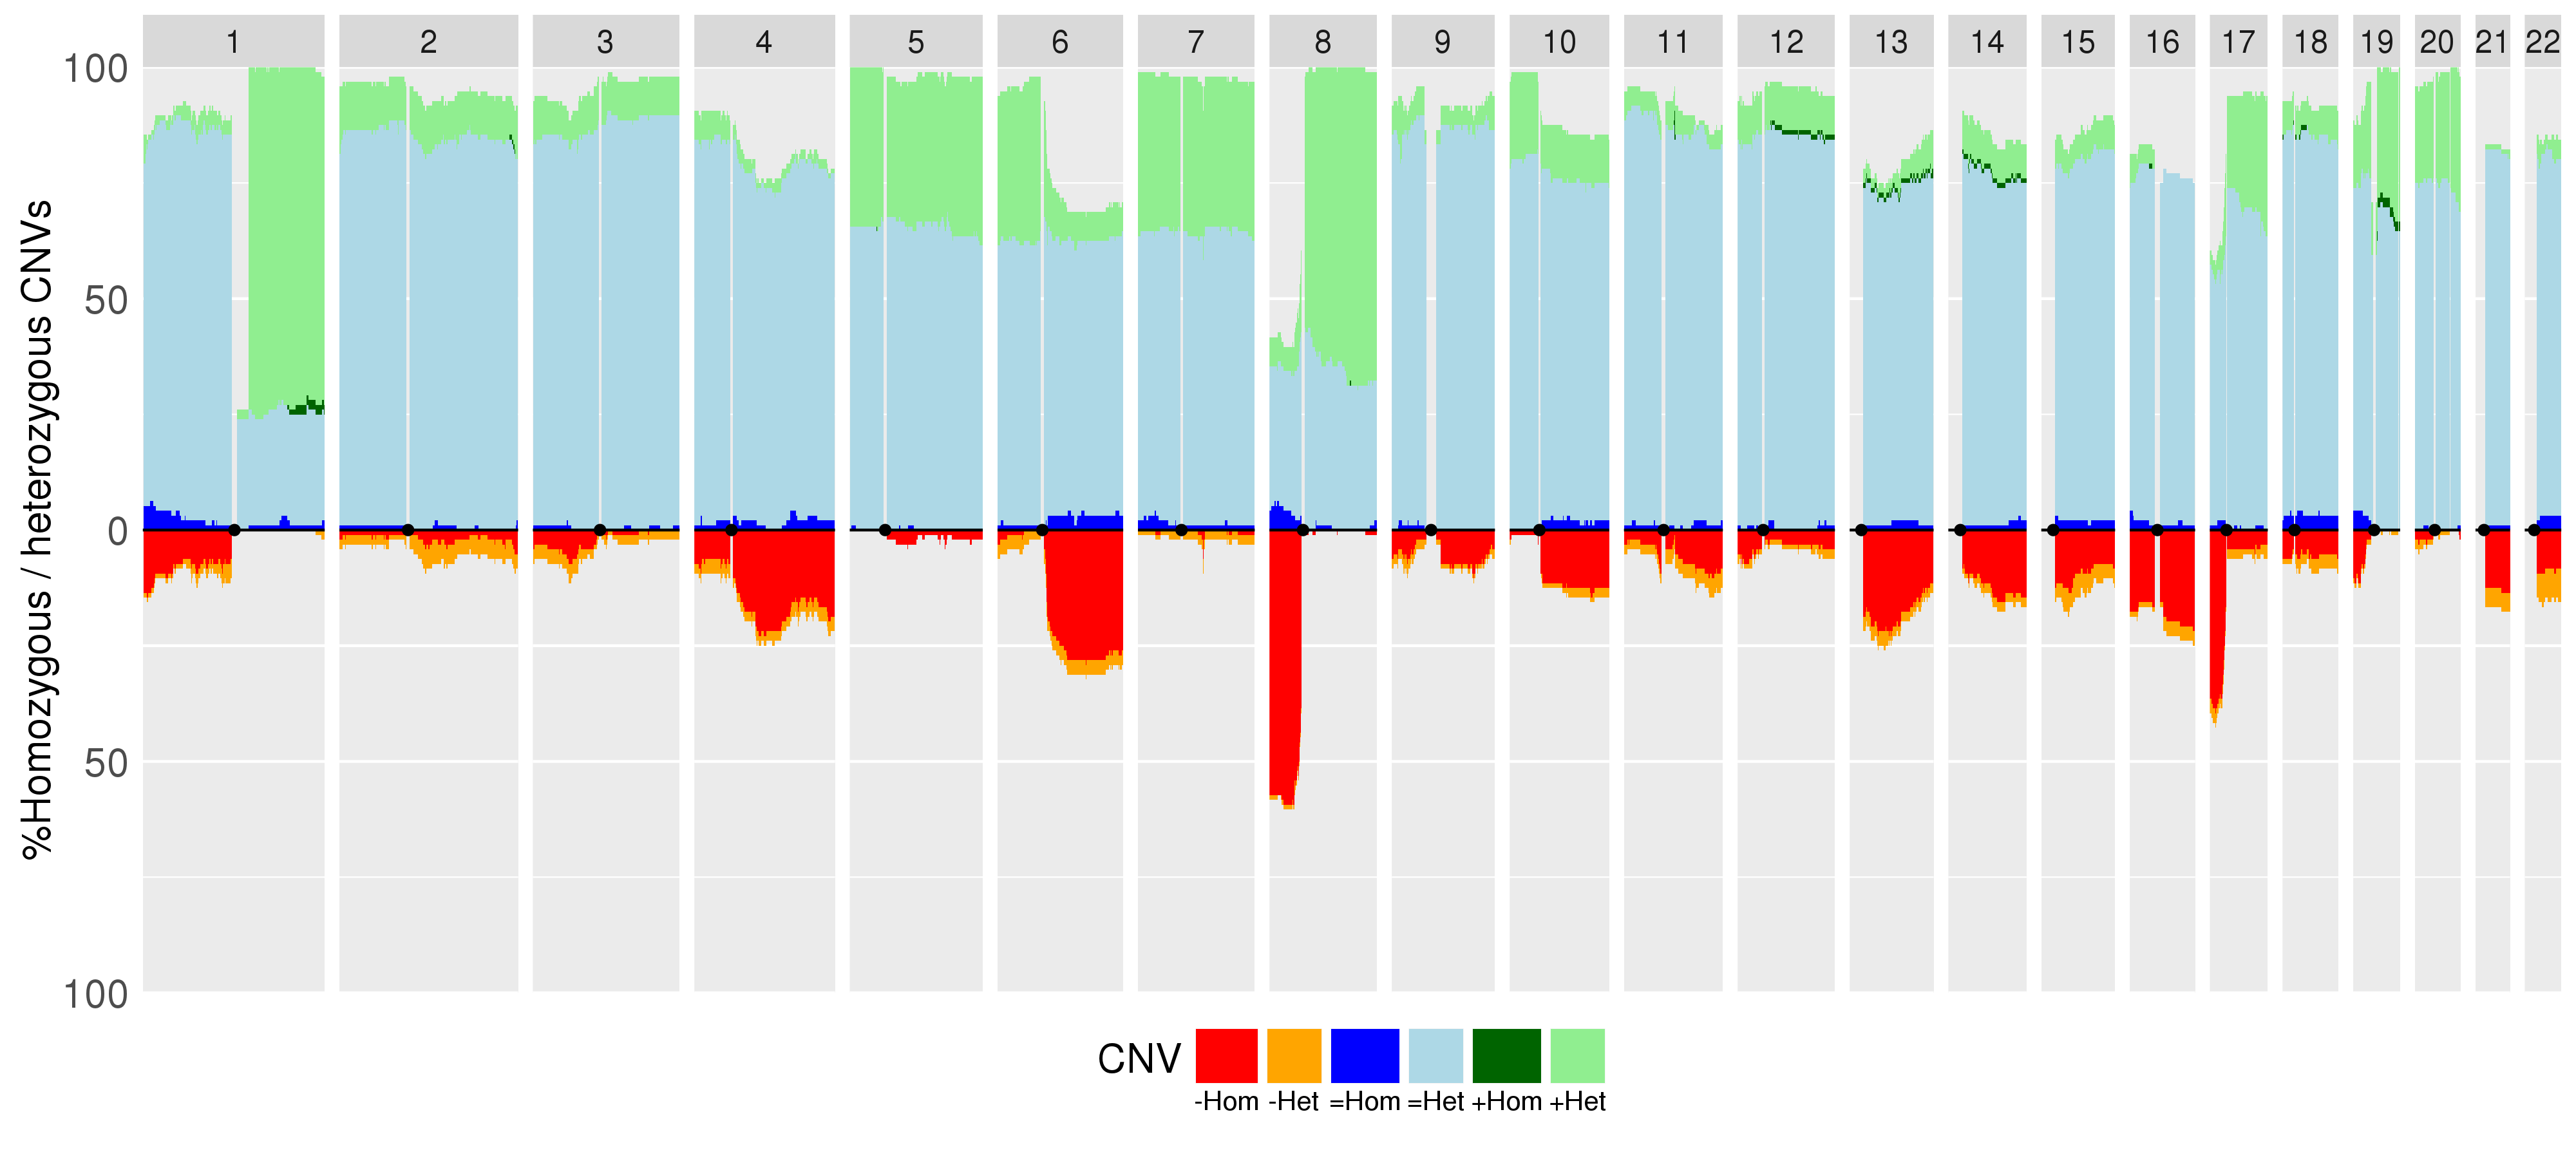
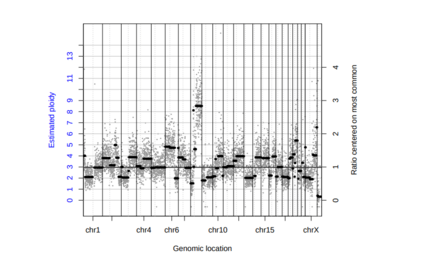
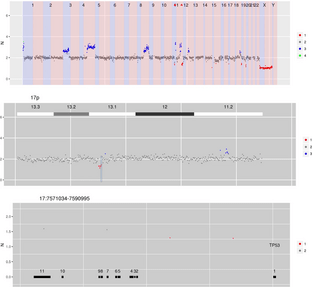
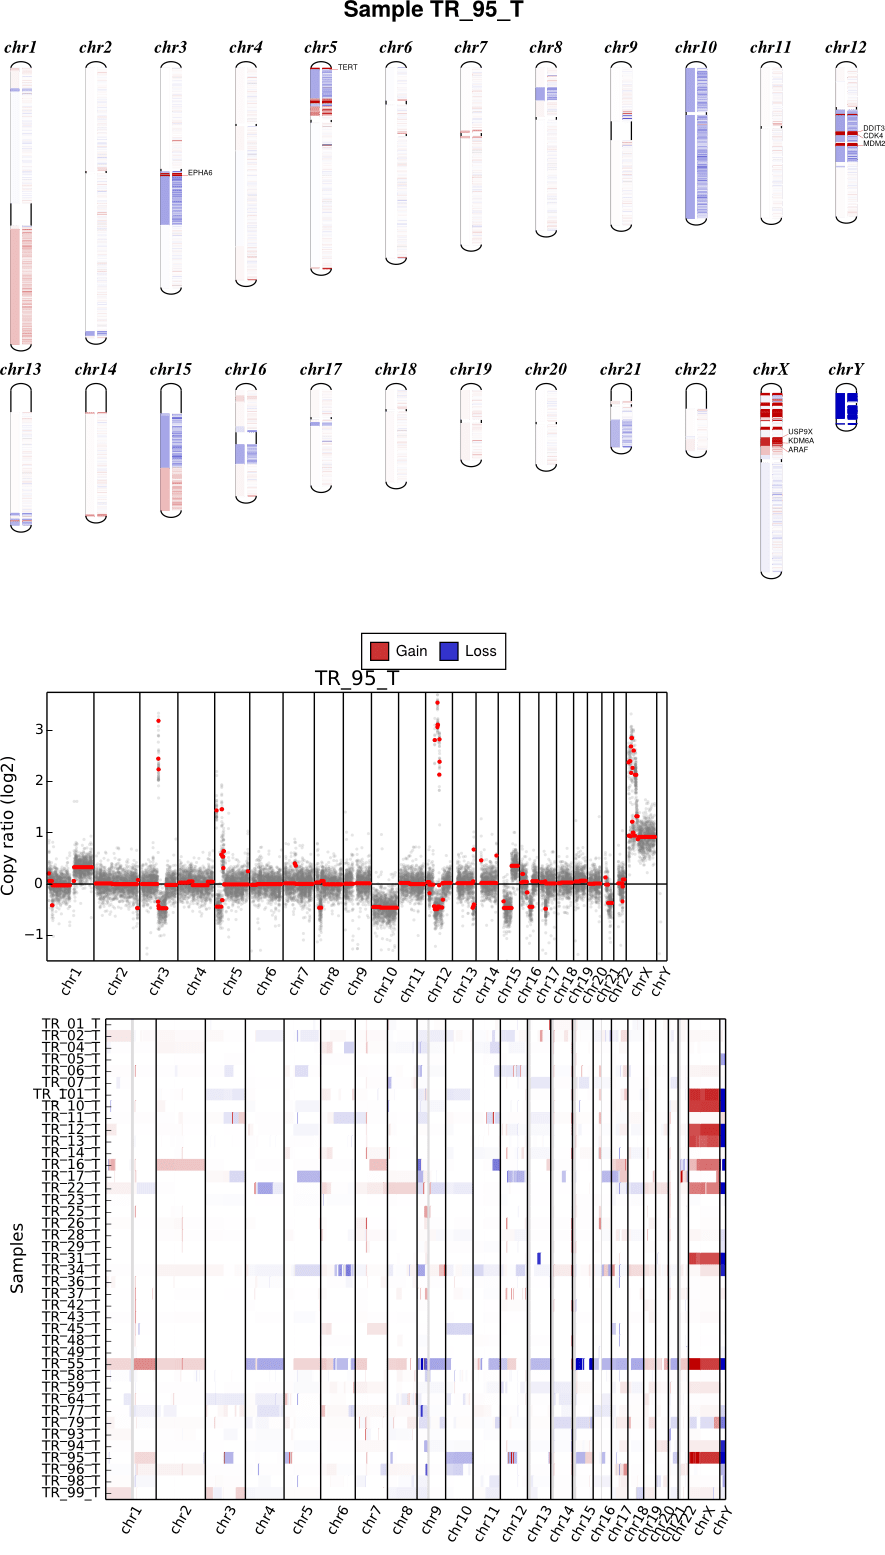
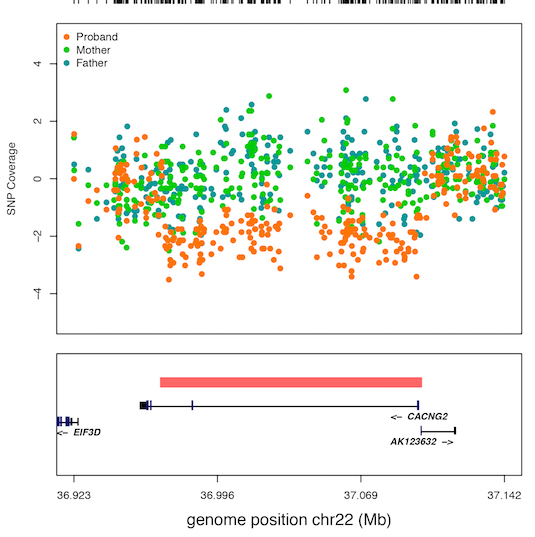
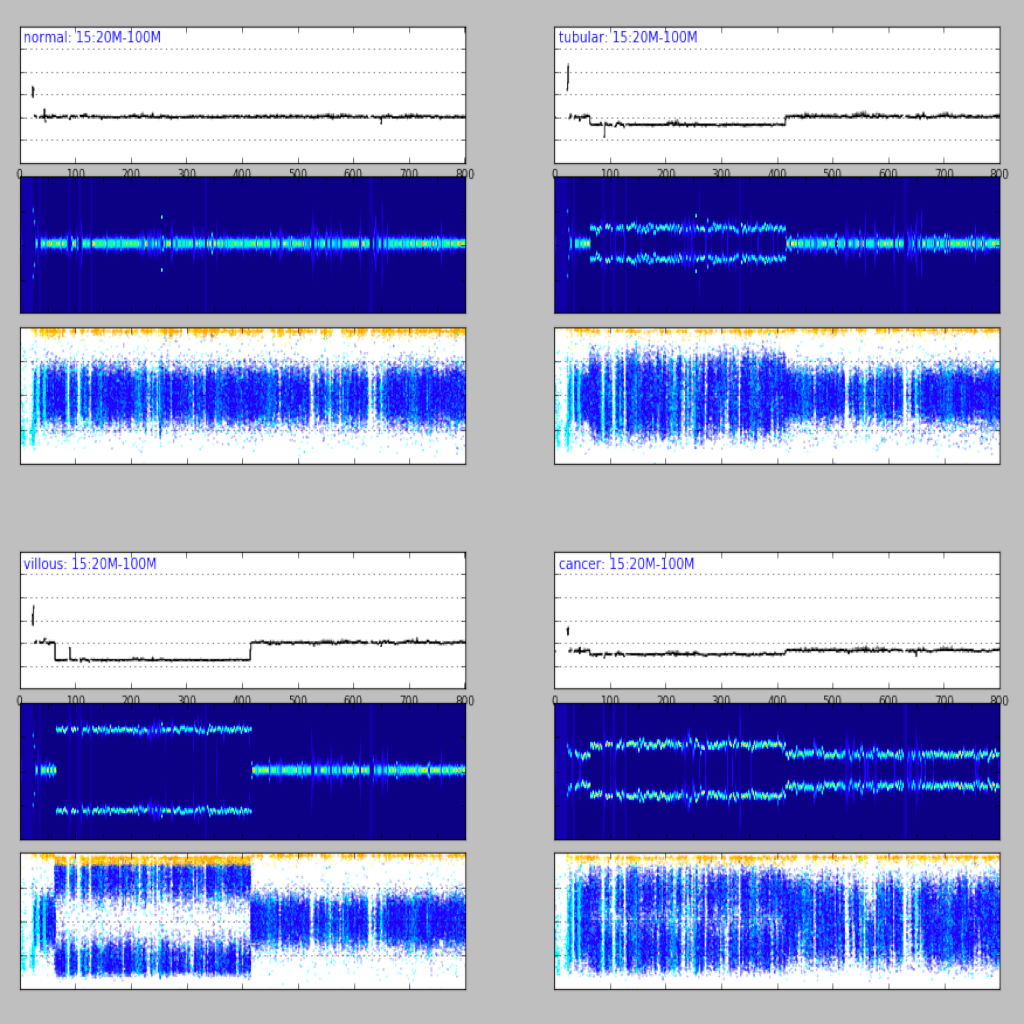
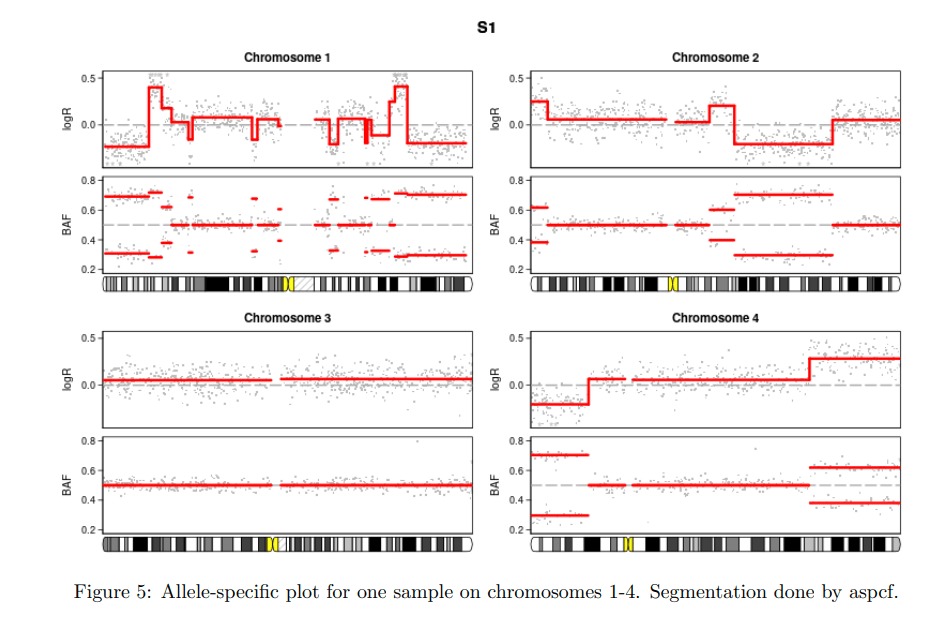
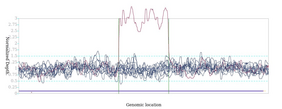
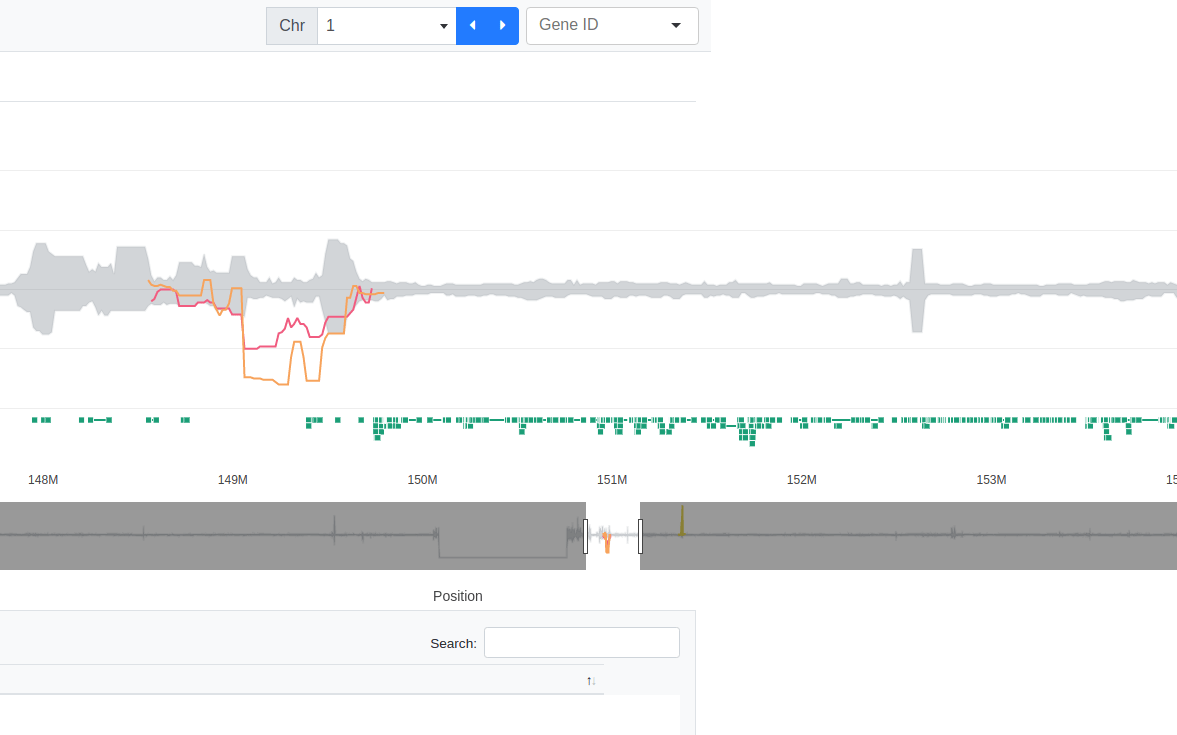
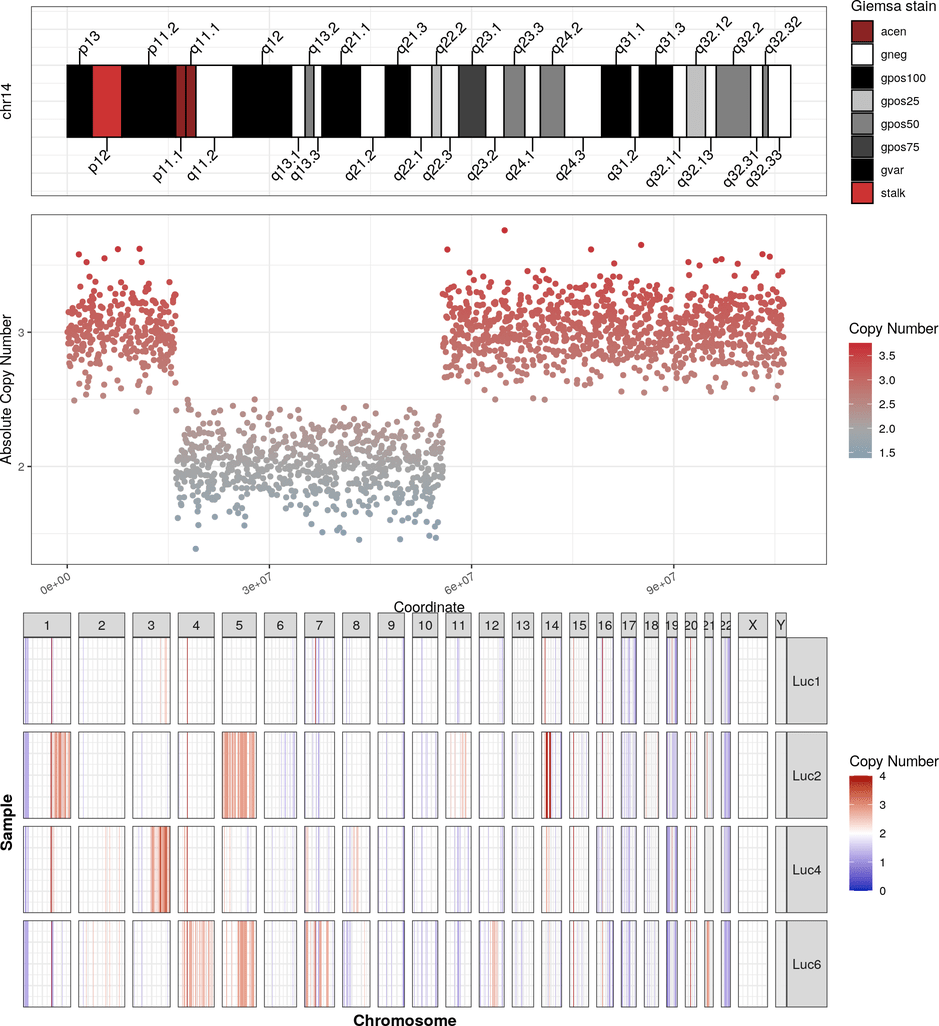
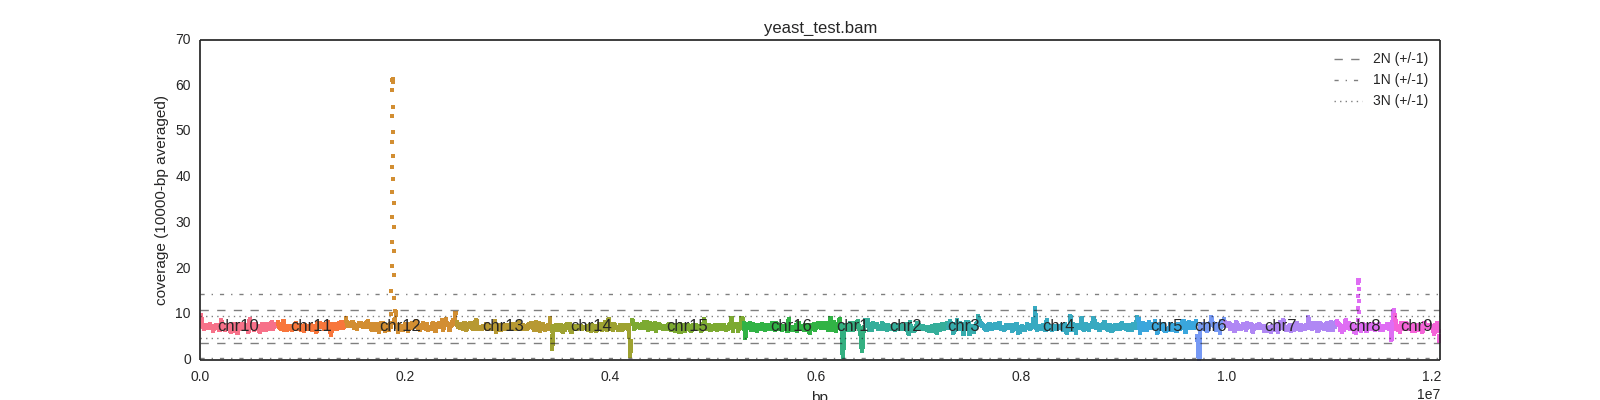
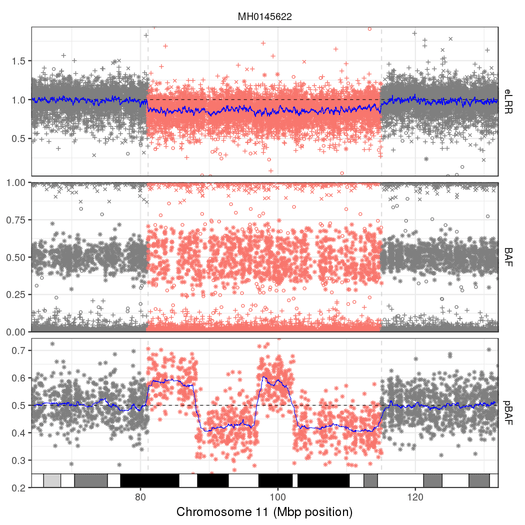
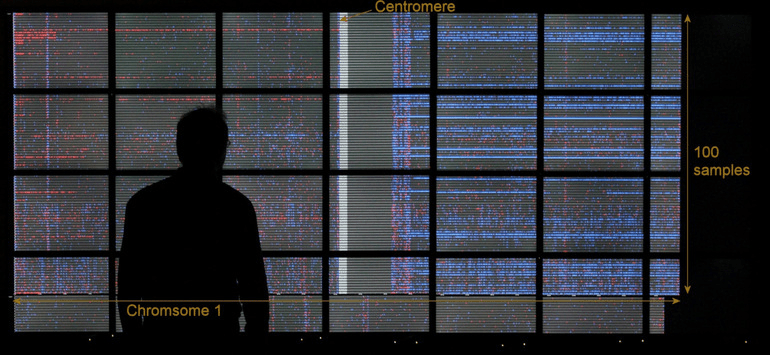

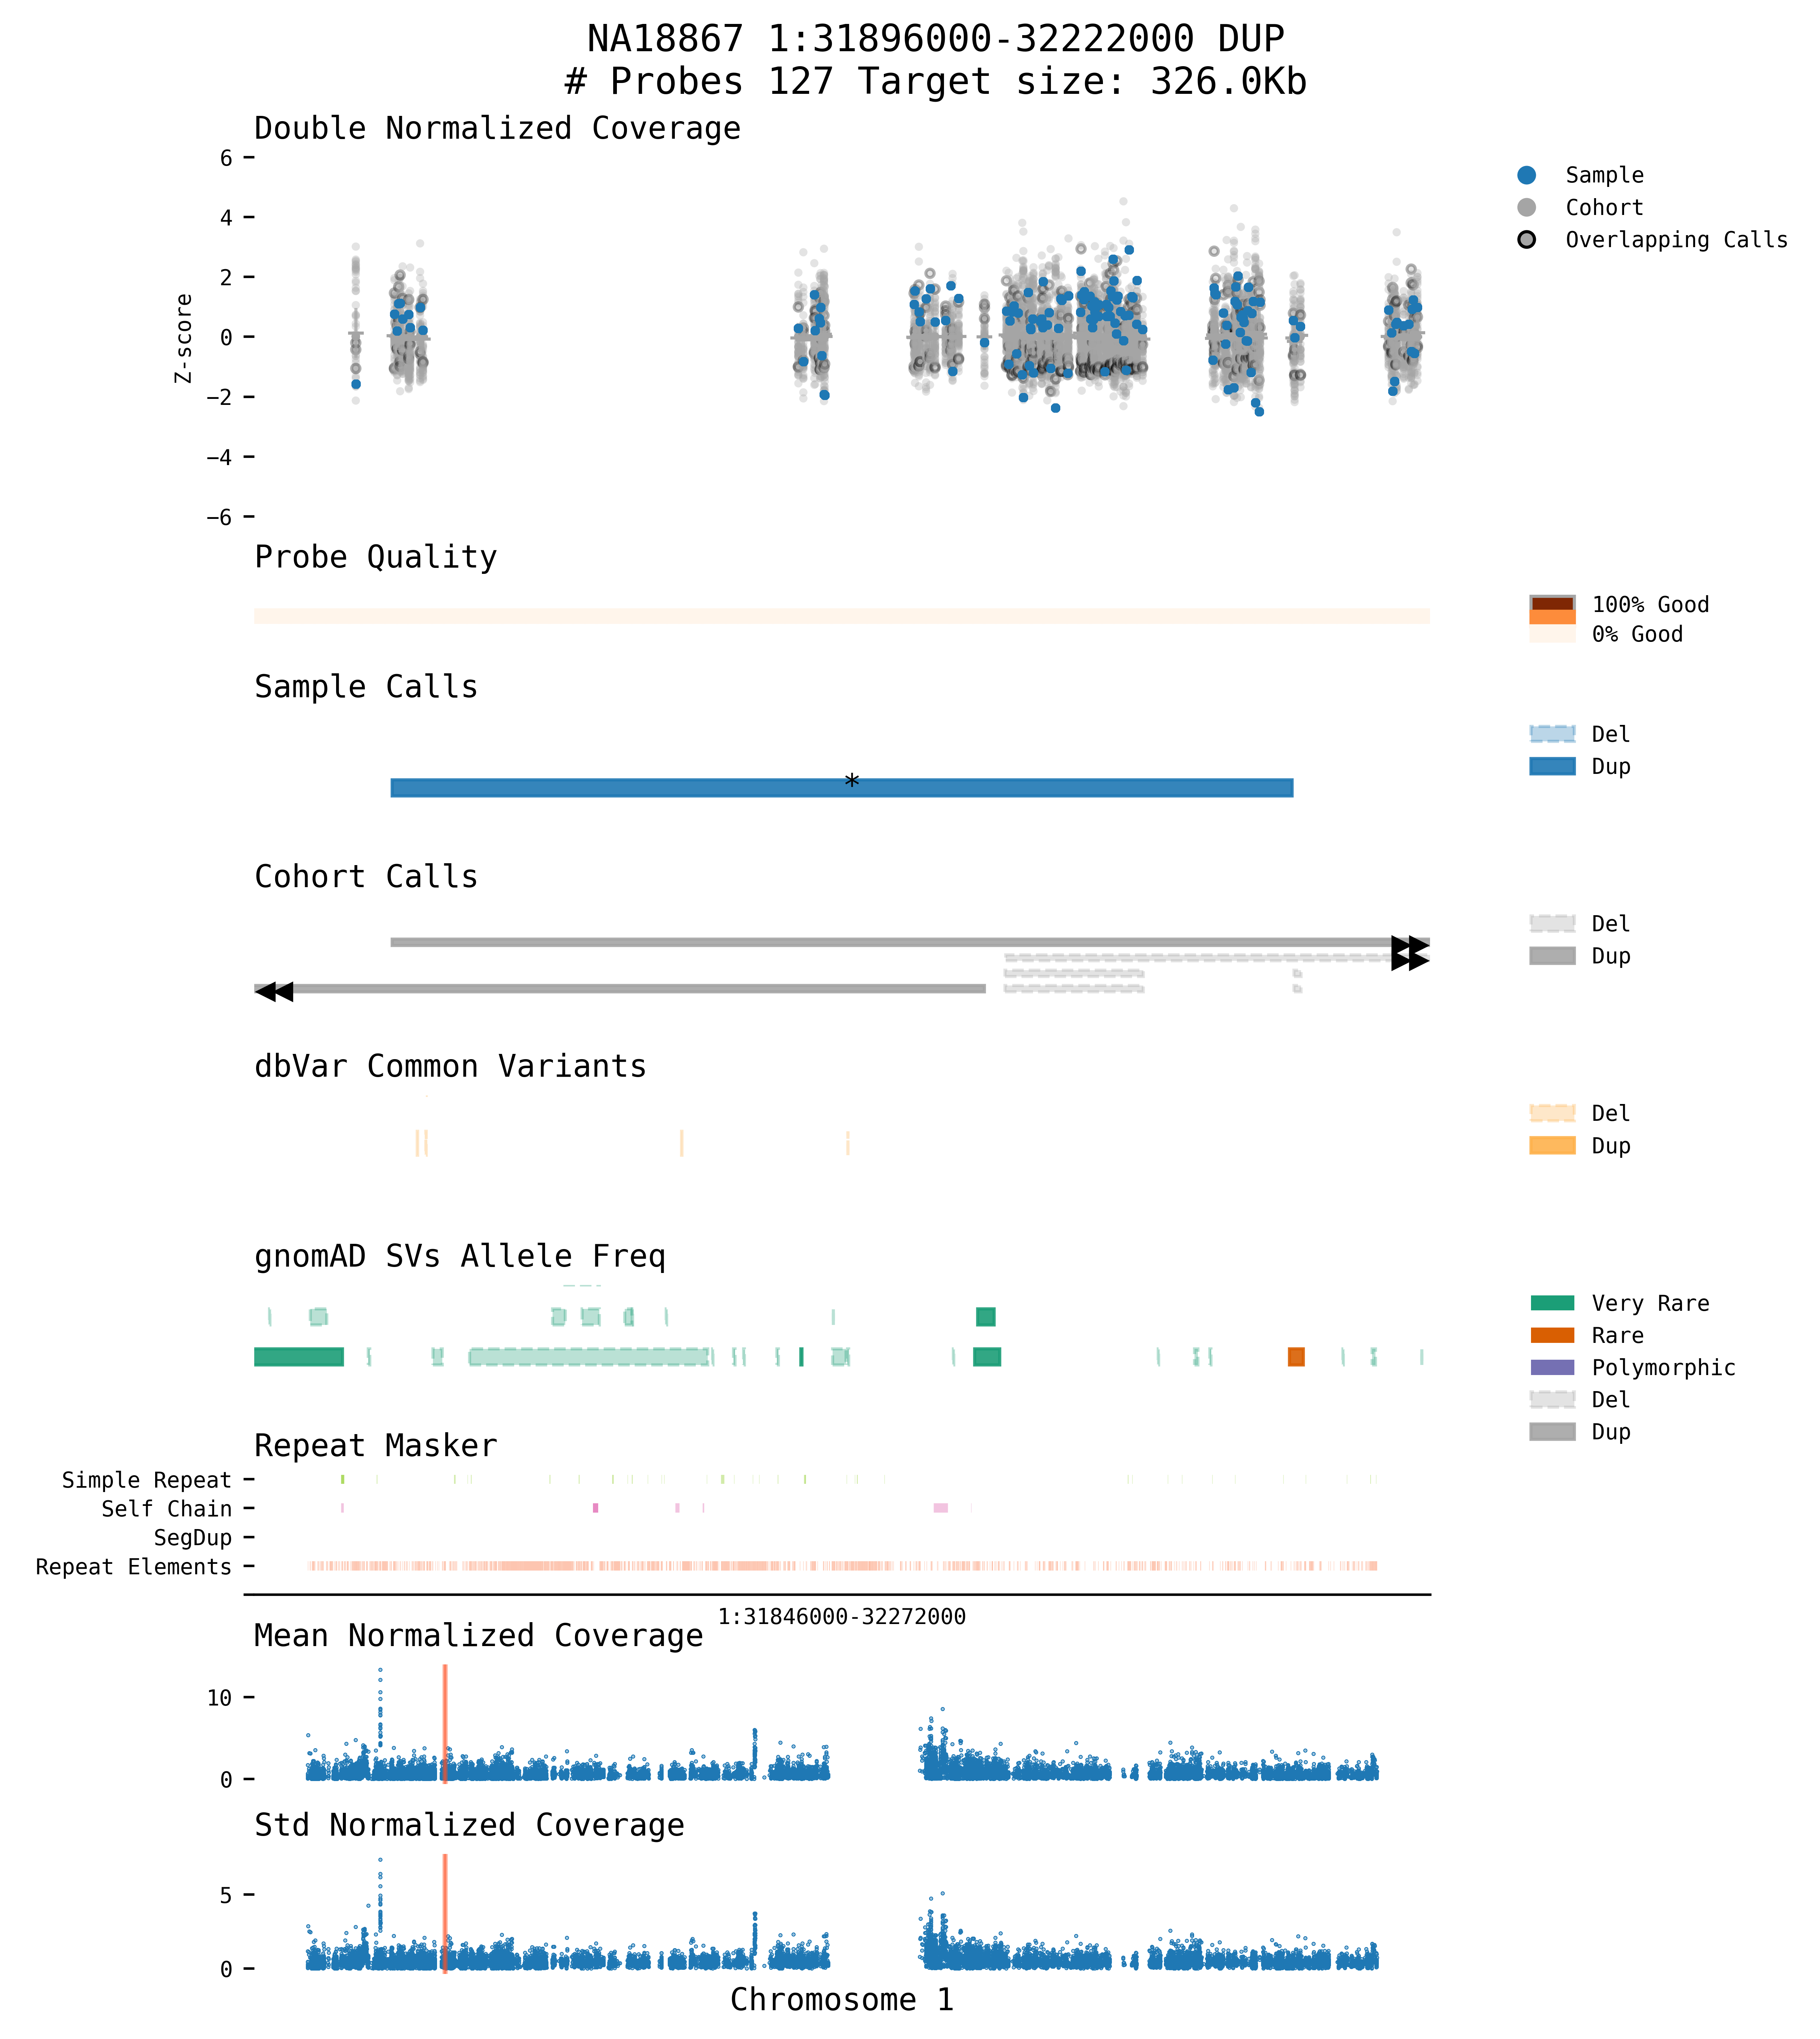
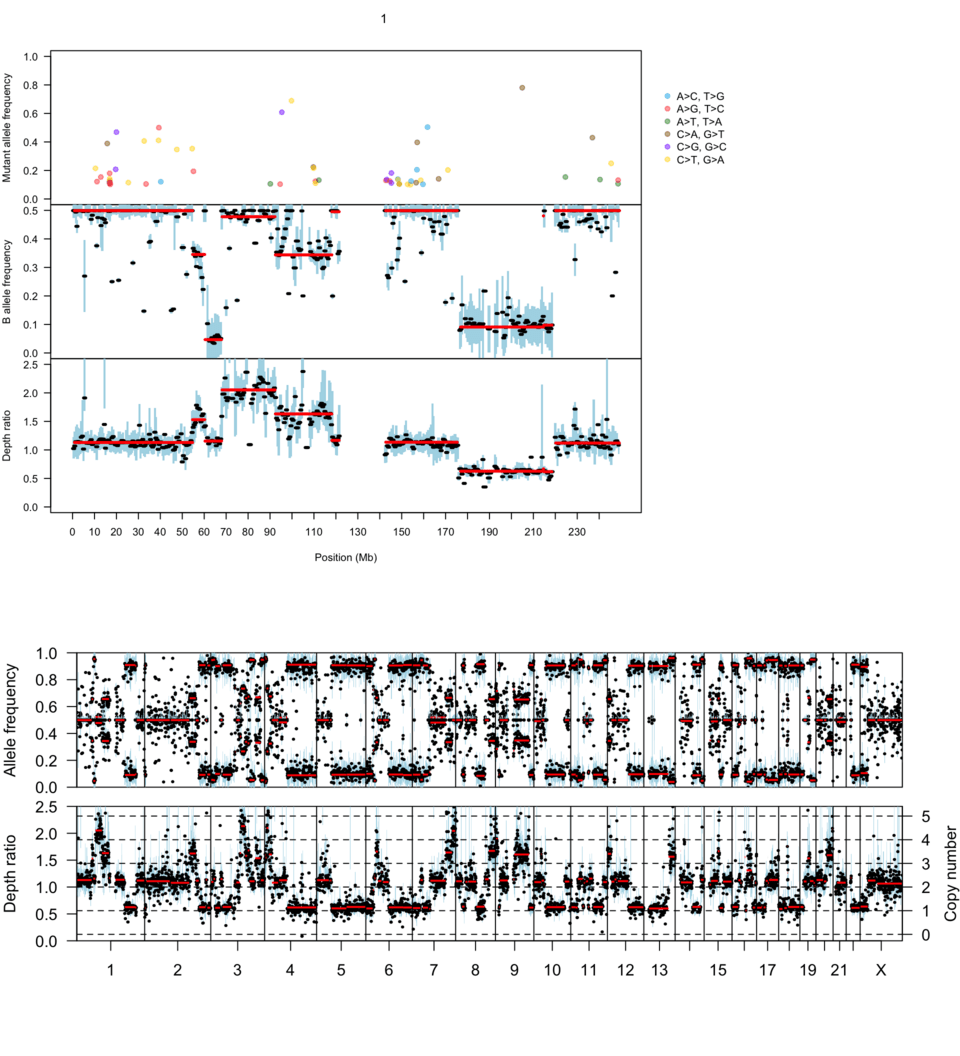
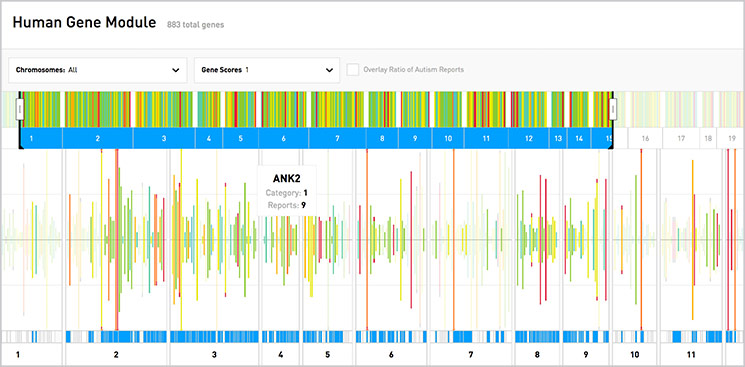
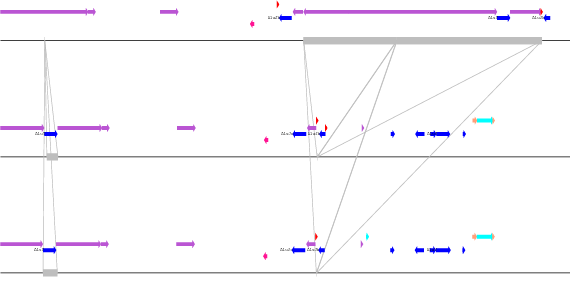
- Combo (Based on the tool 'Argo') (img)
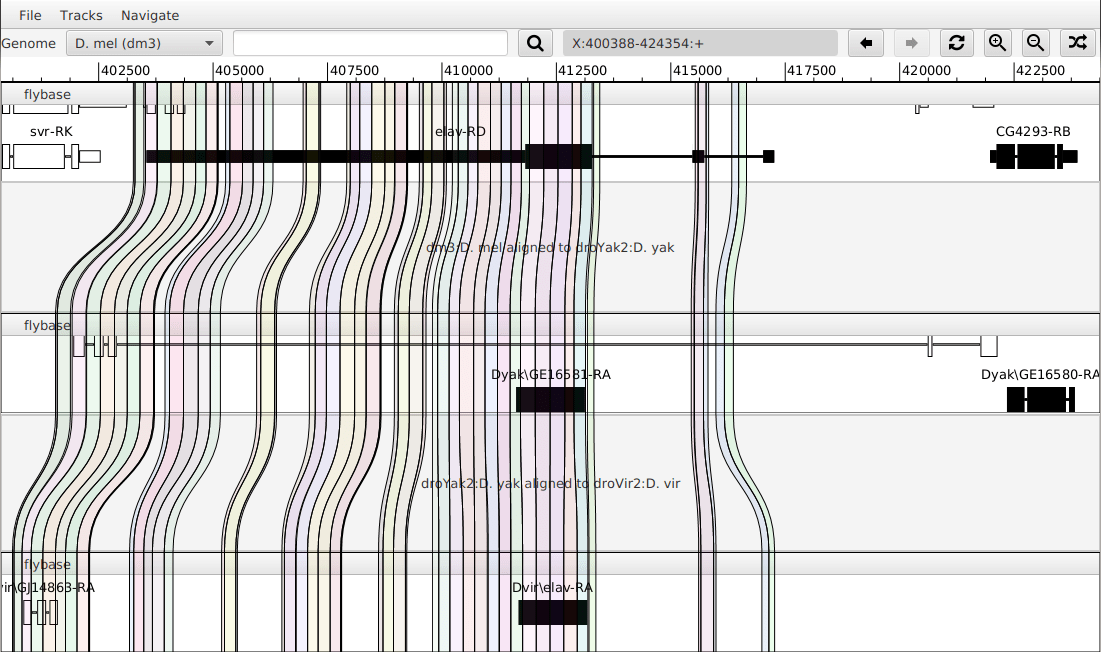
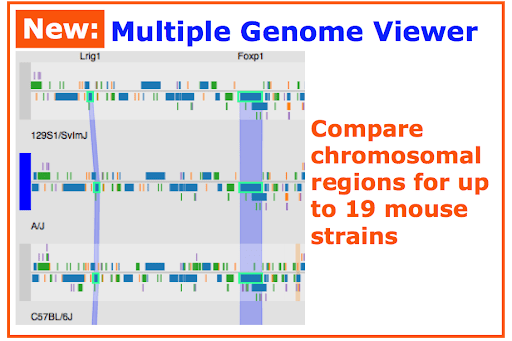
- Multiple genome viewer (img)
- Parasight (Examples at https://ratparalogy.gs.washington.edu/) (img)
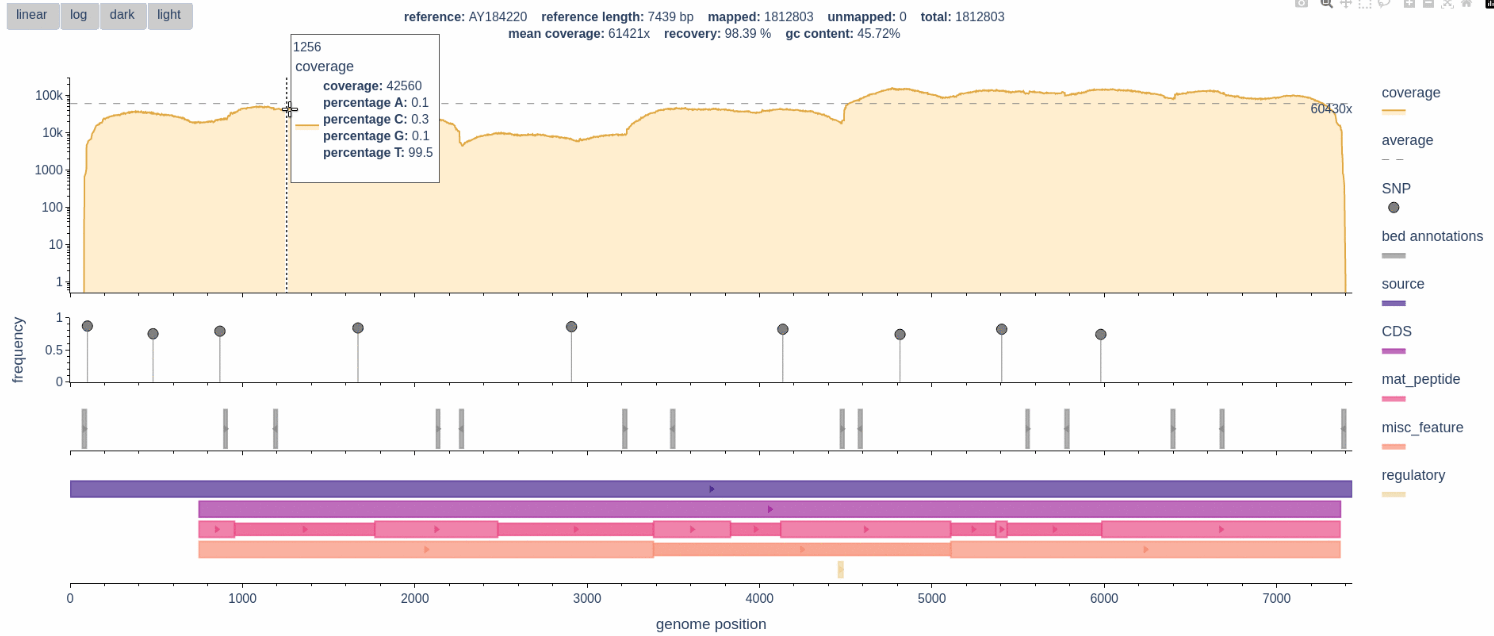
- BAMdash (img)
- dep (Can handle very deep coverage) (img)
- ggcoverage (img)
- Hagfish (img)
- Millefy (img)
- Samtools coverage (img)
- Samtools depth visualization (img)
- SeqCover (img)
- SEQing (img)
- signac (img)
- Trackplot (R) (img)
- wiggleplotr (img)
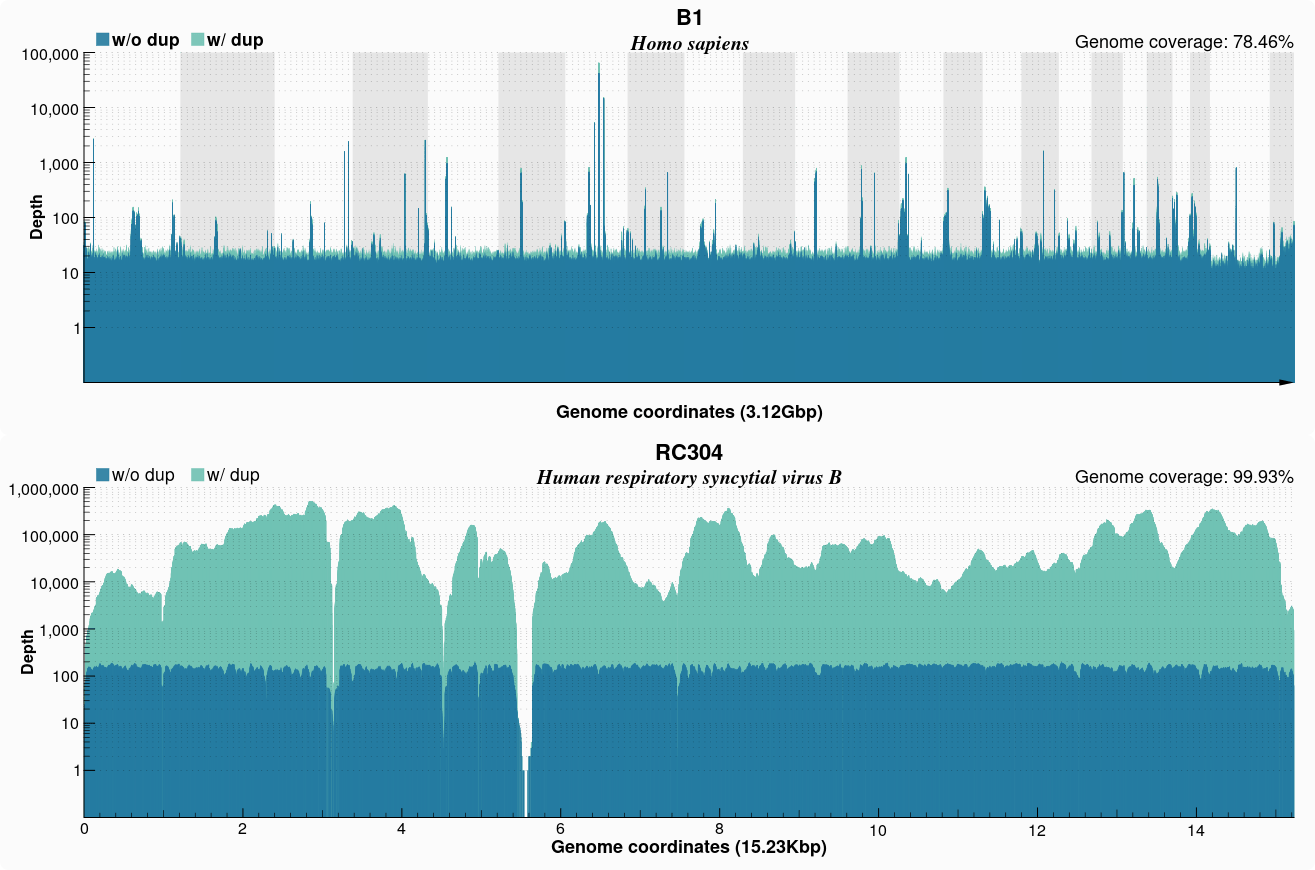
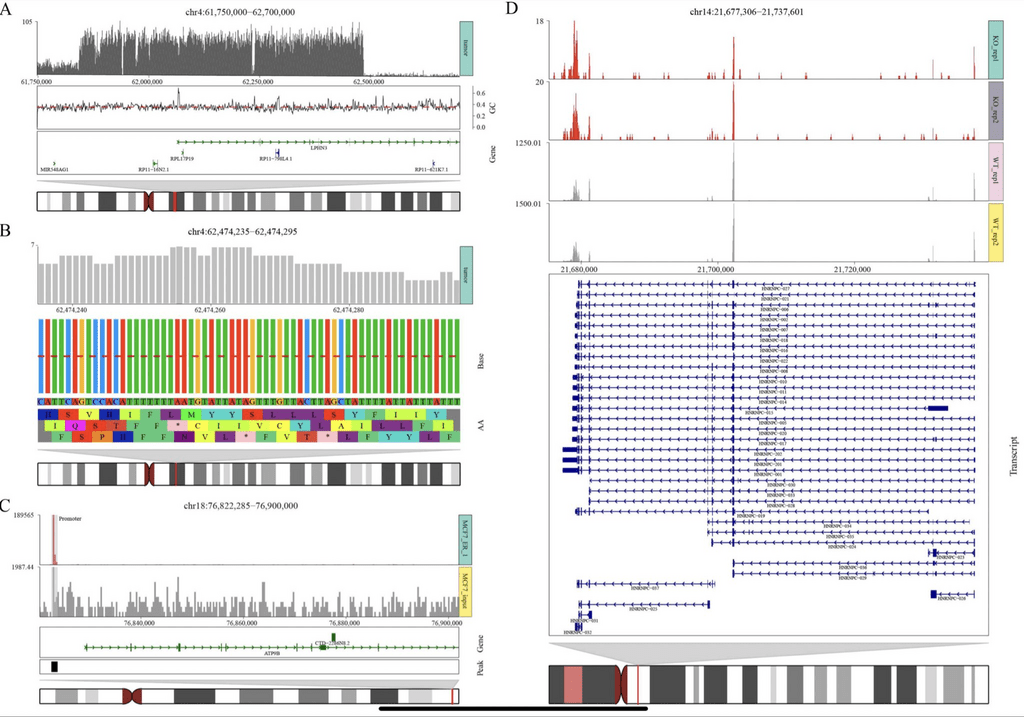
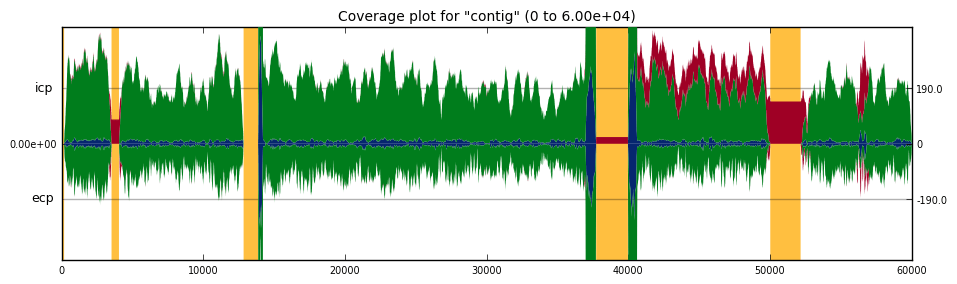
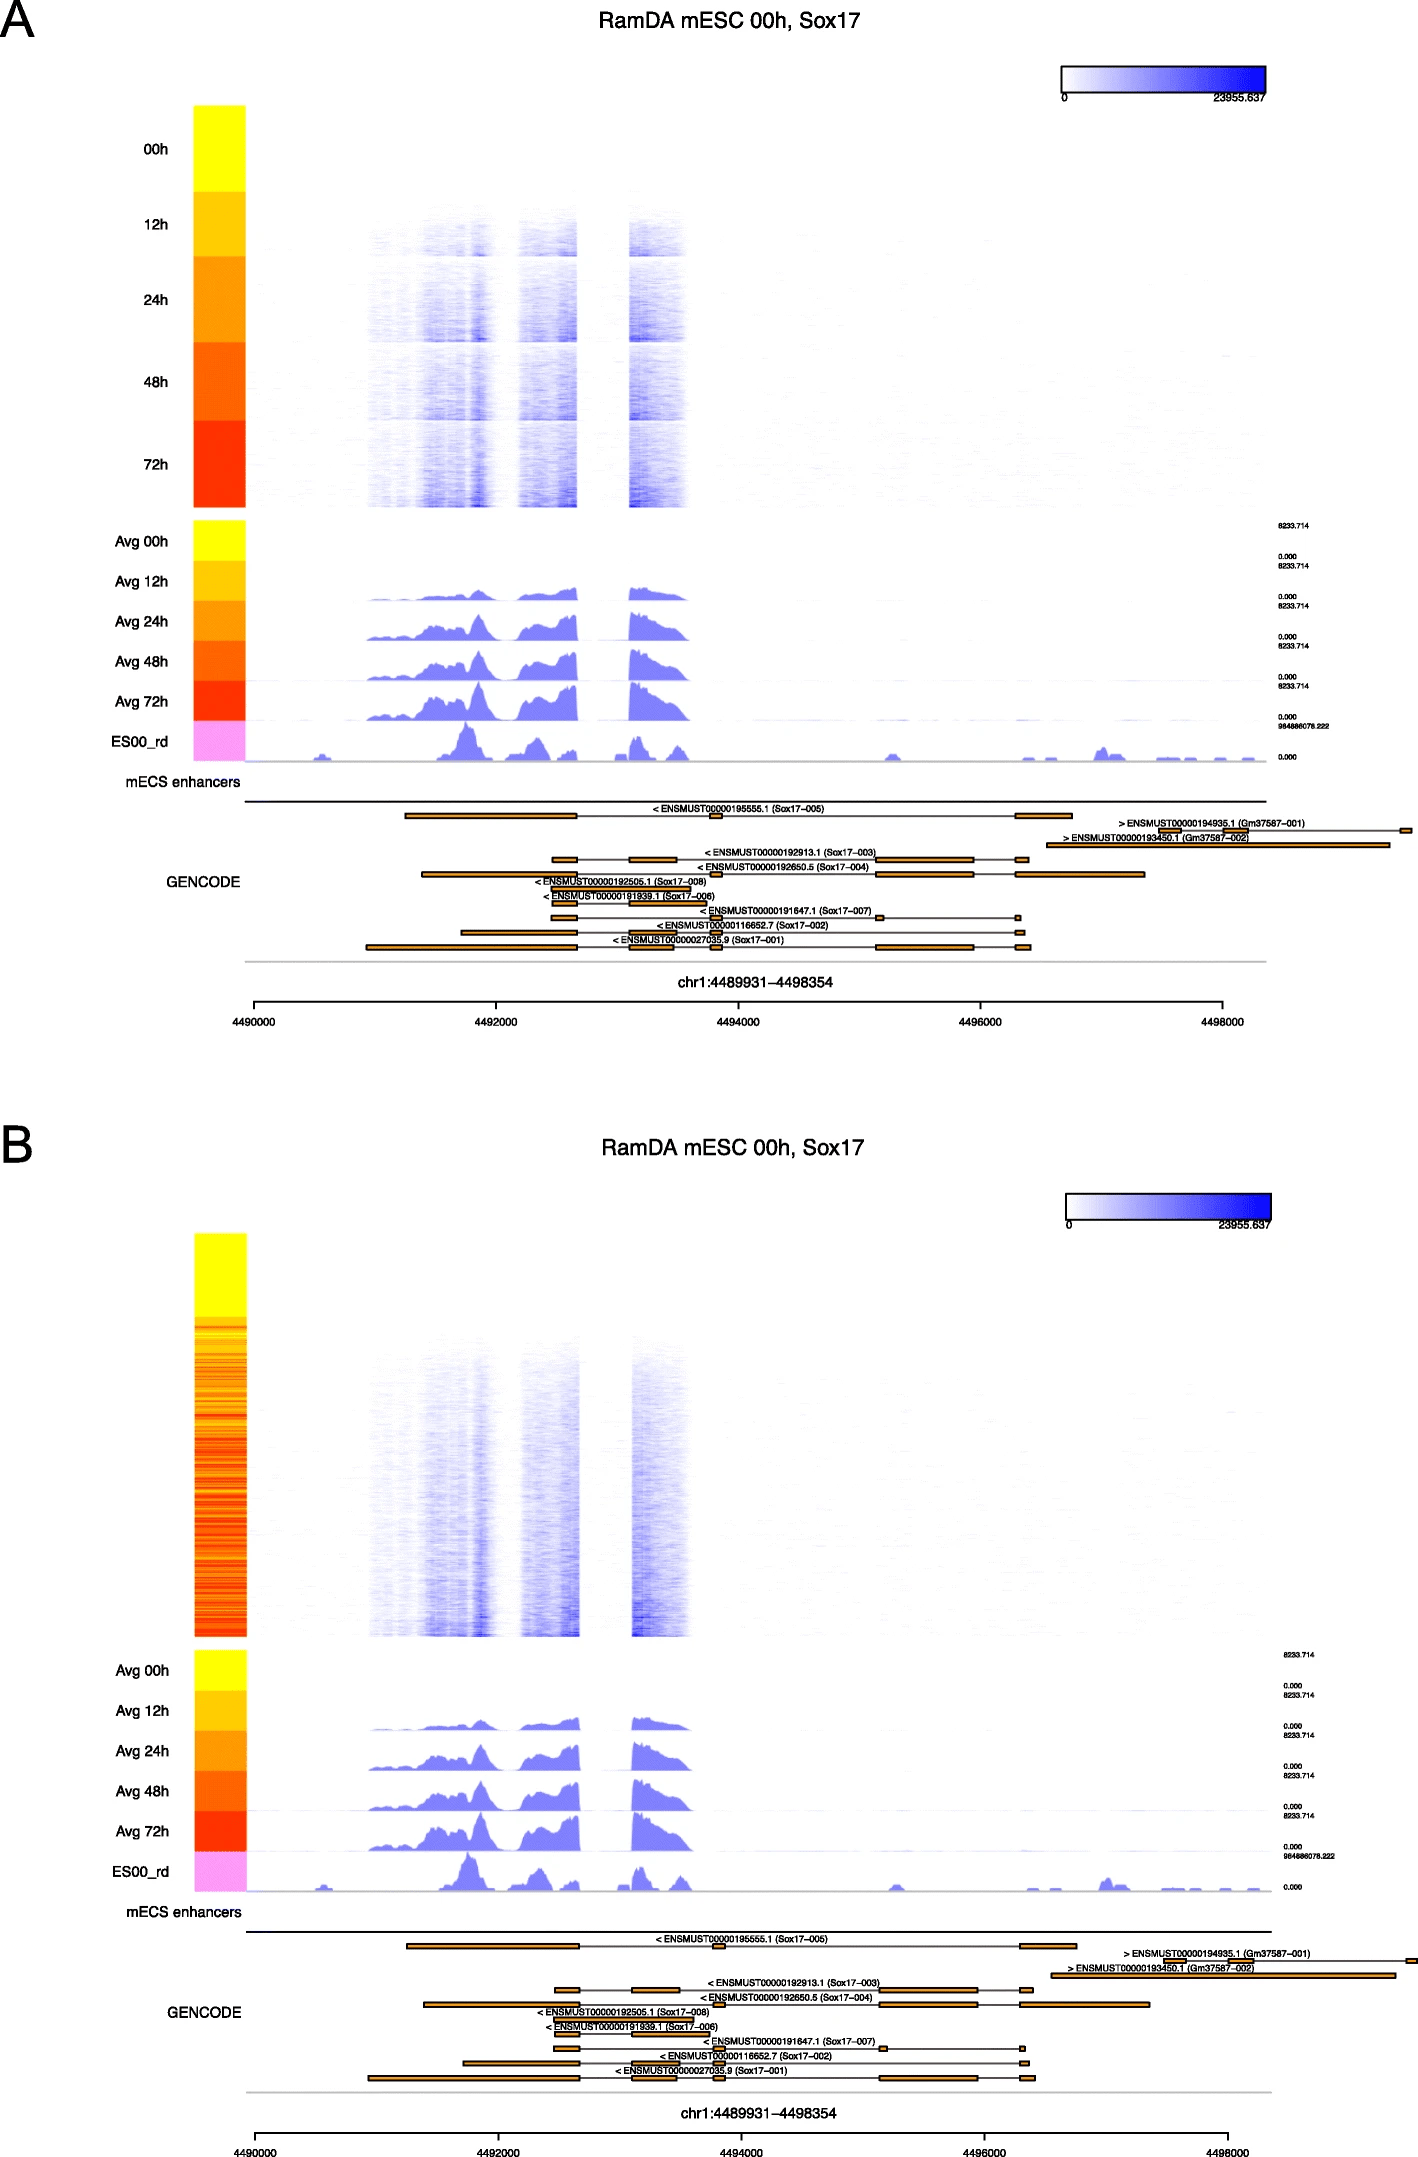
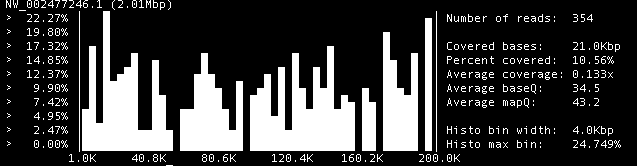
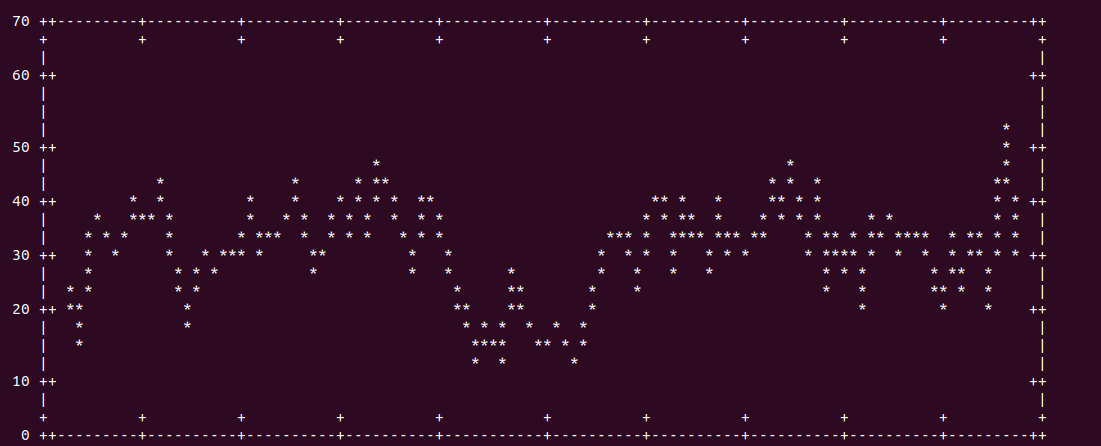
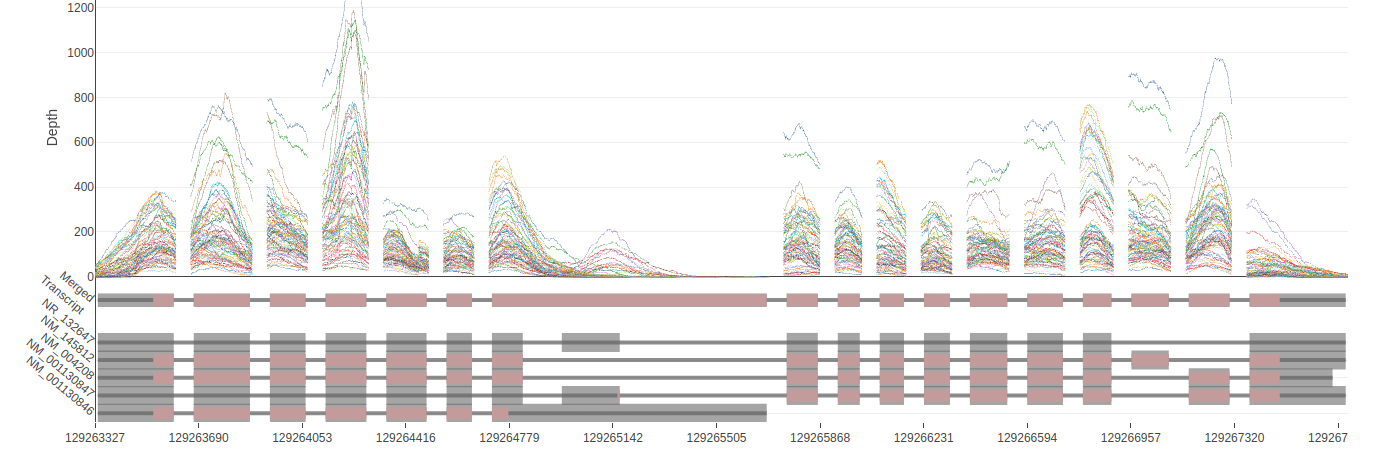
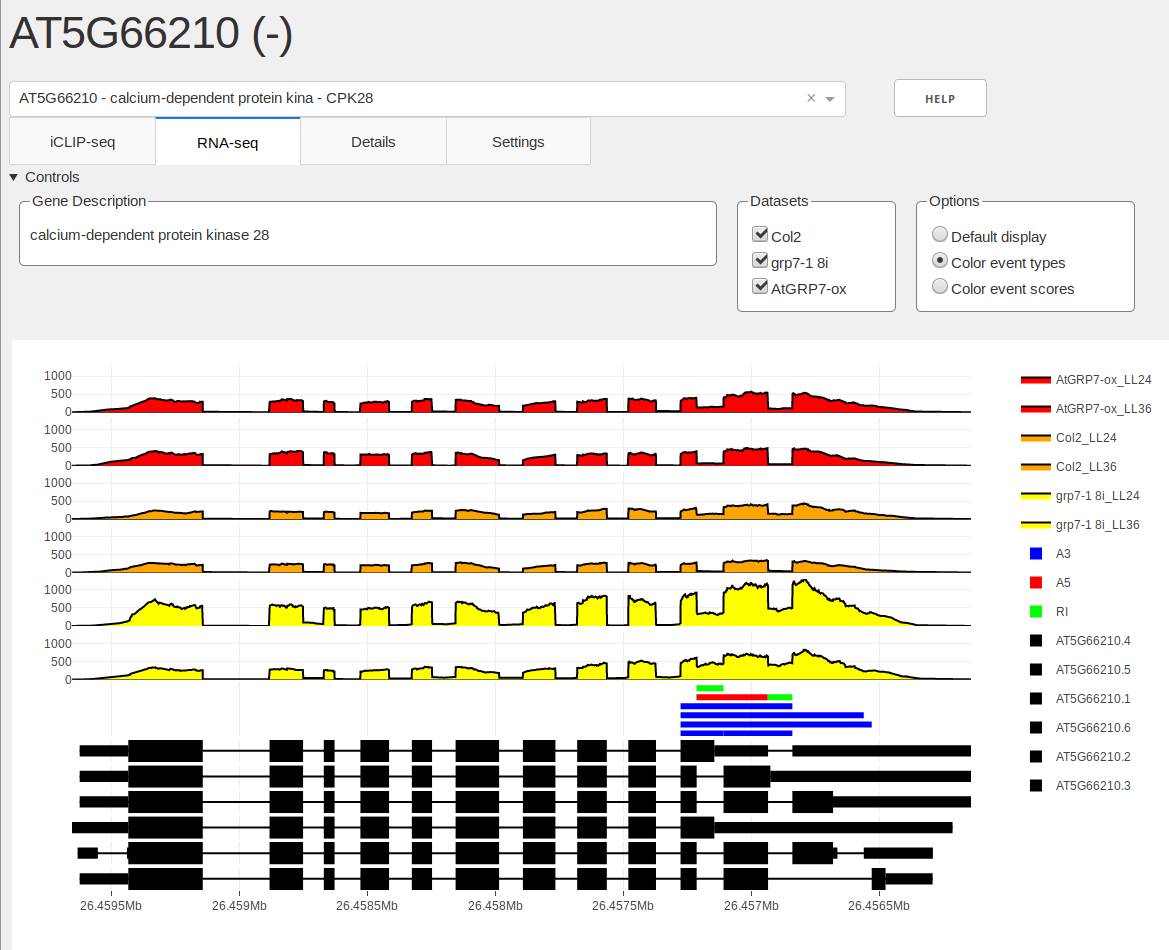
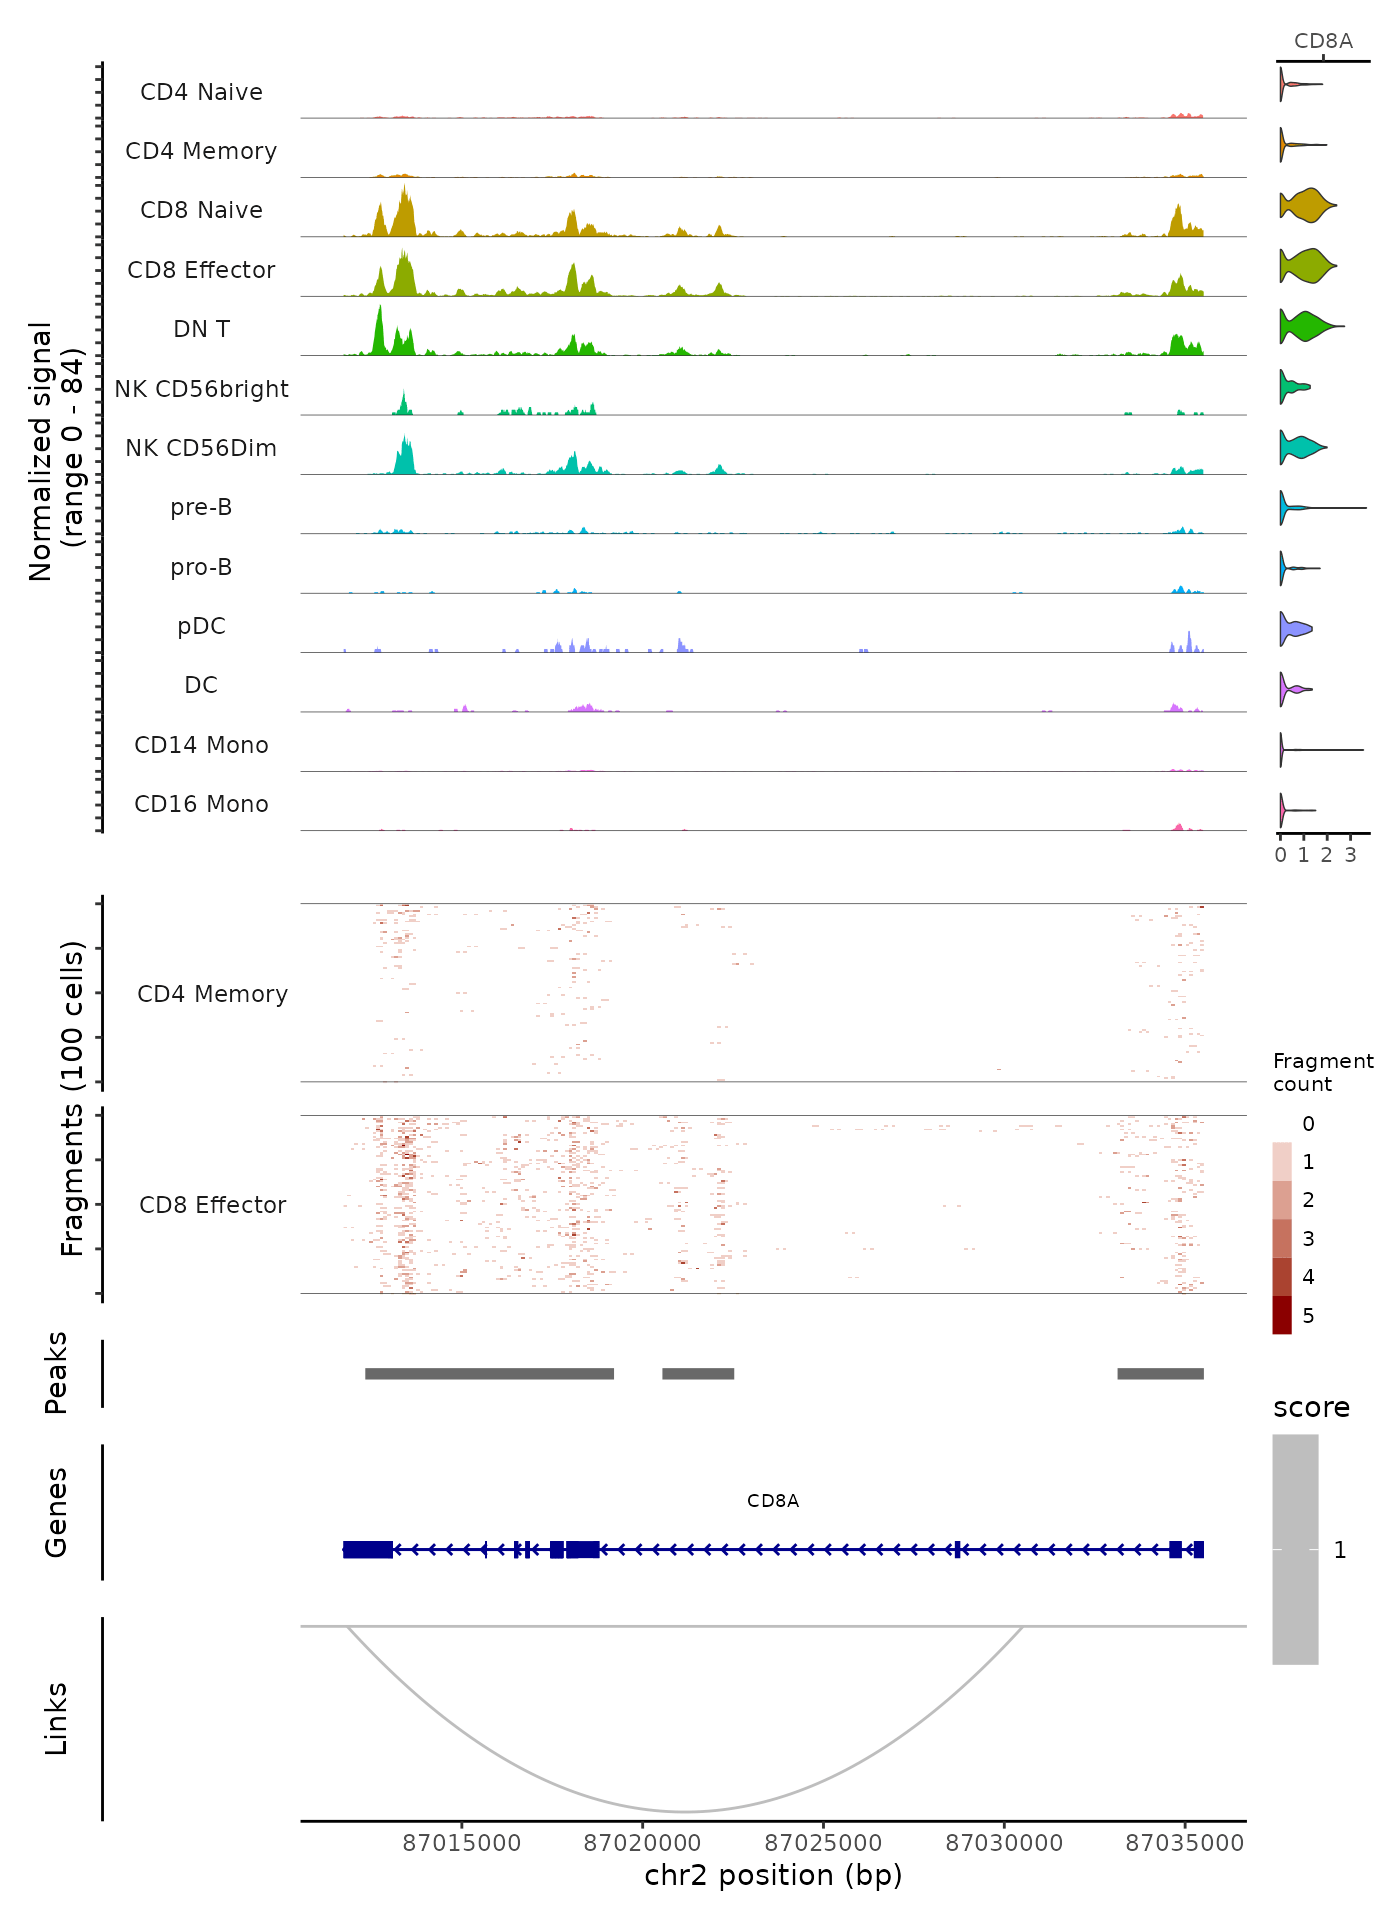
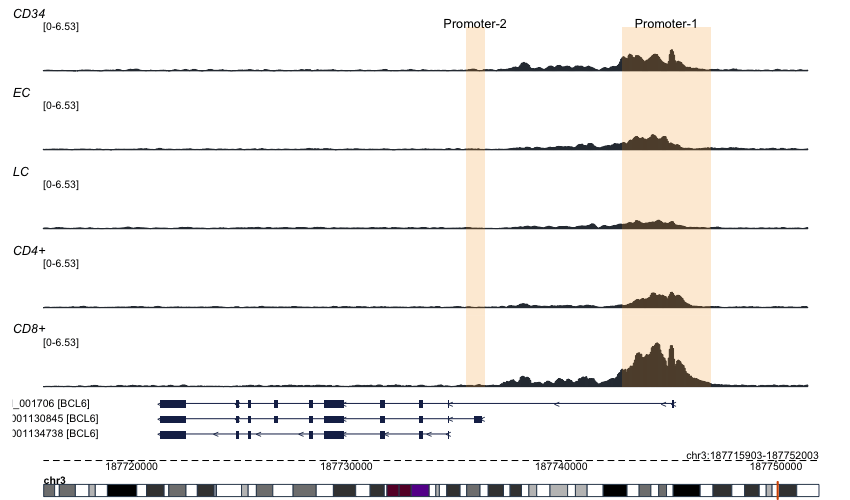
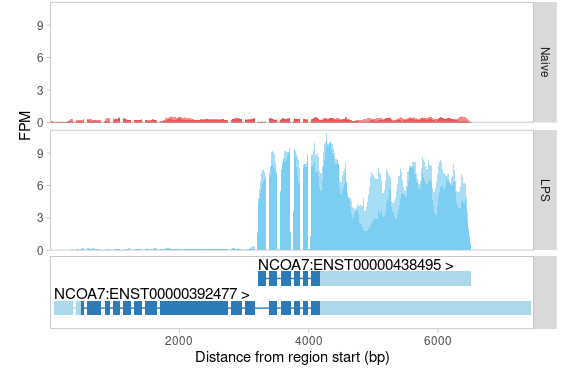
- asynt (img)
- cgplot (img)
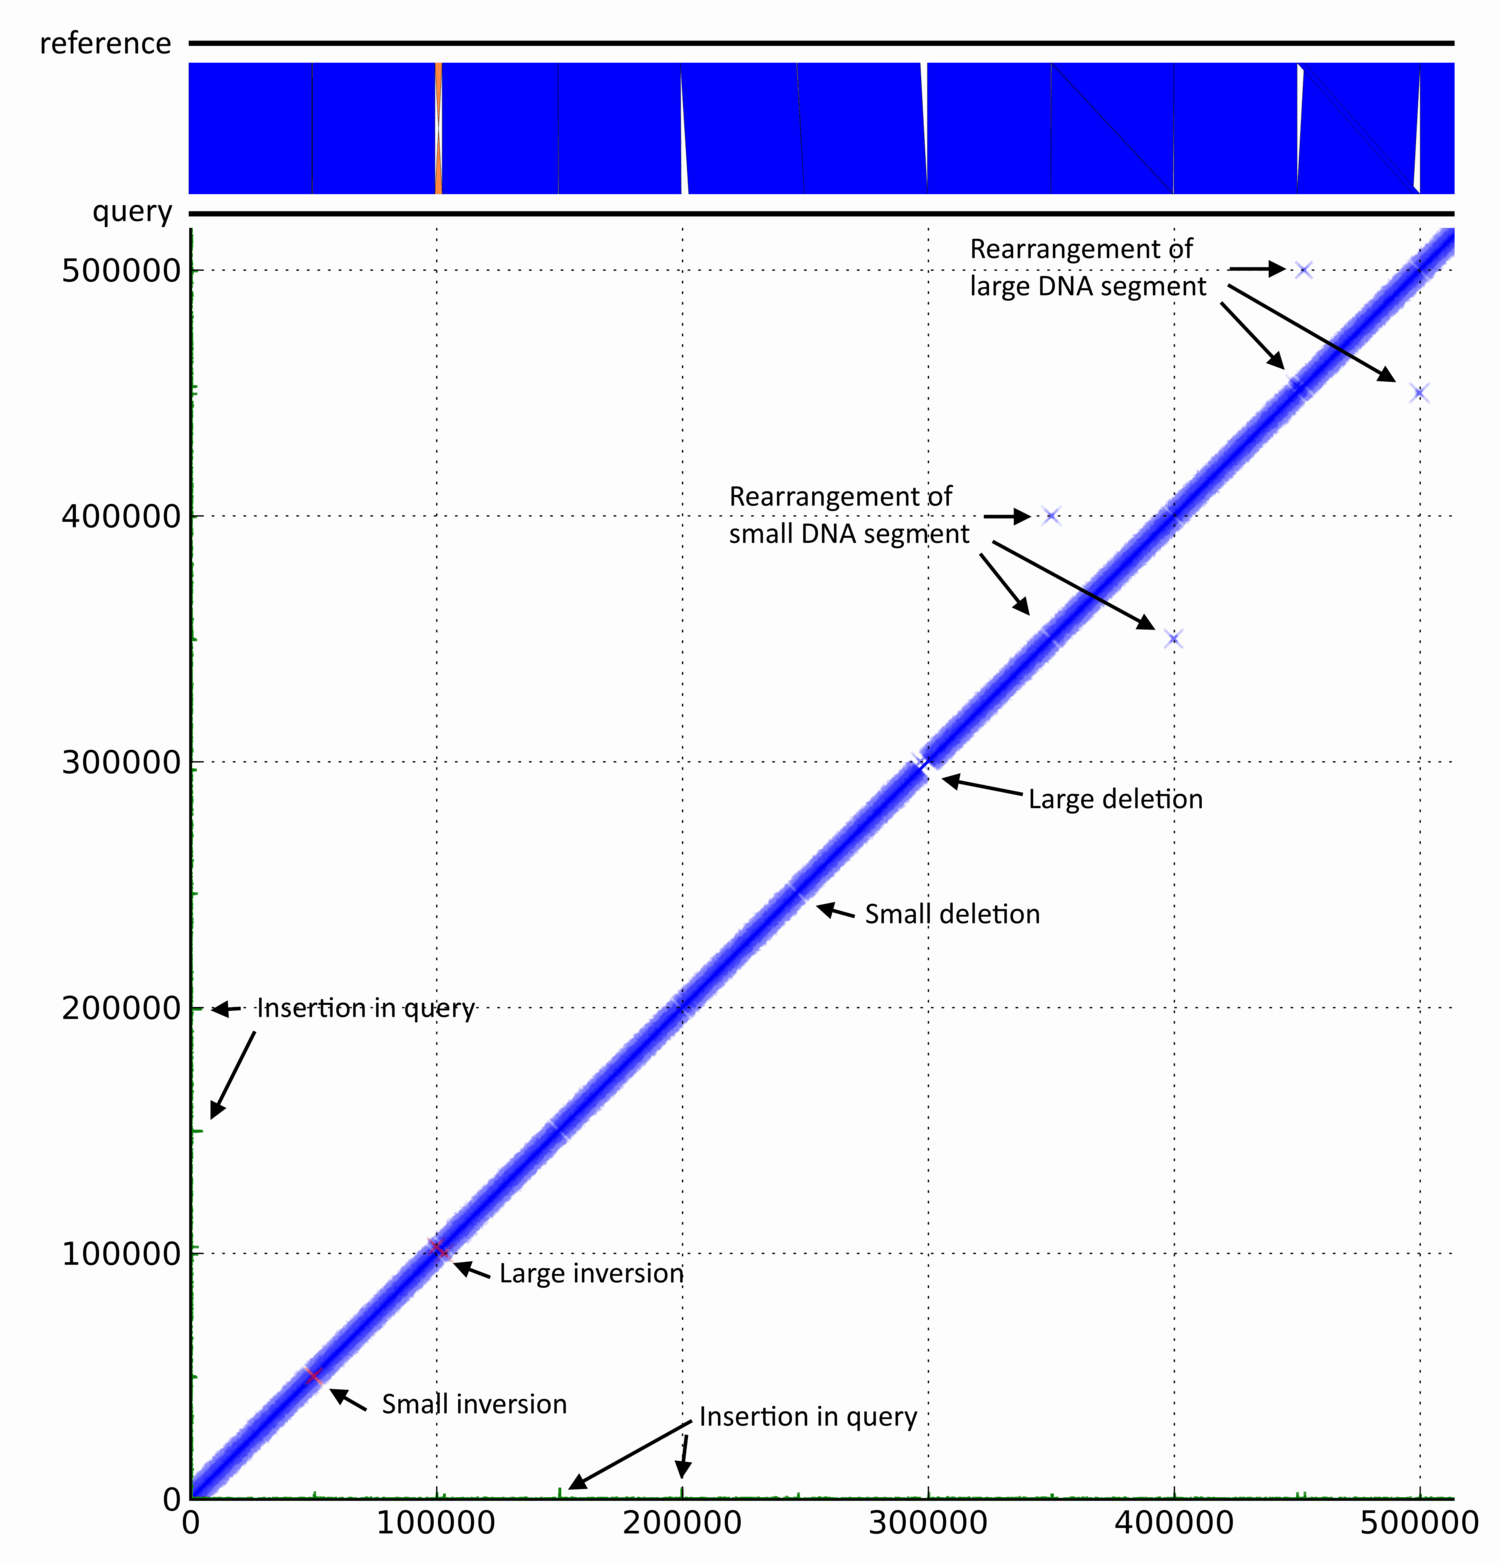
- CHROMEISTER (img)
- CoGe (img)
- D-GENIES (img)
- DAGchainer (img)
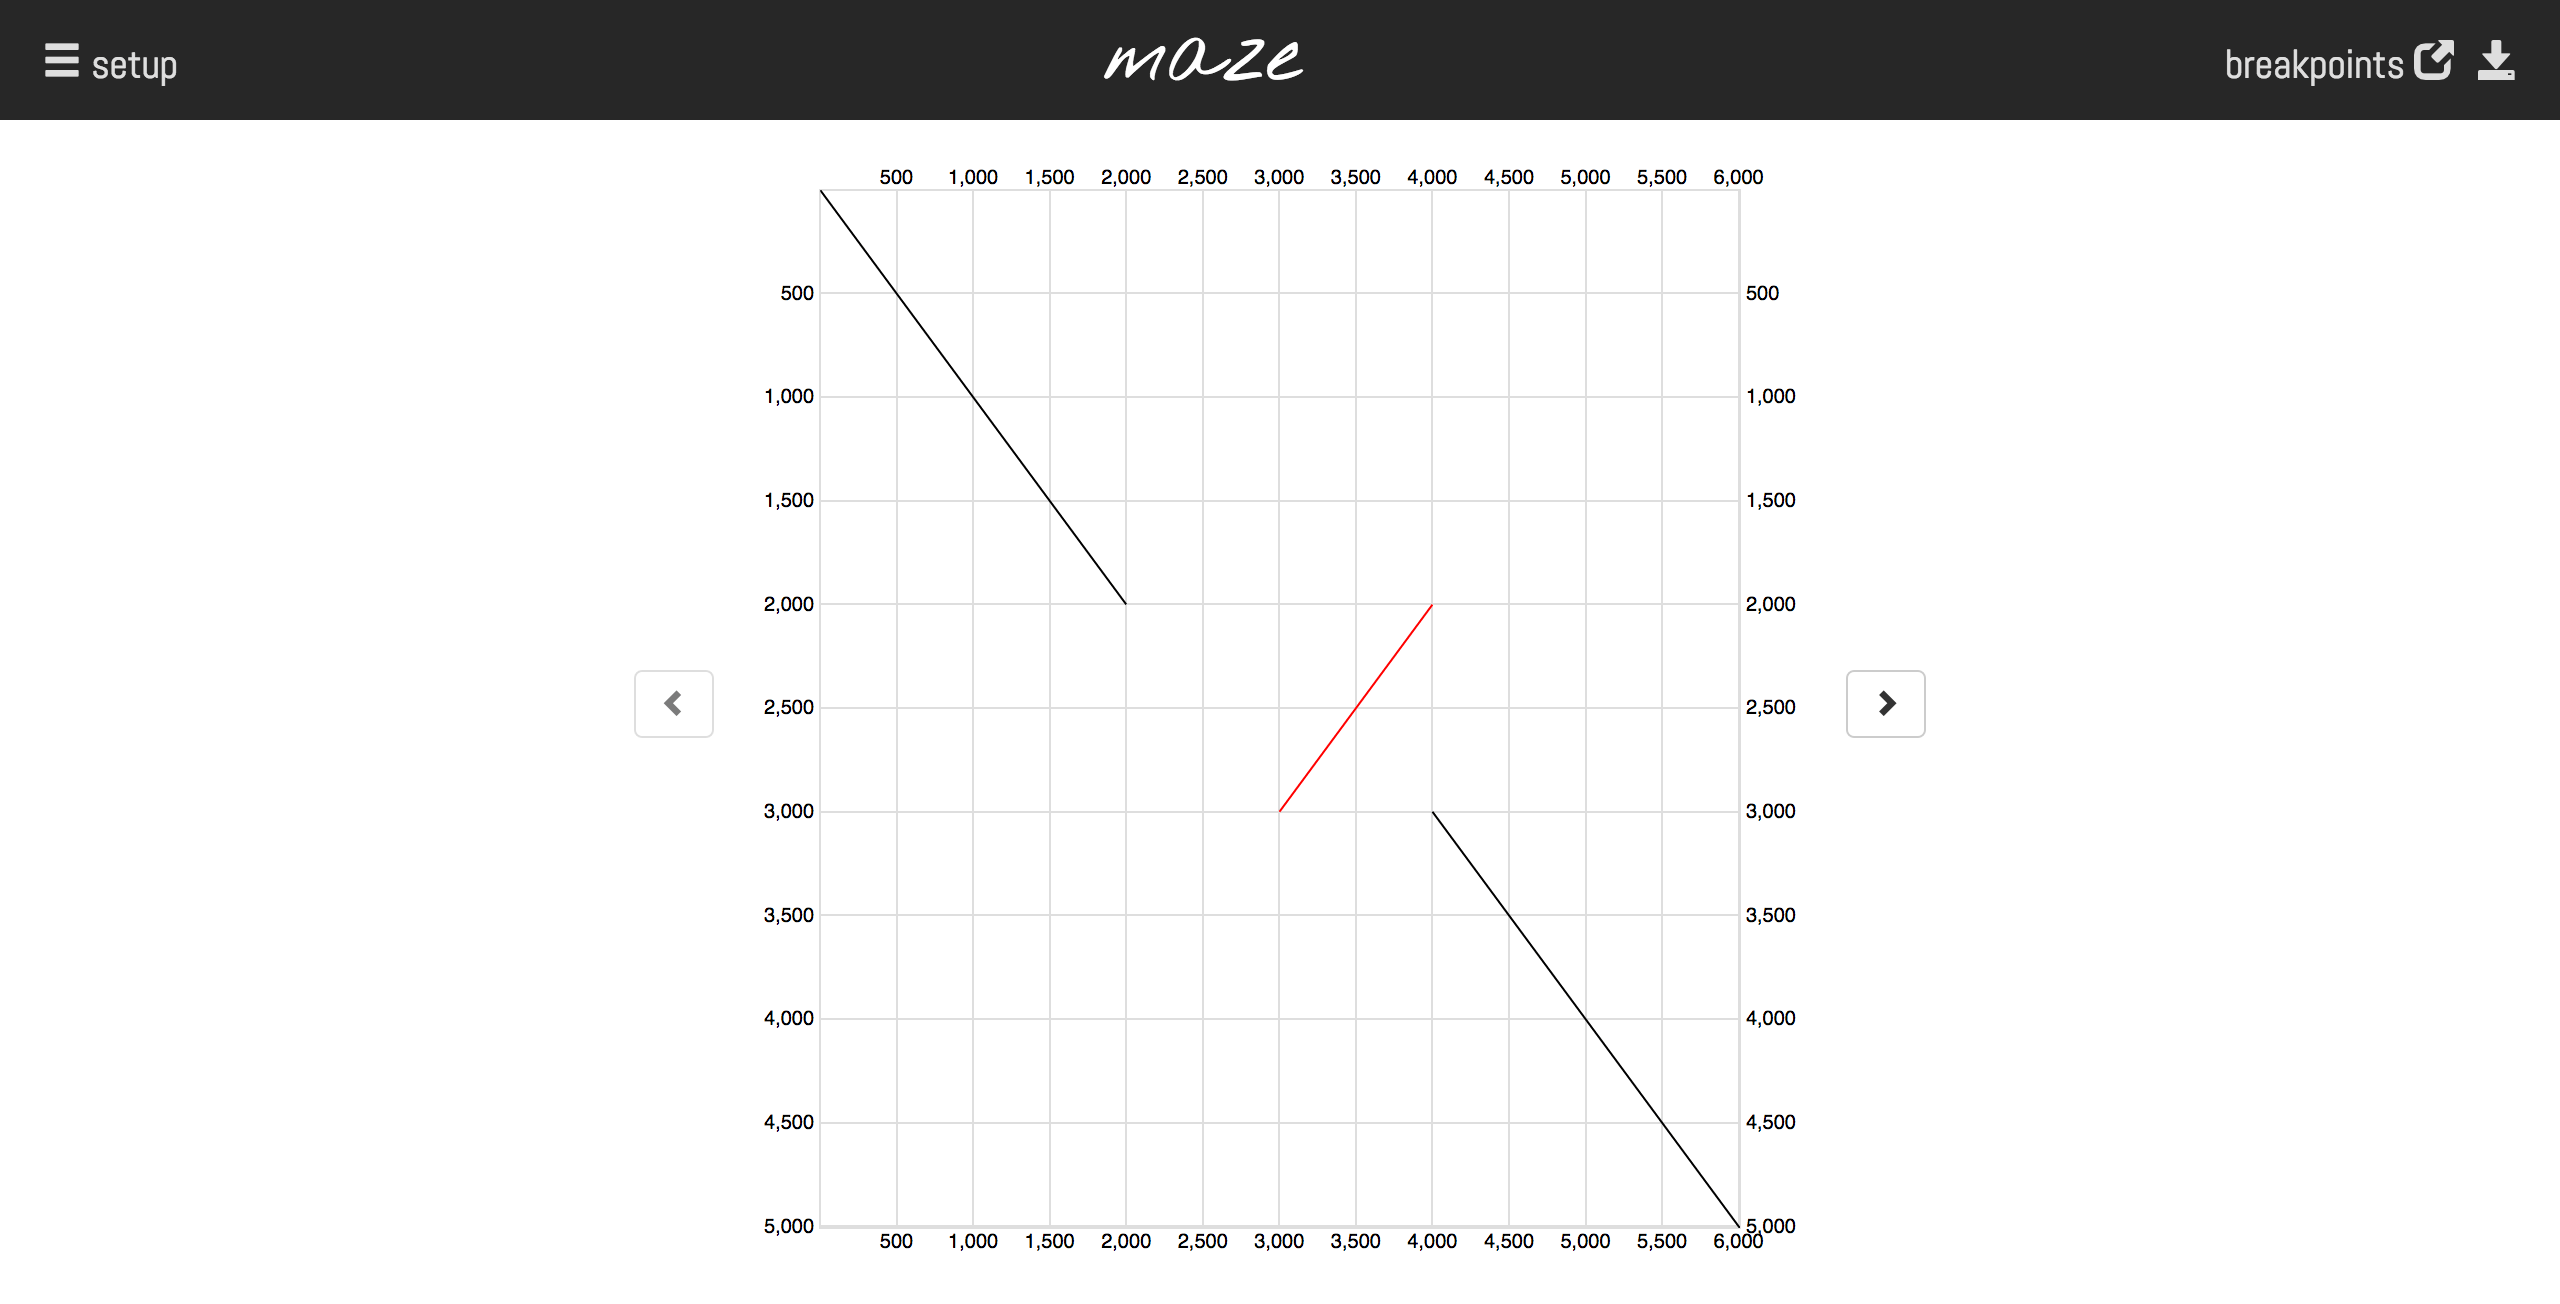
- Delly-maze (see also https://www.gear-genomics.com/maze/) (img)
- Discoplot (img)
- DNAVis (img)
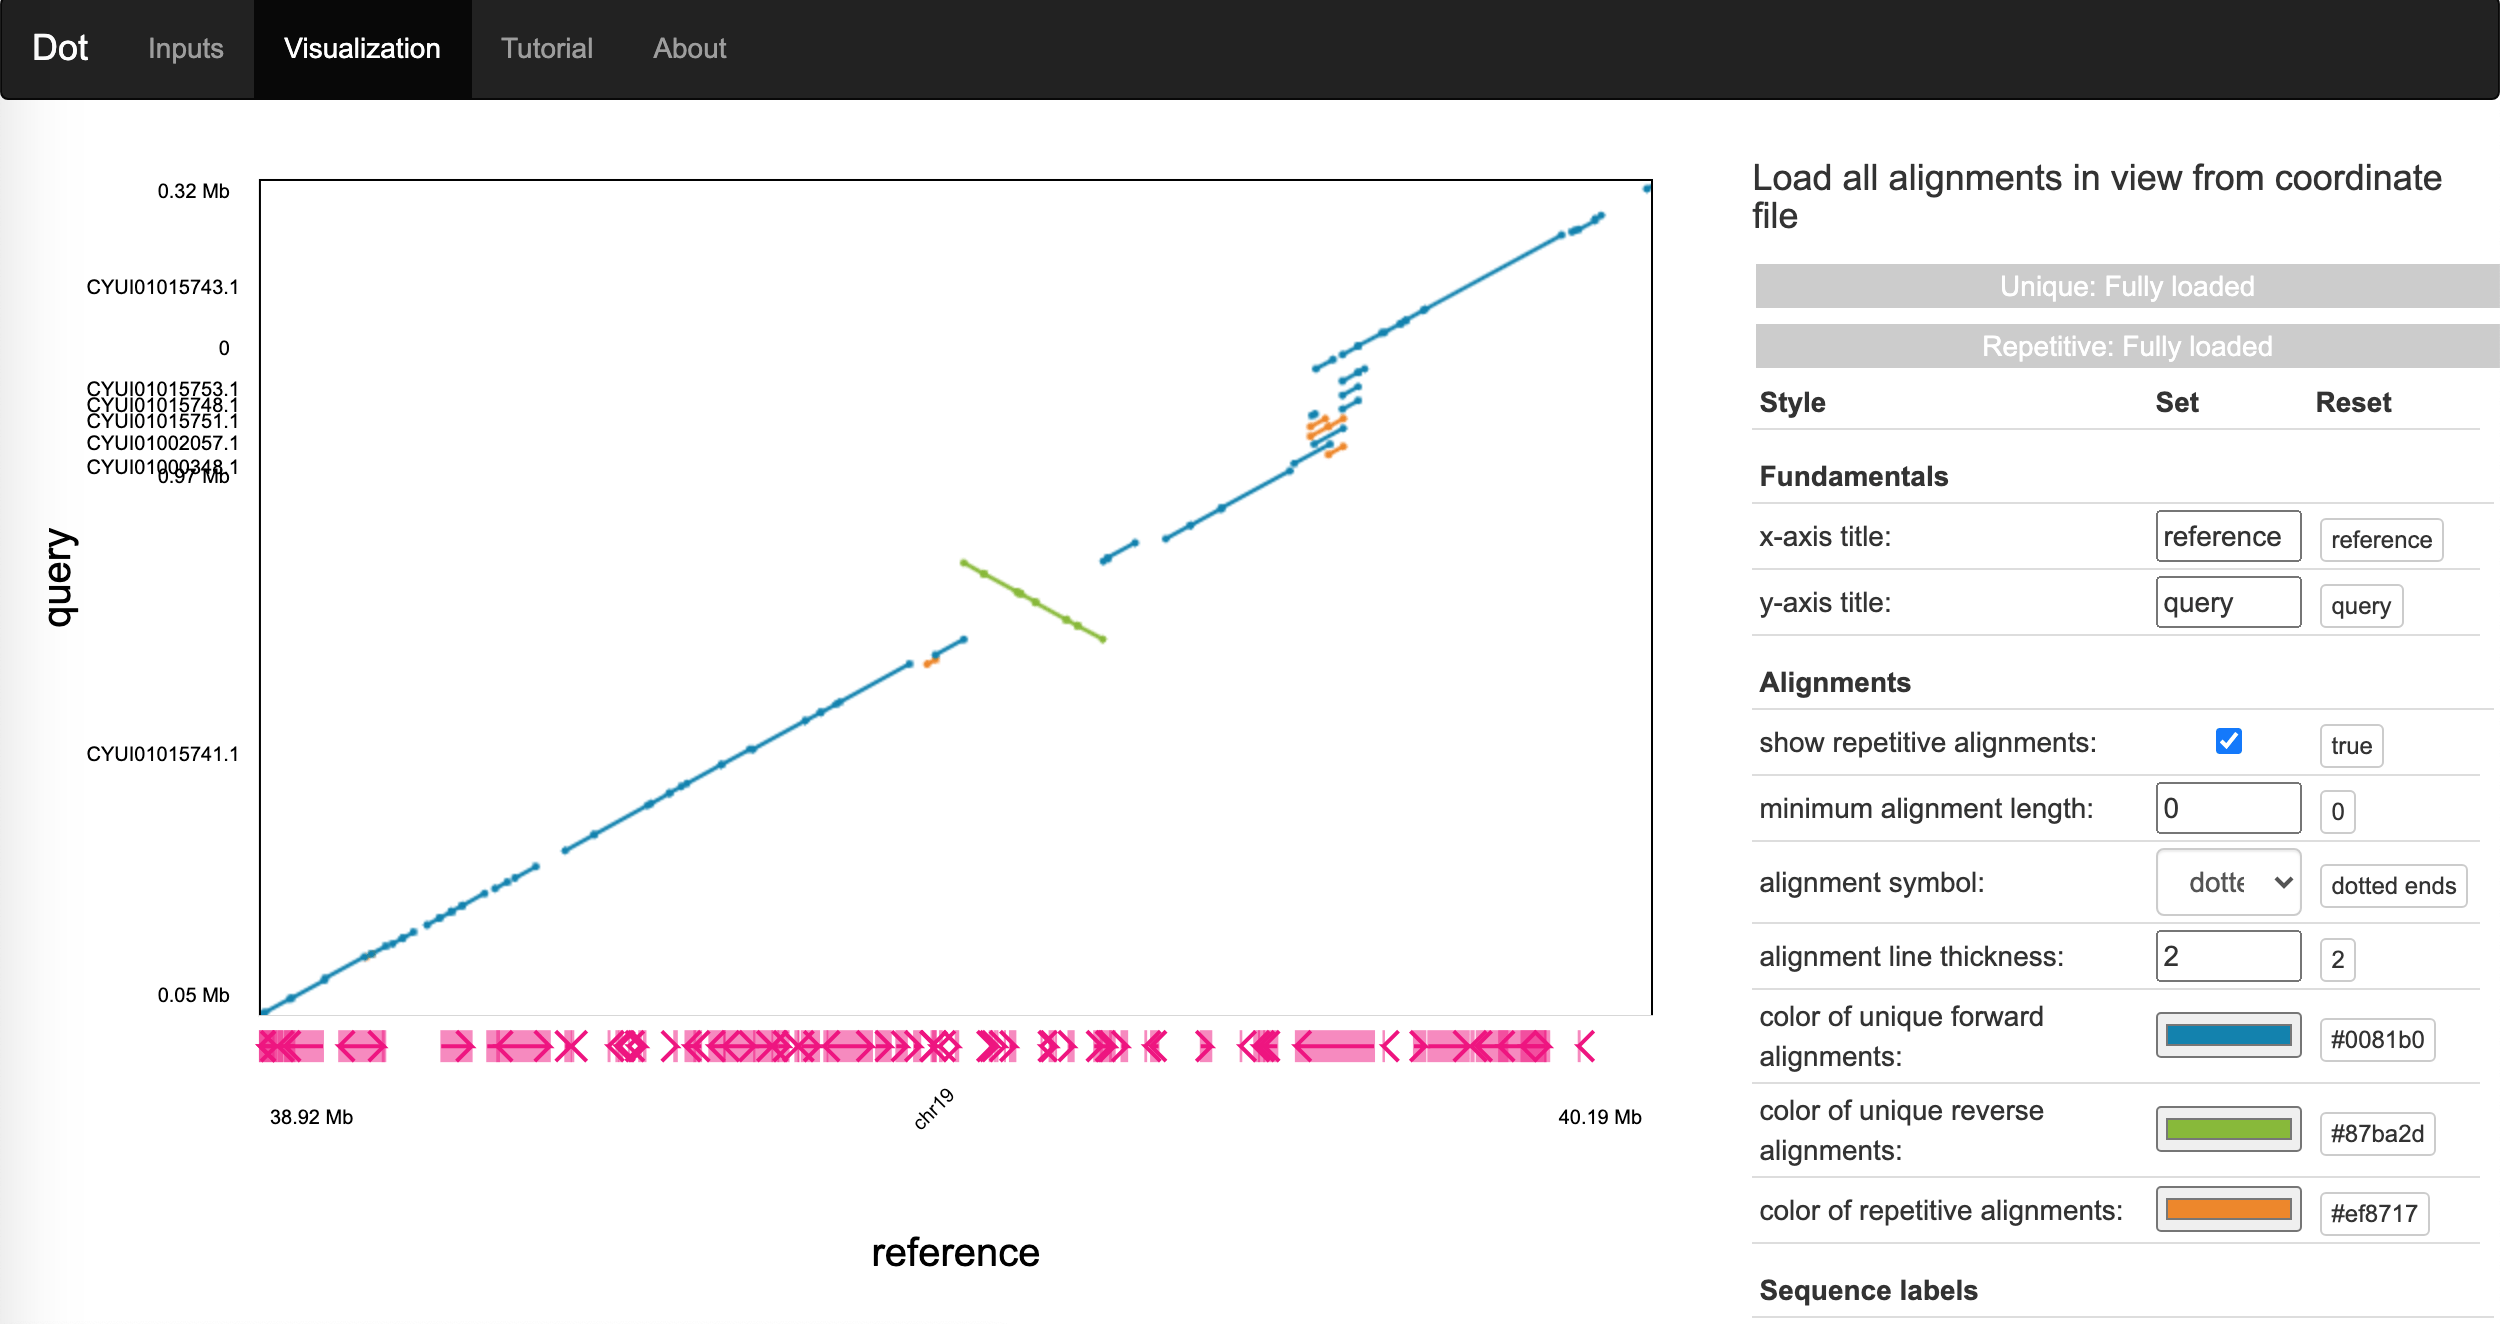
- Dot (Python data preparation script) (img)
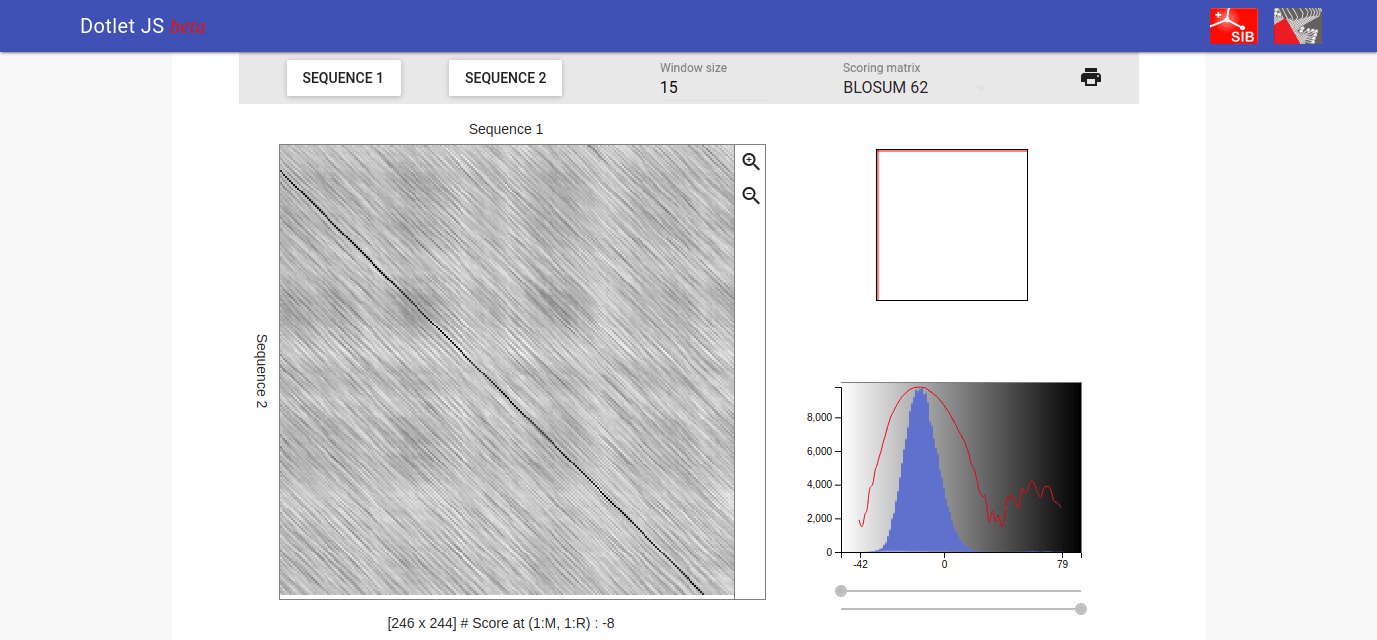
- Dotlet (The original publication was 2000 but updated ~2020 with reactjs) (img)
- Dotplot (chirimoyo)
- dotPlotly (img)
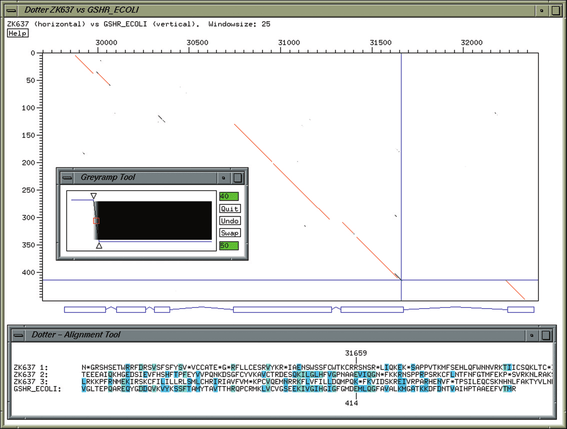
- Dotter (img)
- Dottup (also seen here http://eichlerlab.gs.washington.edu/pubs/chm1-structural-variation/data/GRCh37/heterochromatic_extensions.pdf) (img)
- FlexiDot (img)
- GenomicBreaks (img)
- Gepard (img)
- ggplot2 mummerplot (img)
- iLambda Dotplot
- Jdot (img)
- JGI IMG (Dotplot use MUMmer) (img)
- last-dotplot (img)
- local-rearrangements (Can color dotplots with annotations for e.g. exons, transposons, low complexity regions. See also last-dotplot. Nice figure using it here https://genomemedicine.biomedcentral.com/articles/10.1186/s13073-020-00762-1/figures/4) (img)
- MashMap (img)
- MCScan (python version) (Also has 2024 citation here https://onlinelibrary.wiley.com/doi/10.1002/imt2.211) (img)
- mcutils (https://twitter.com/mjpchaisson/status/1040363992206569472) (img)
- Minidot (img)
- ModDotPlot (img)
- Mummer-idotplot
- Mummerplot (img)
- odp (oxford dot plots) (Pub is not for visualization tool, but it is suggested to cite this paper) (img)
- oxford-plots (Has nice description of a synteny pipeline here https://github.com/jherrero/oxford-plots/blob/master/examples/pig_X_Y.txt) (img)
- paf2dot (img)
- paf2dotplot (Based on dotPlotly) (img)
- pafr (img)
- r2cat (img)
- Redotable (img)
- shinyChromosome (img)
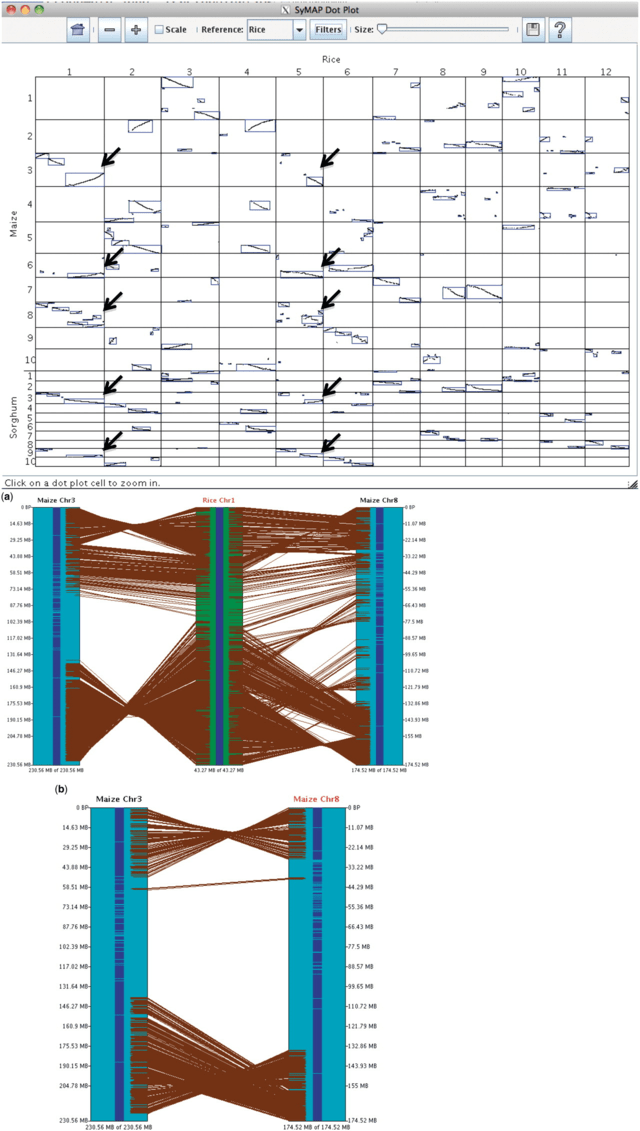
- SyMap (img)
- syntenyPlotByR (img)
- syntR (img)
- SynTView (img)
- SYNY (img)
- WGDI (img)
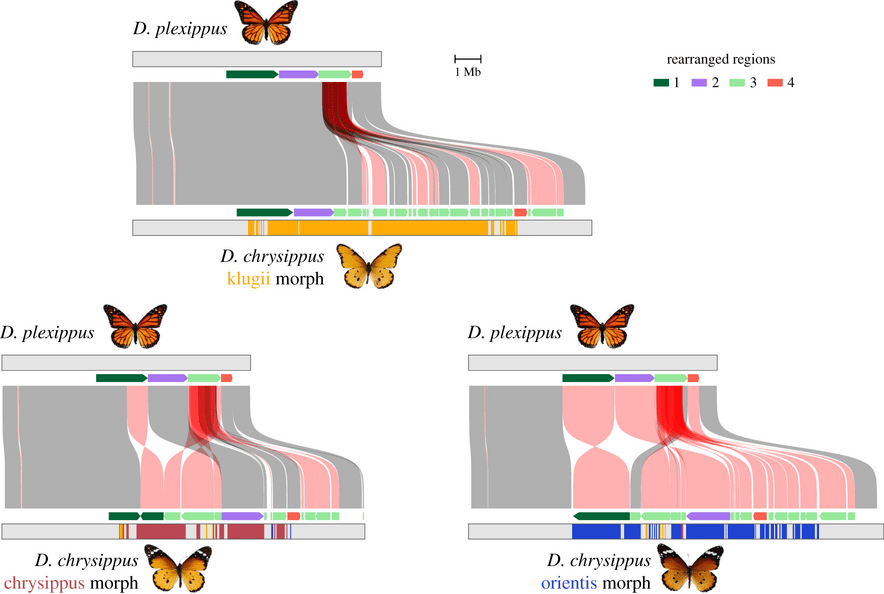
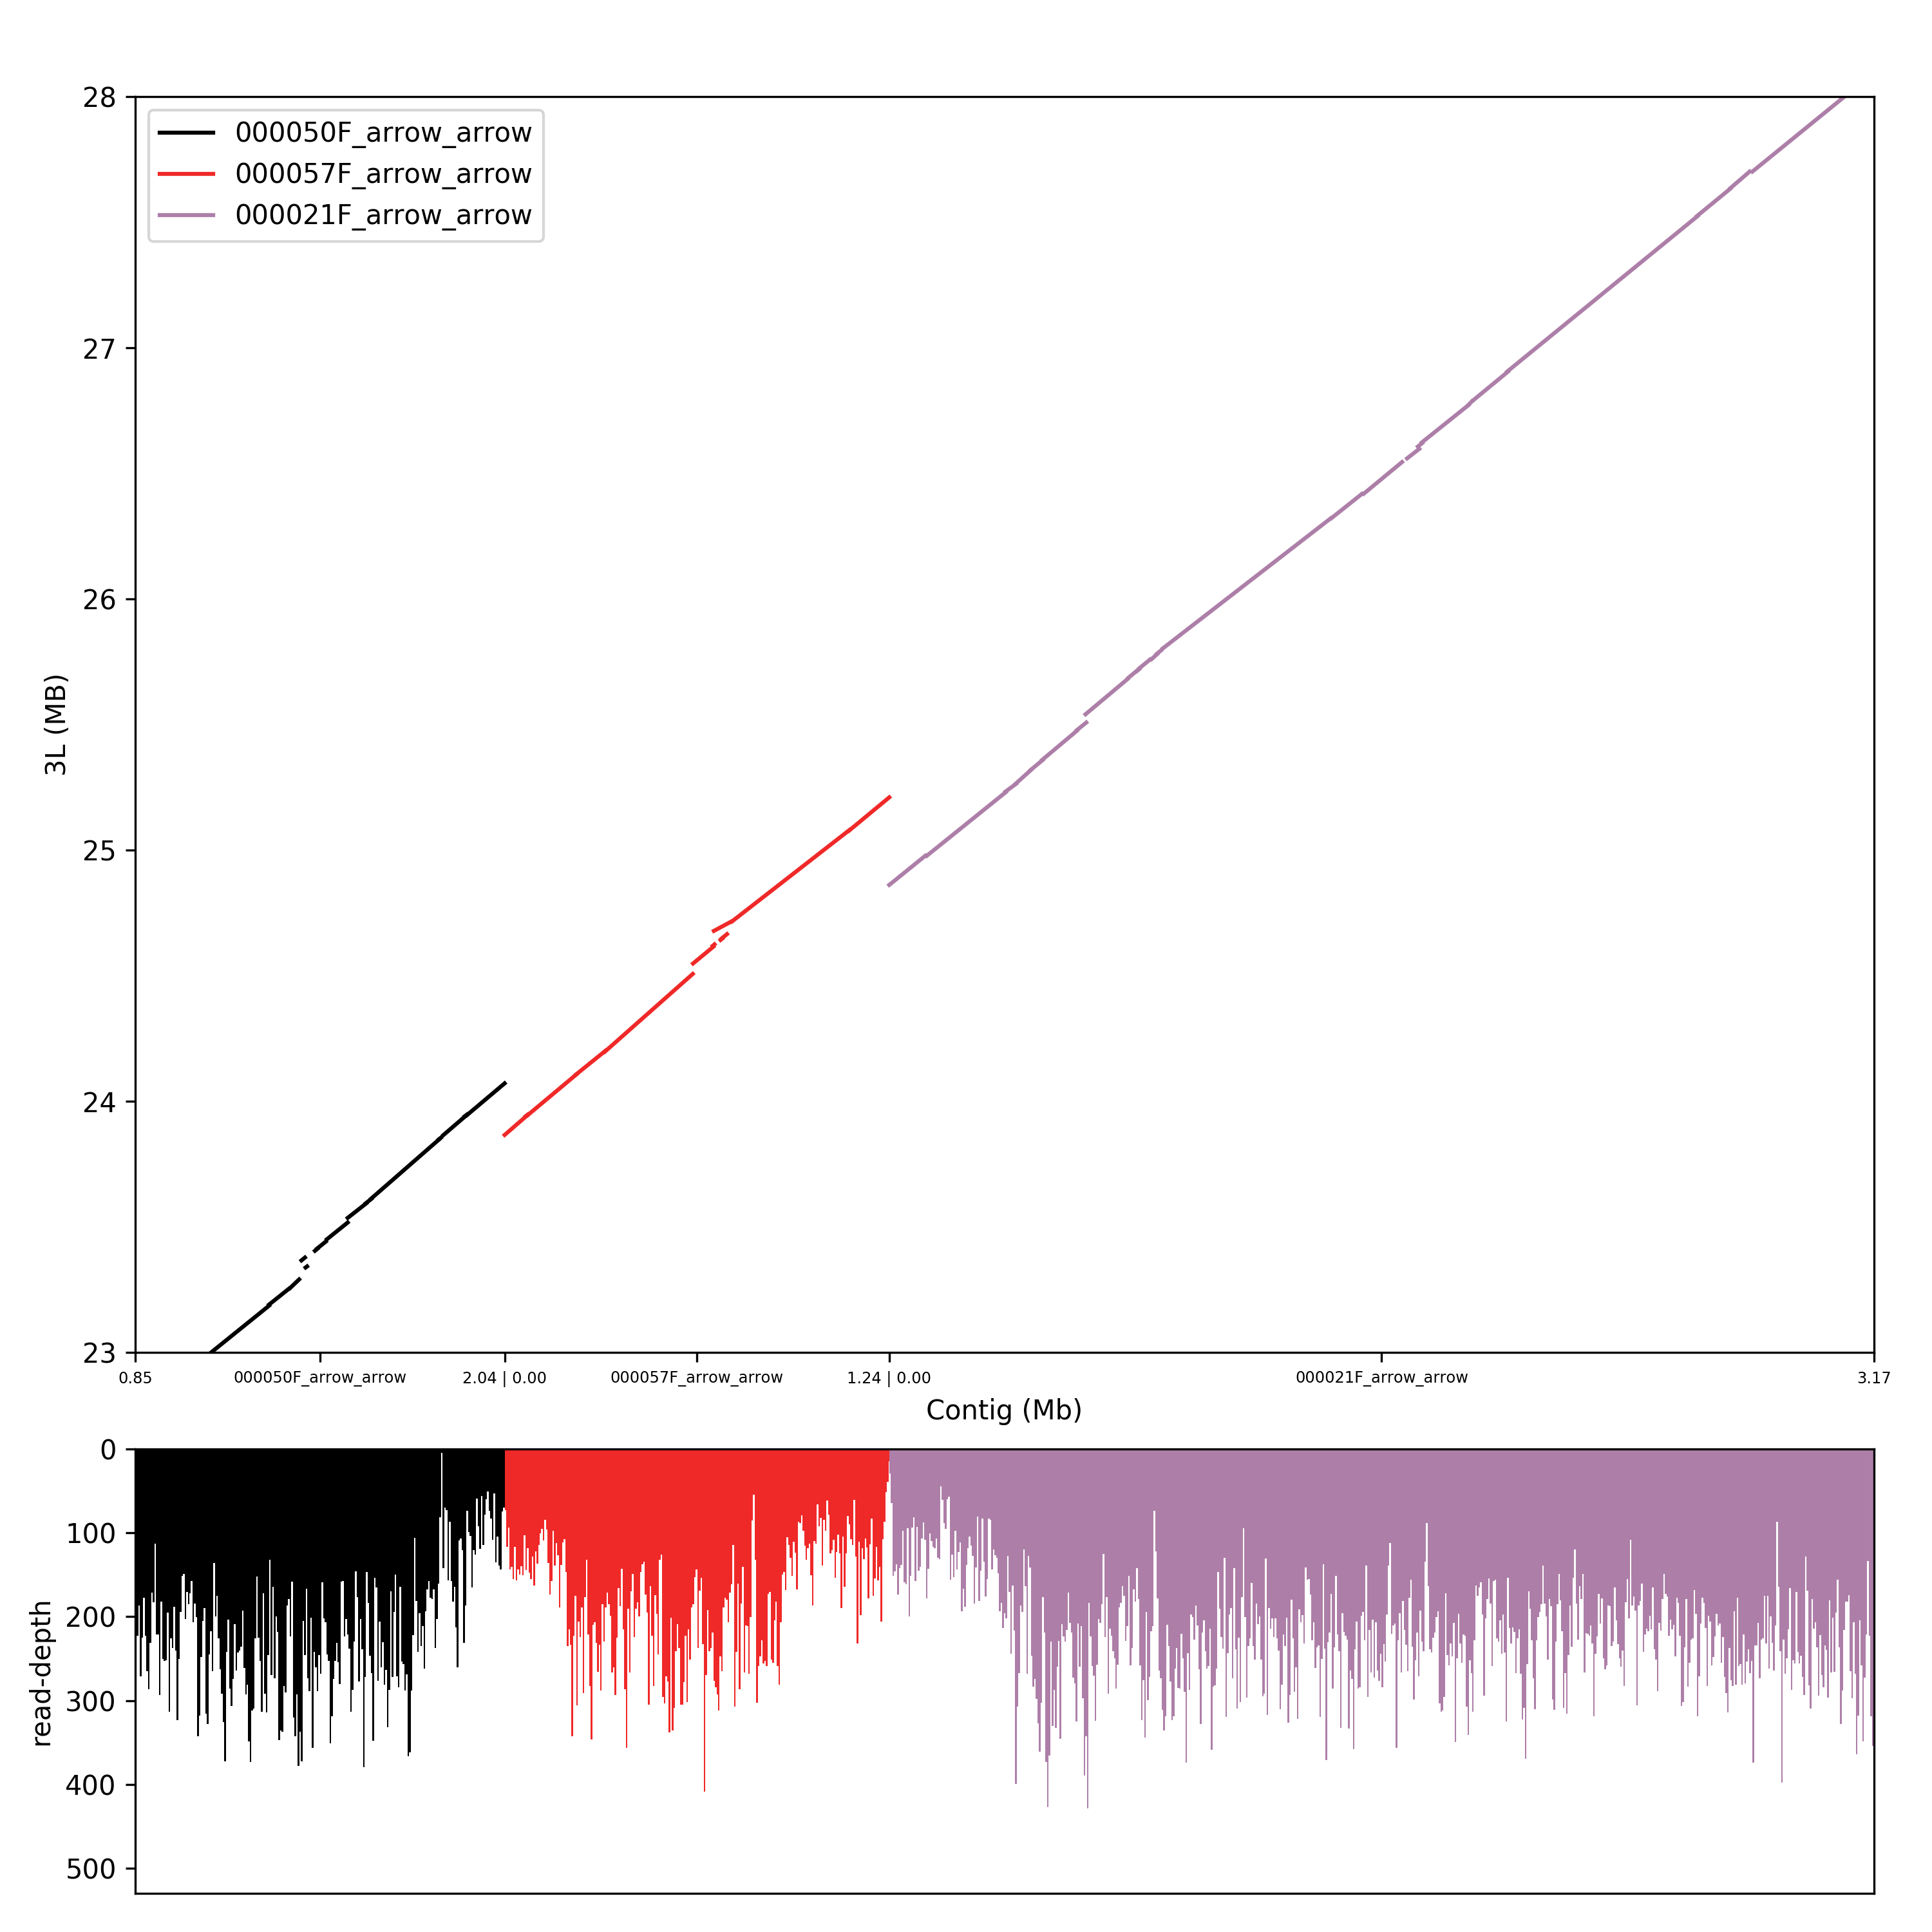
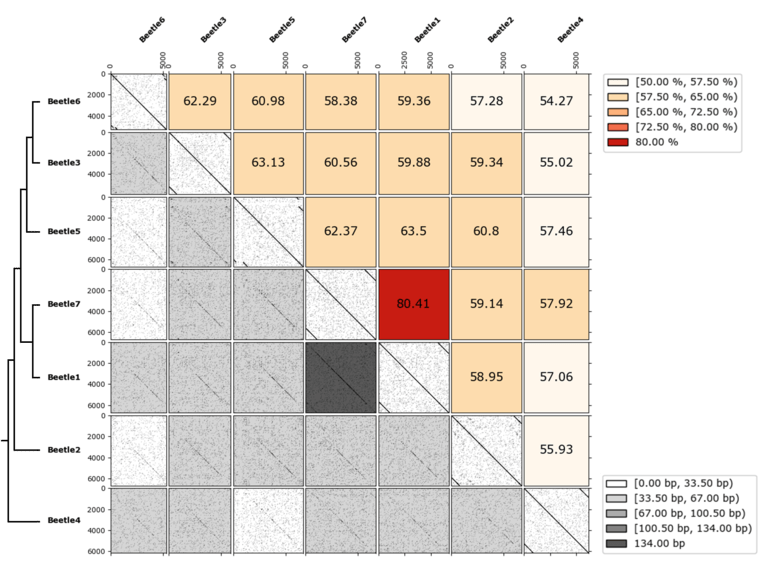
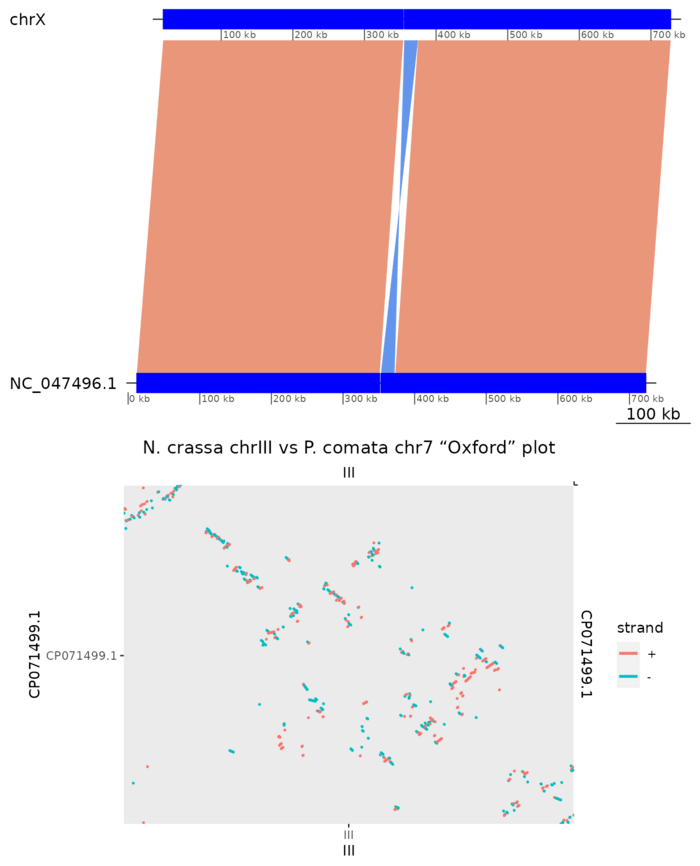
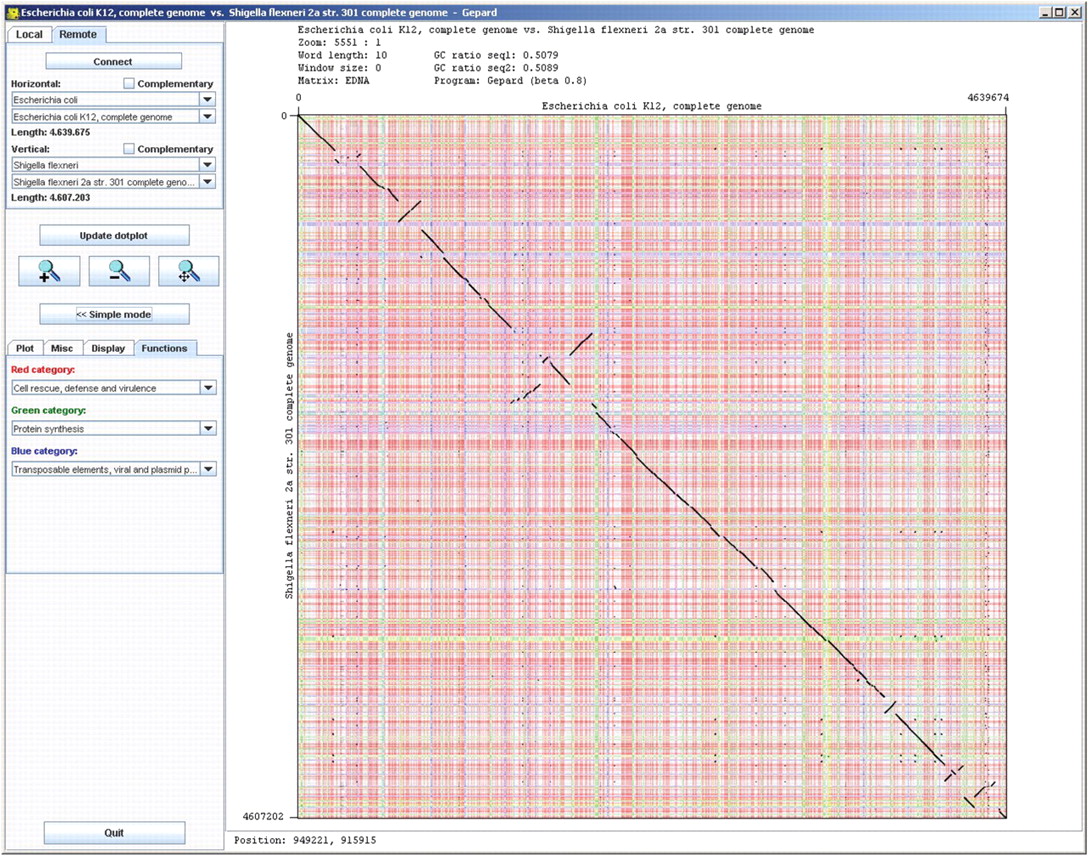
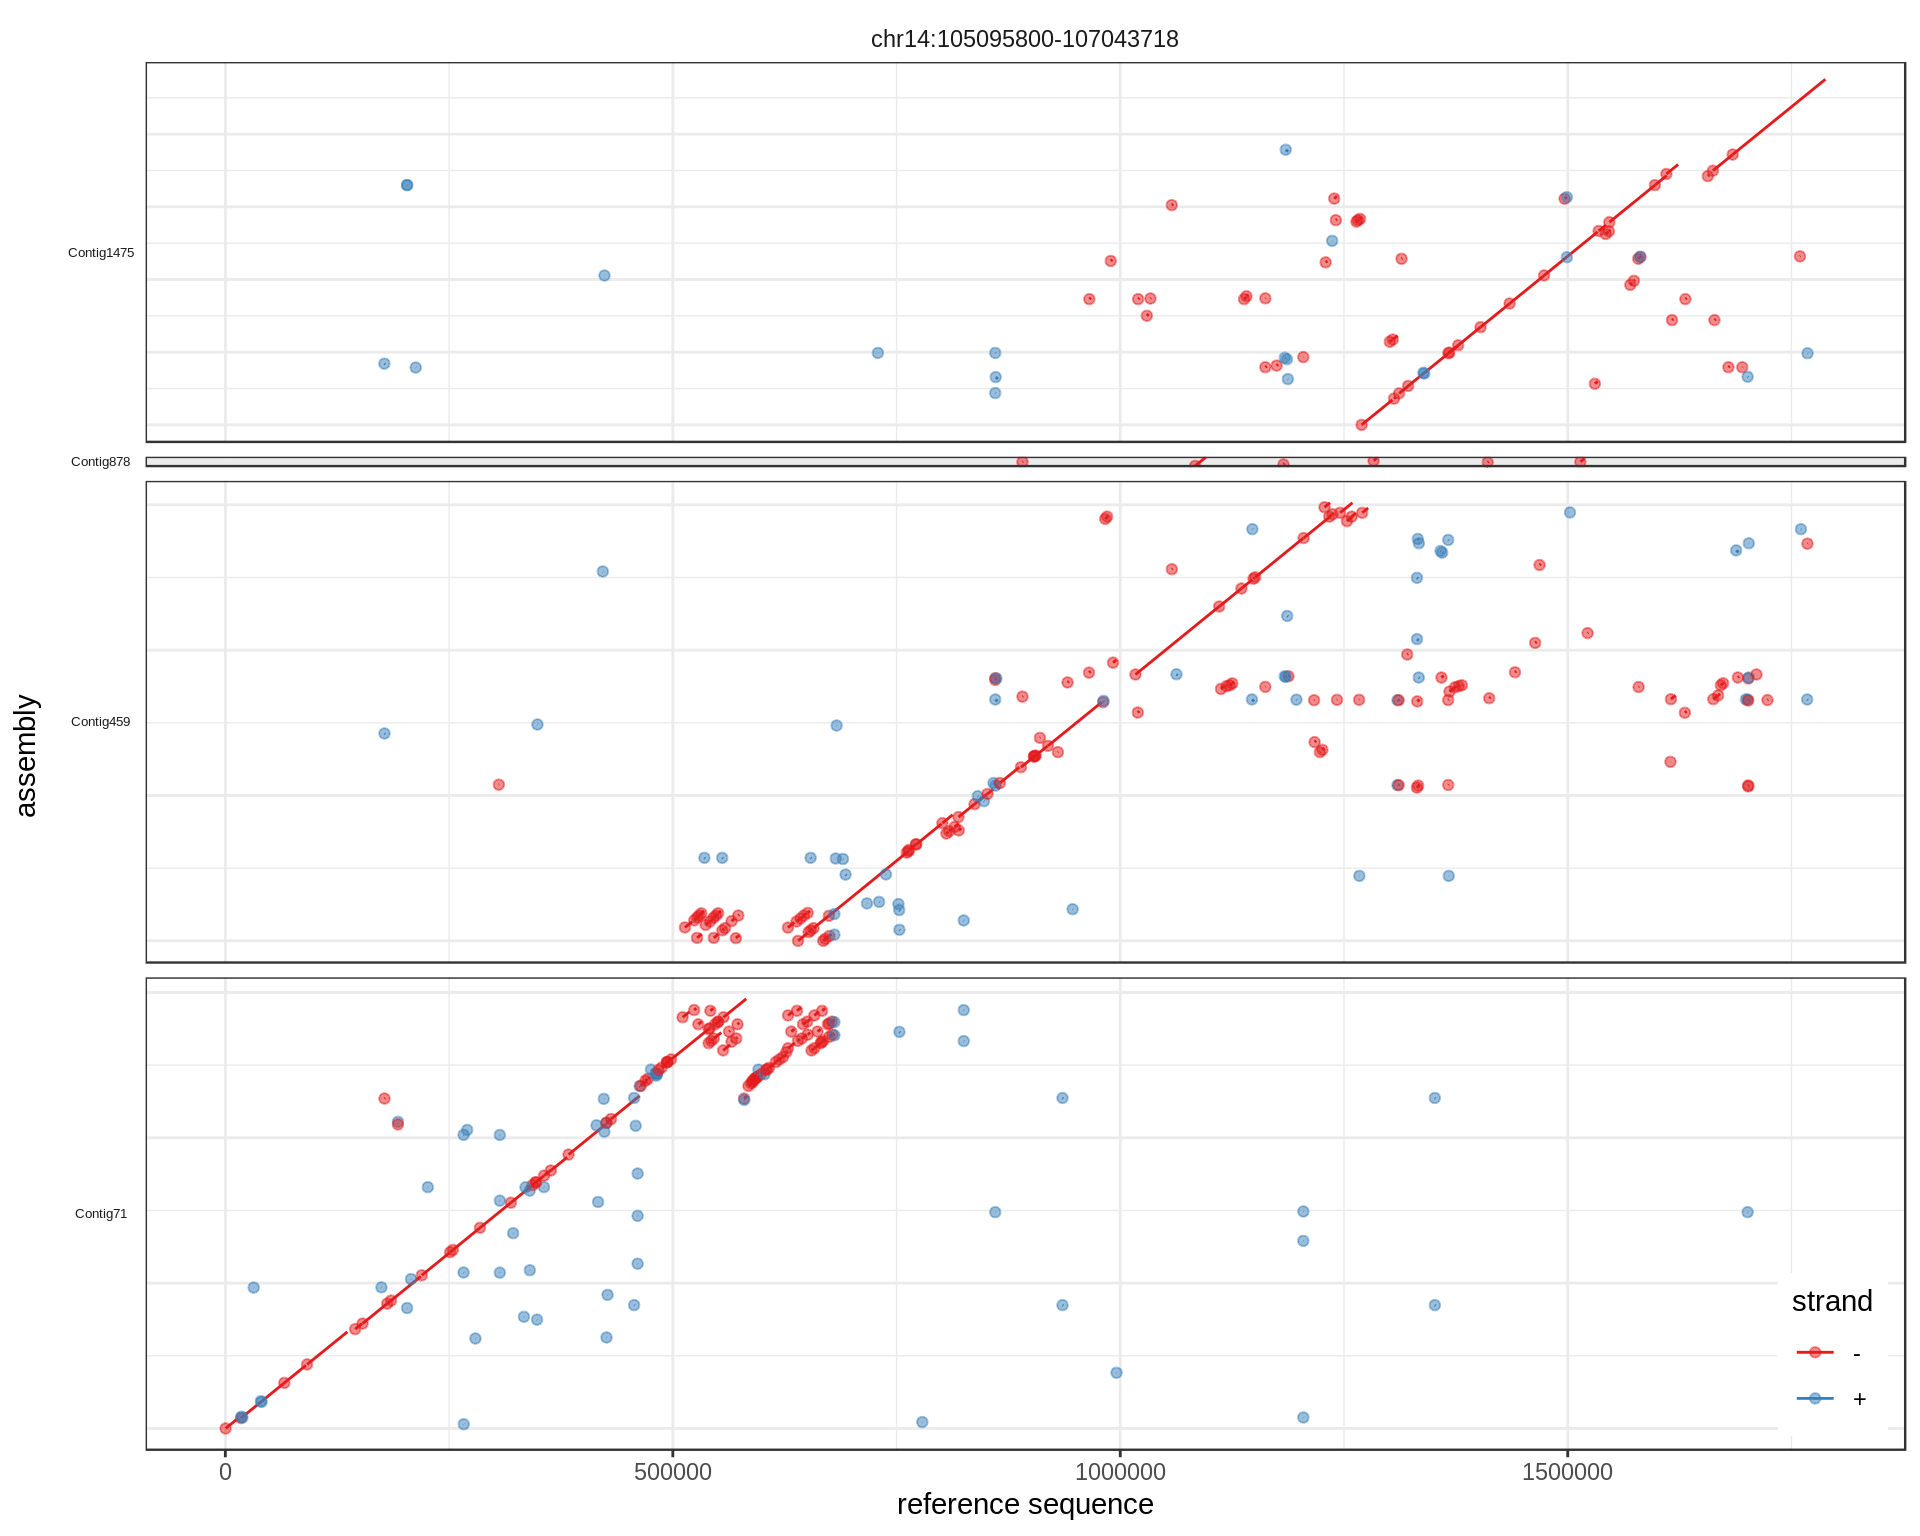
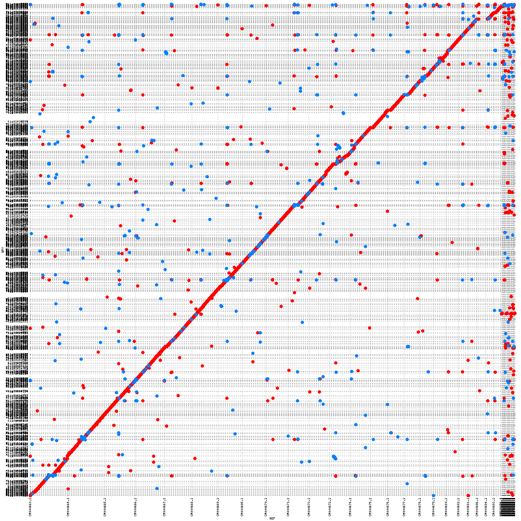
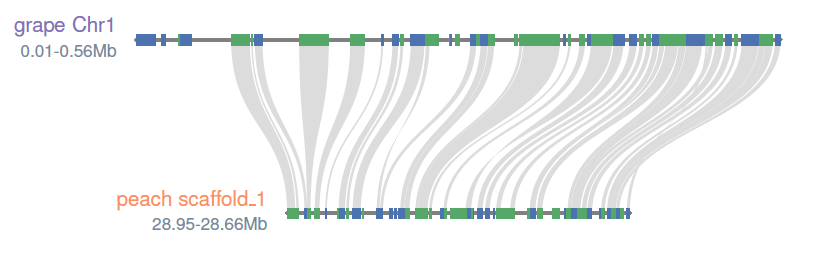

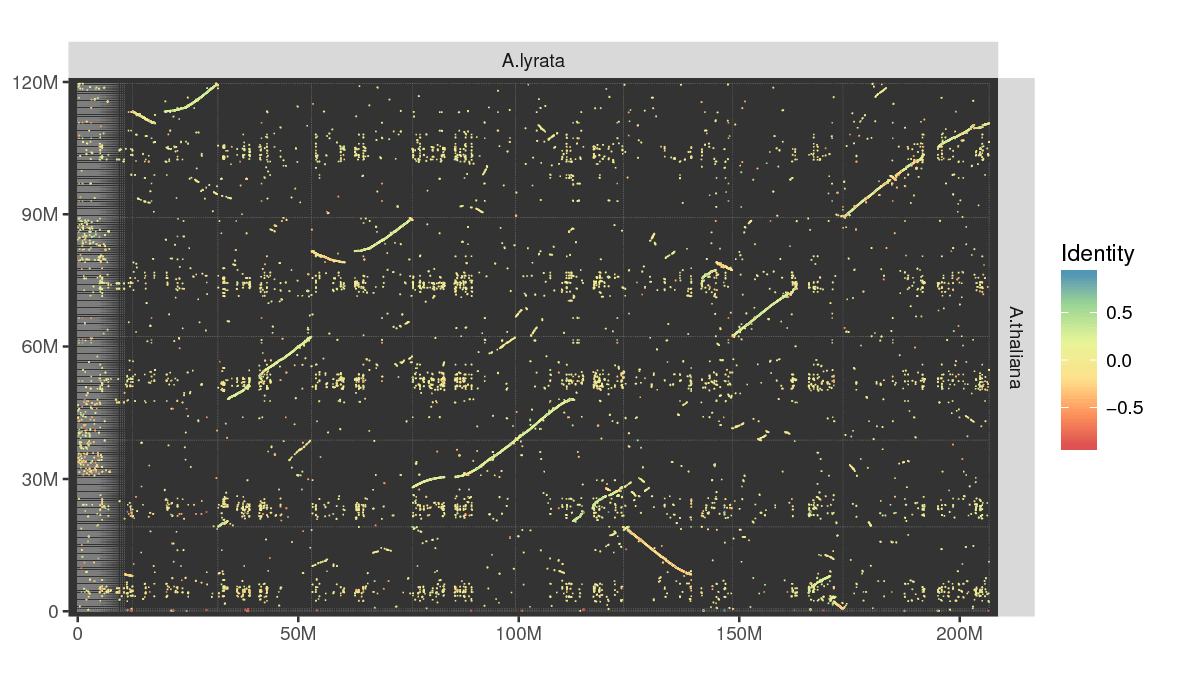
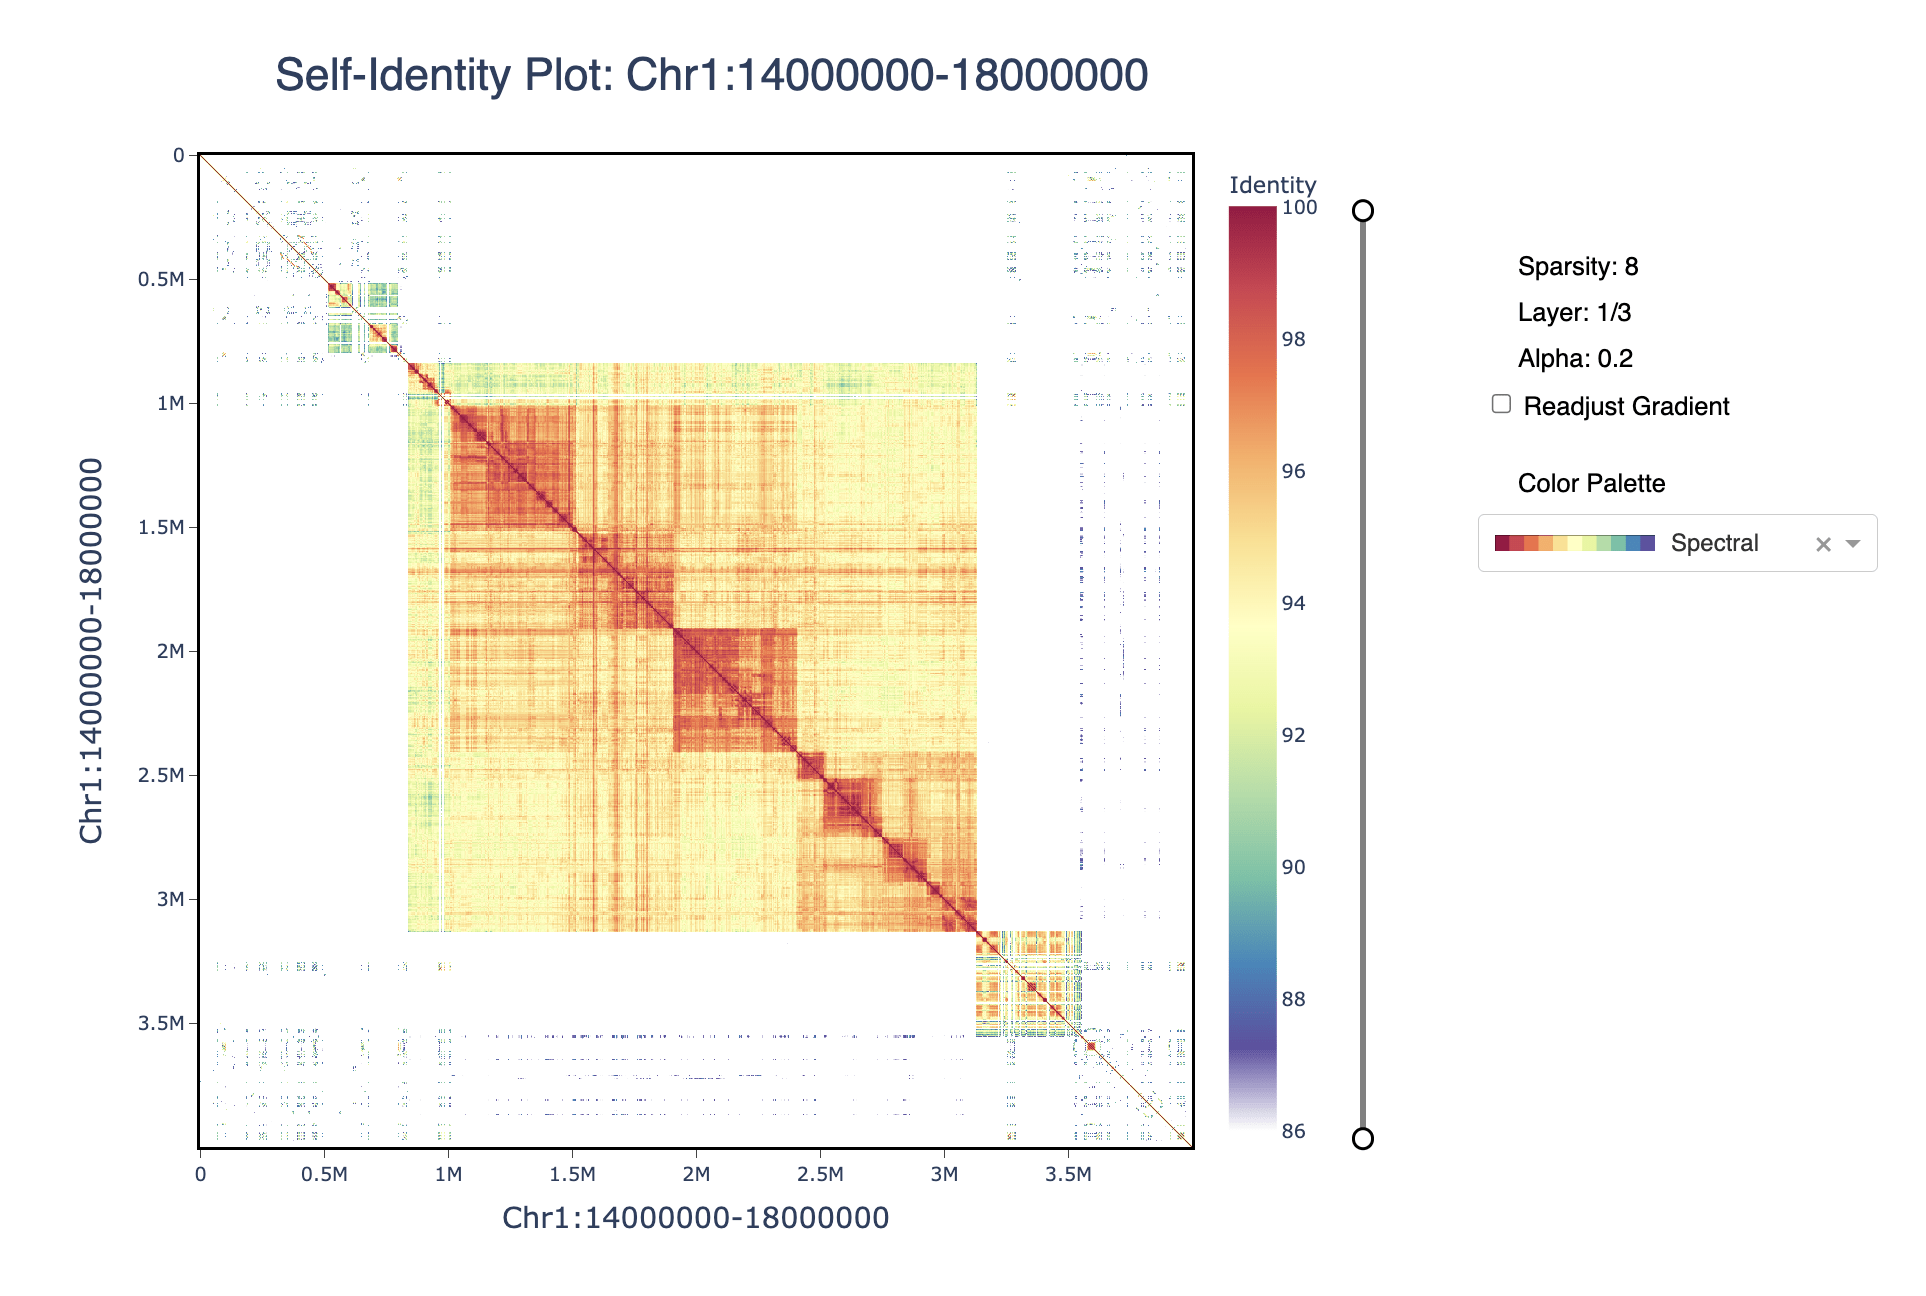
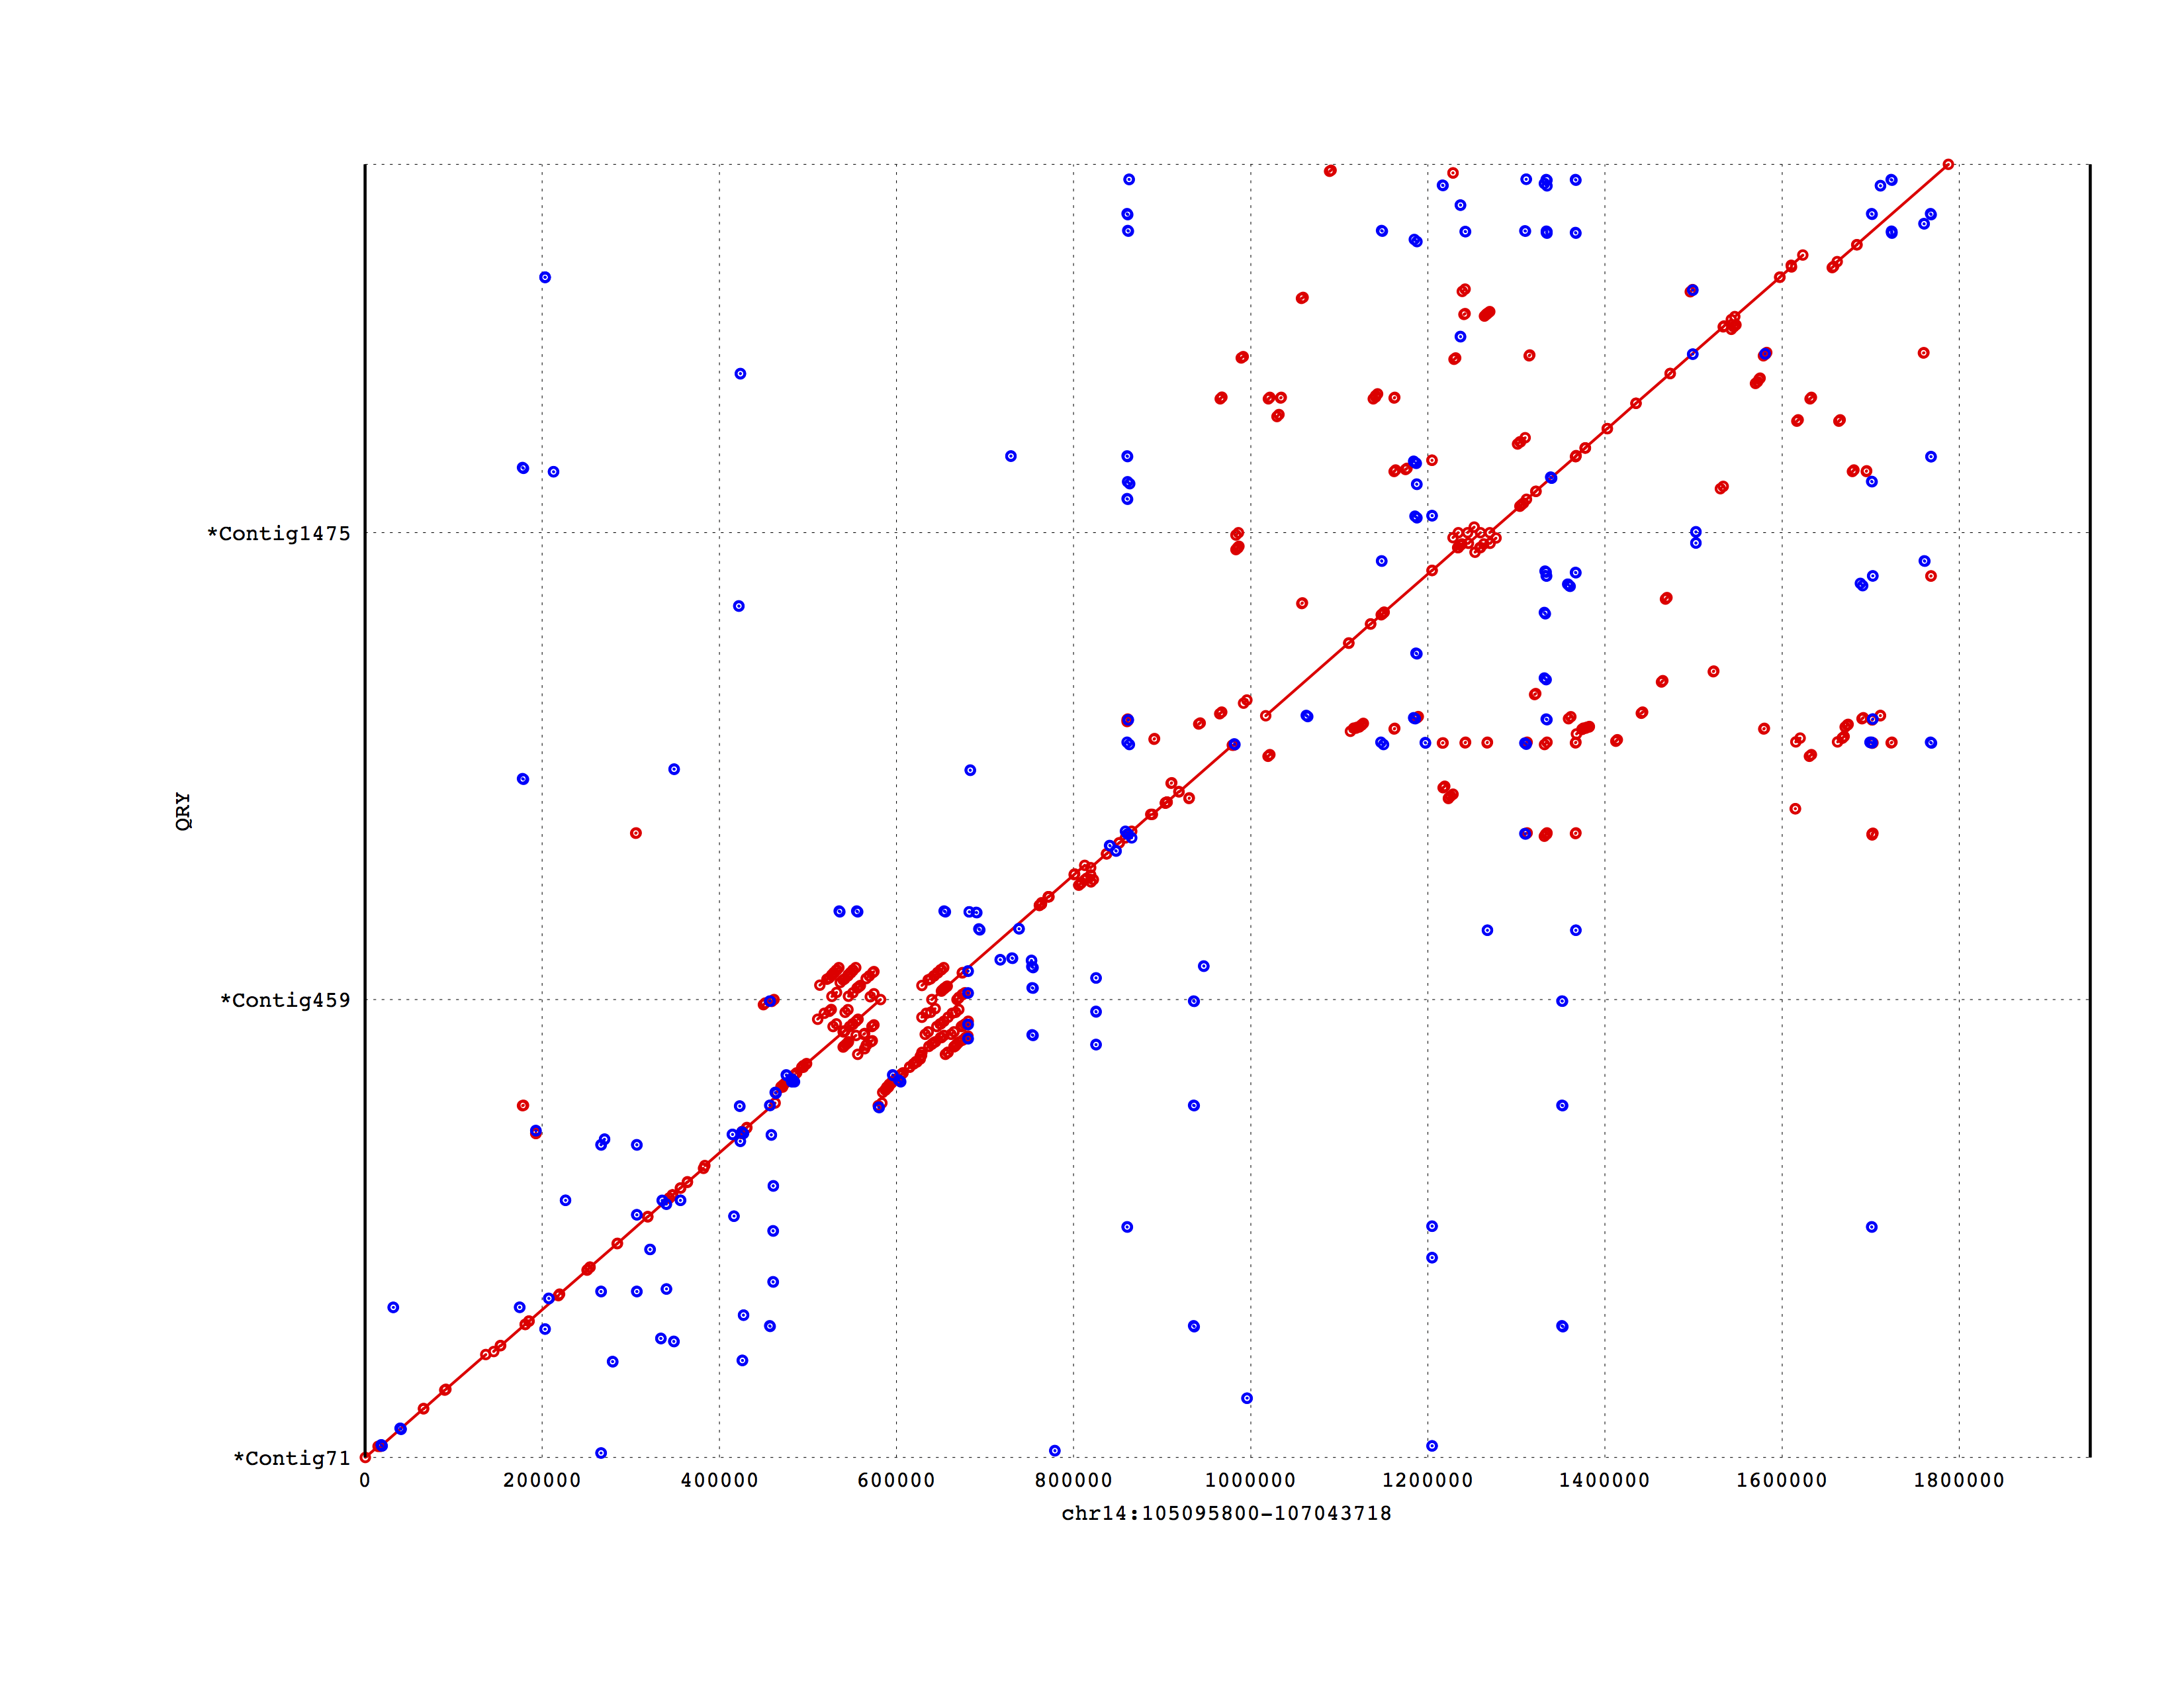
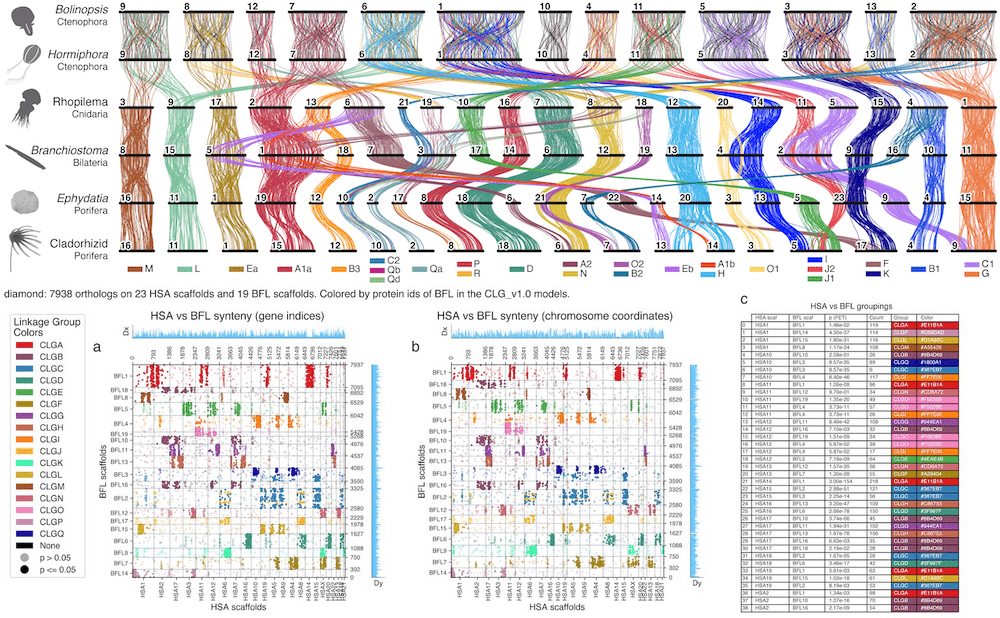
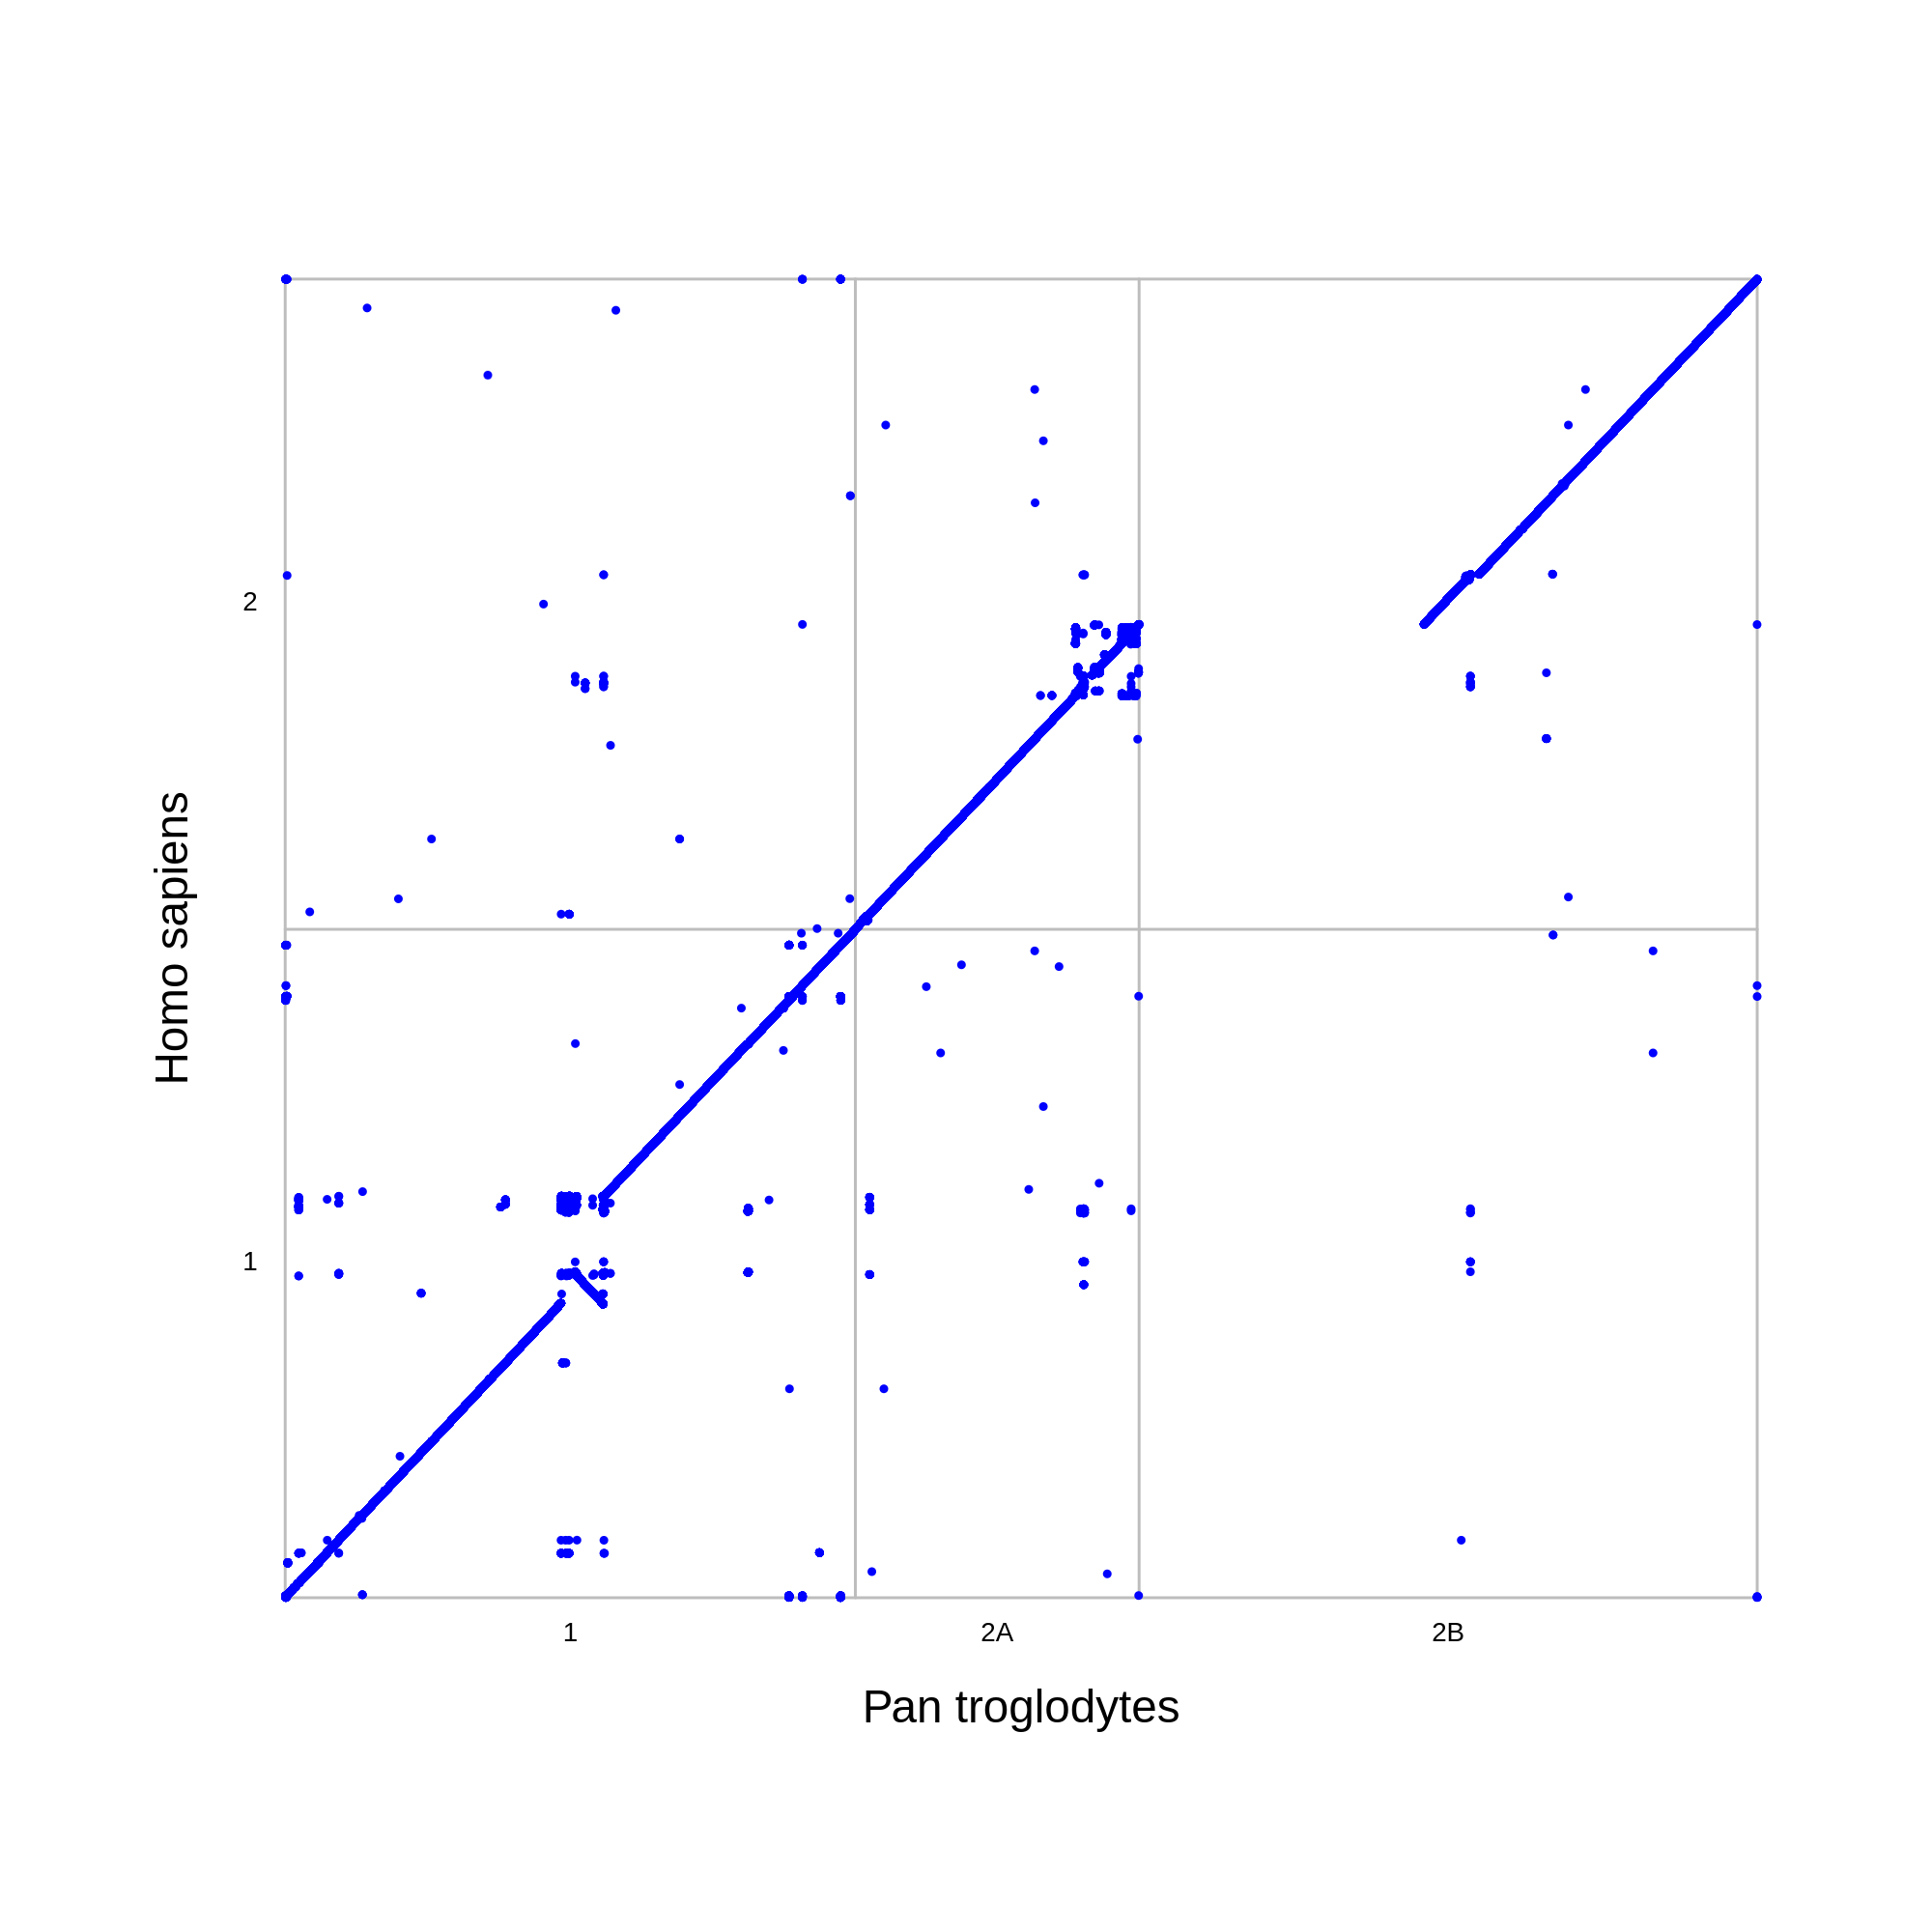
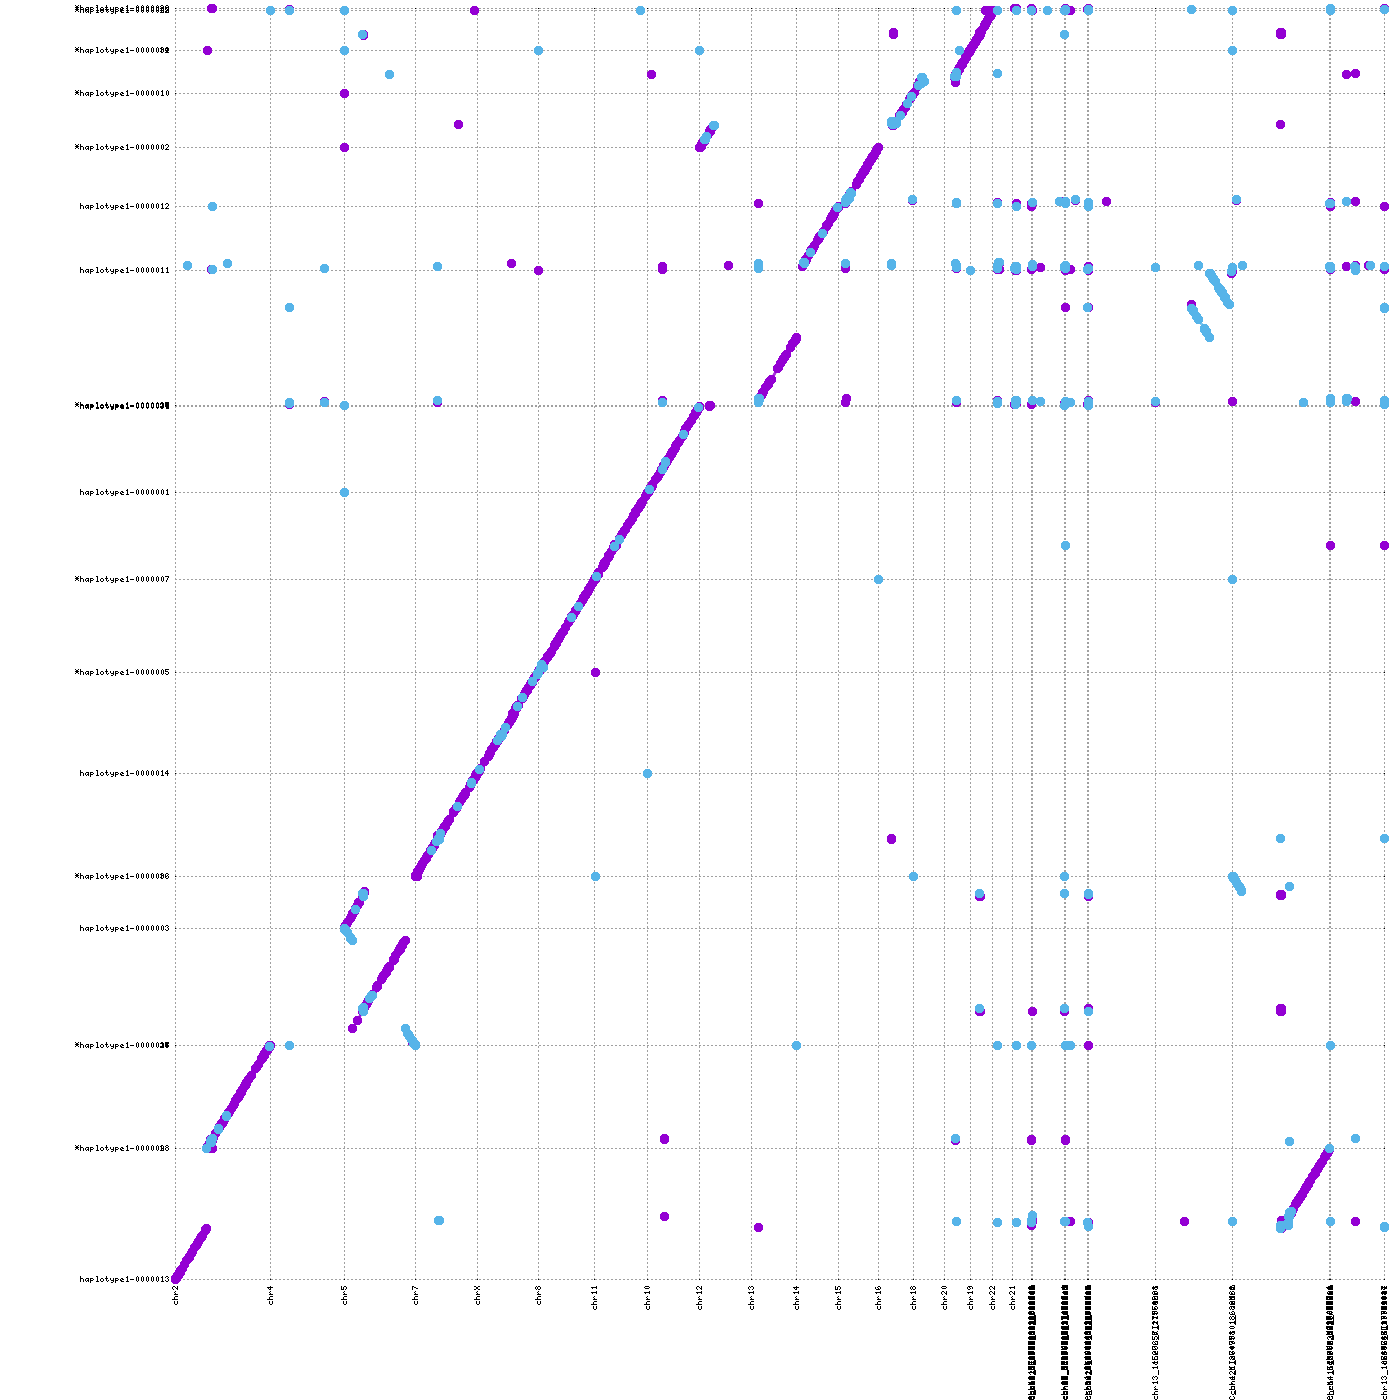
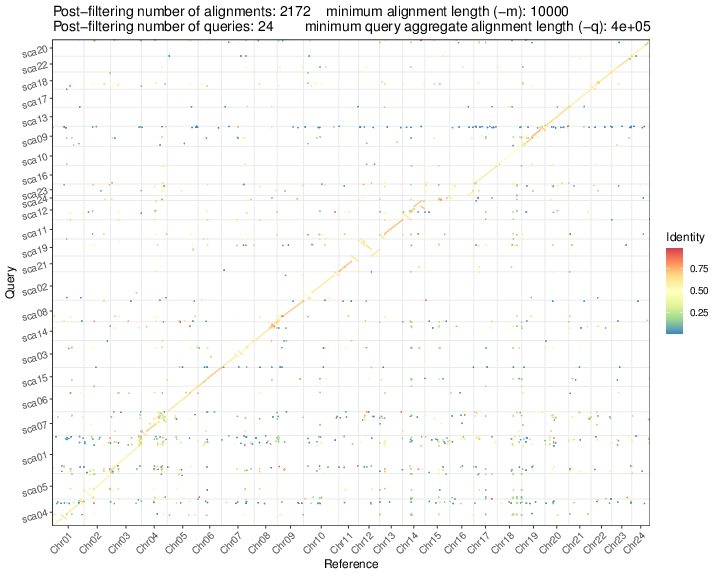
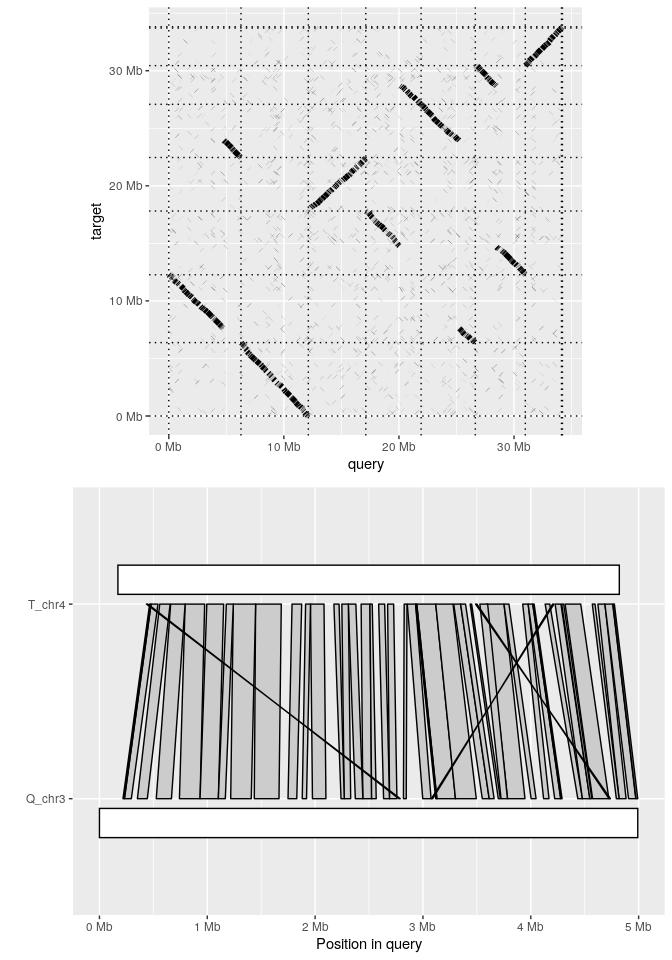
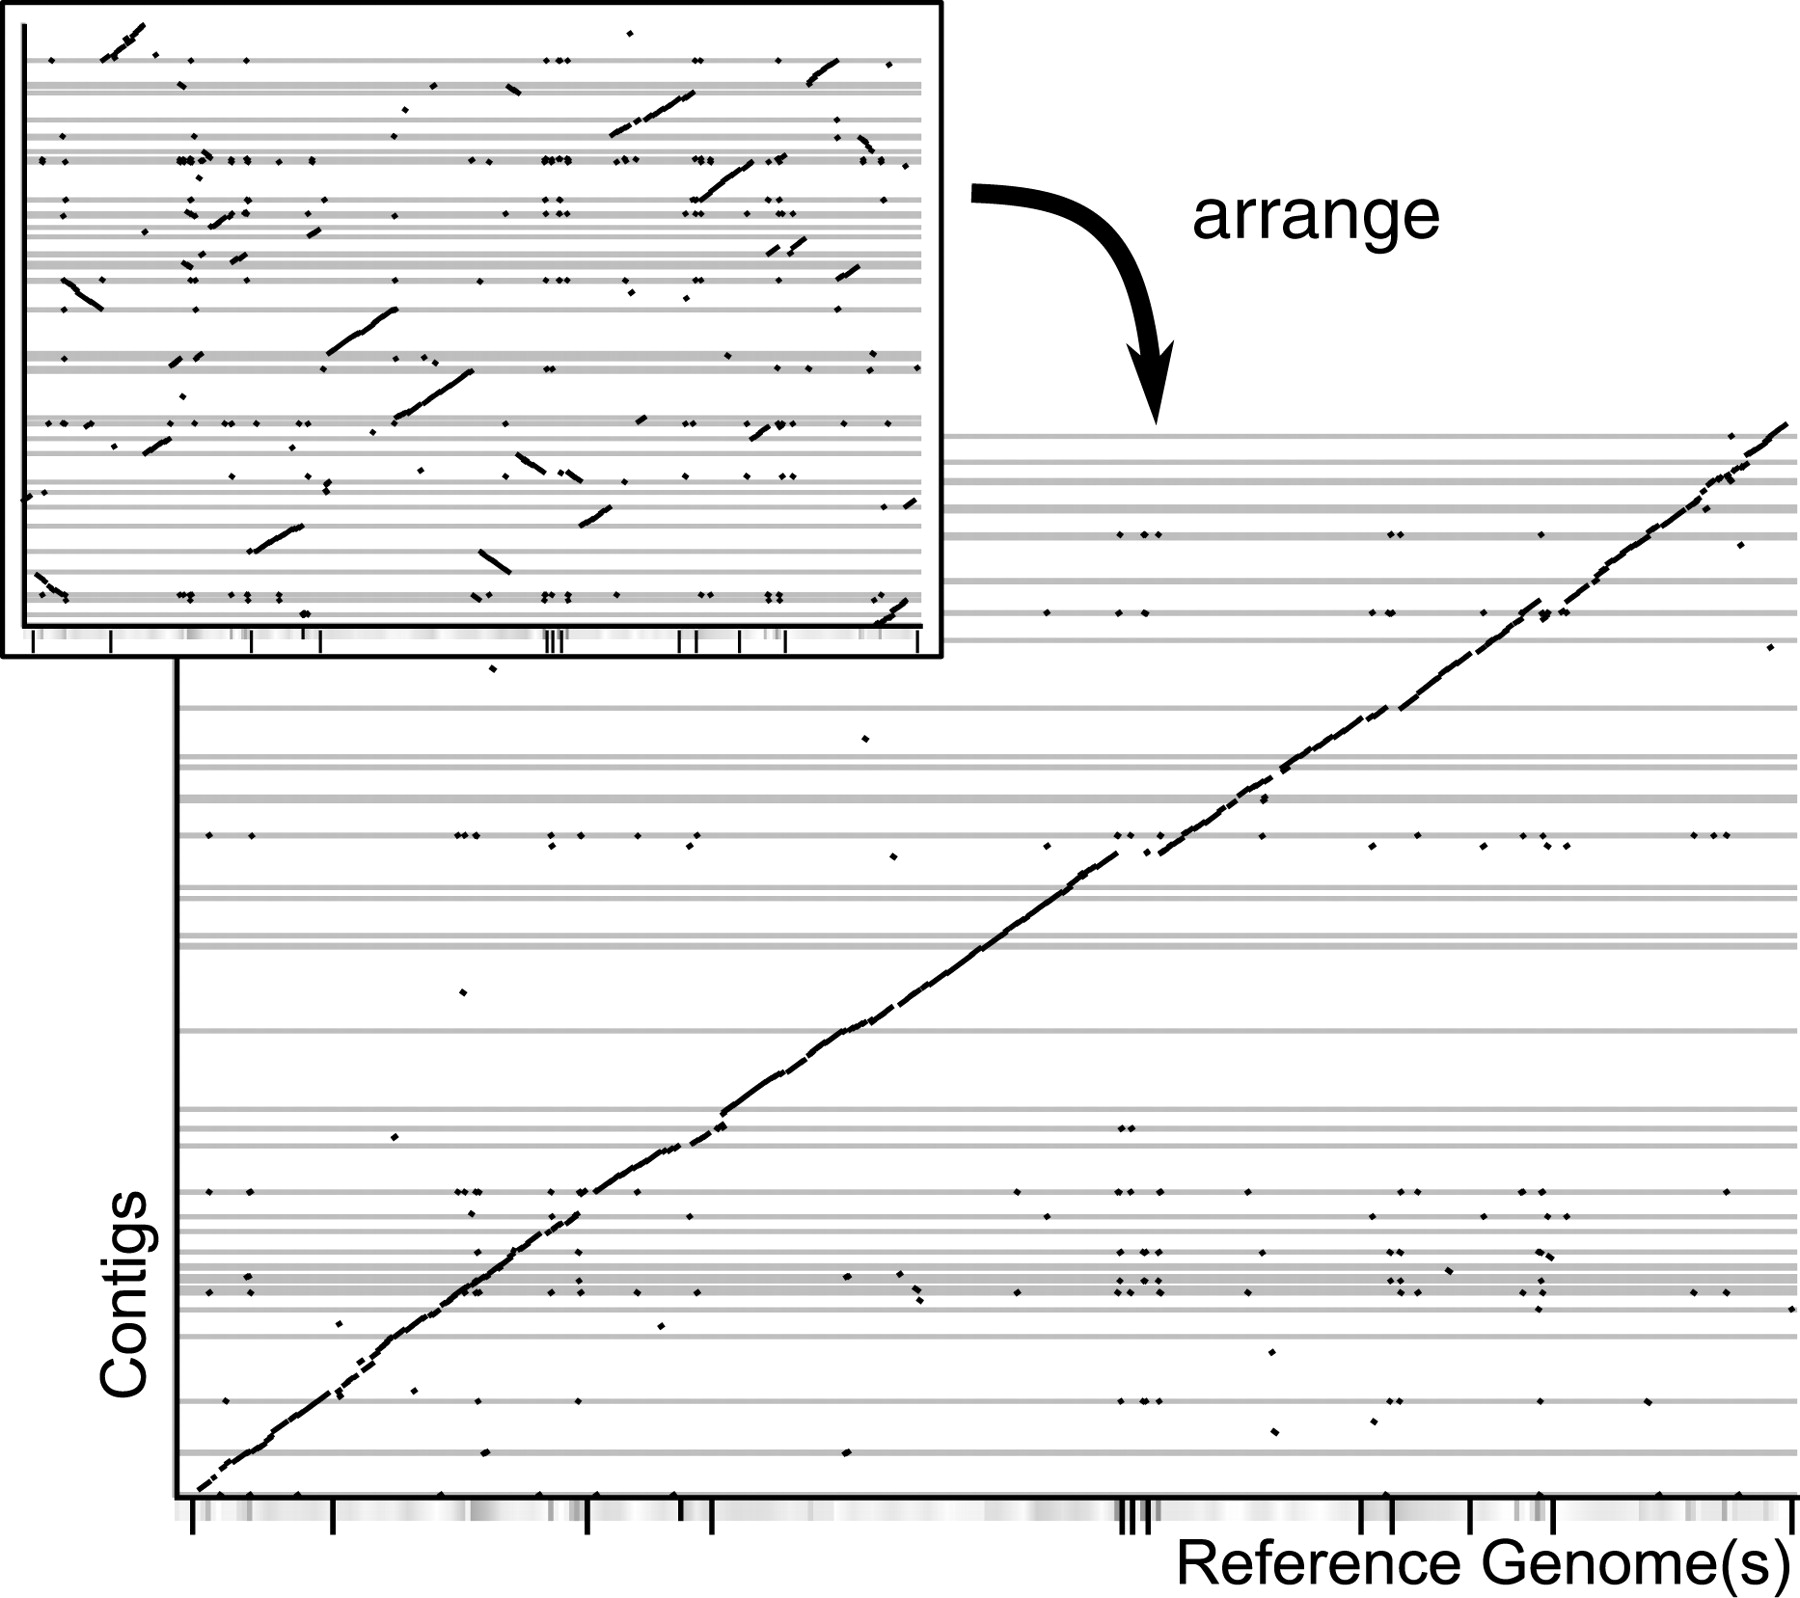
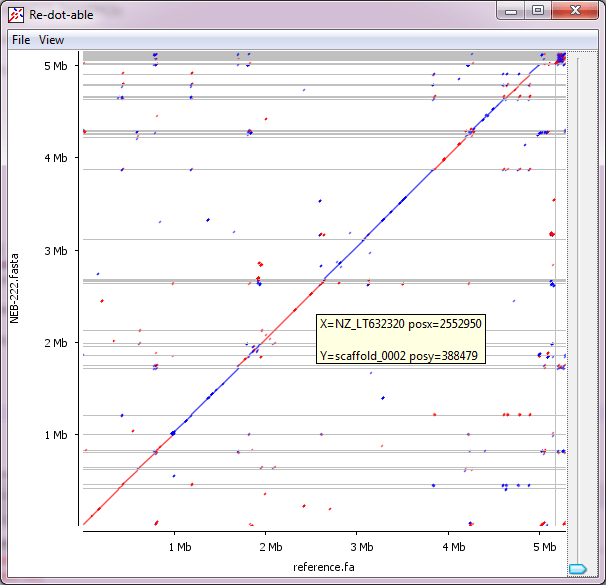
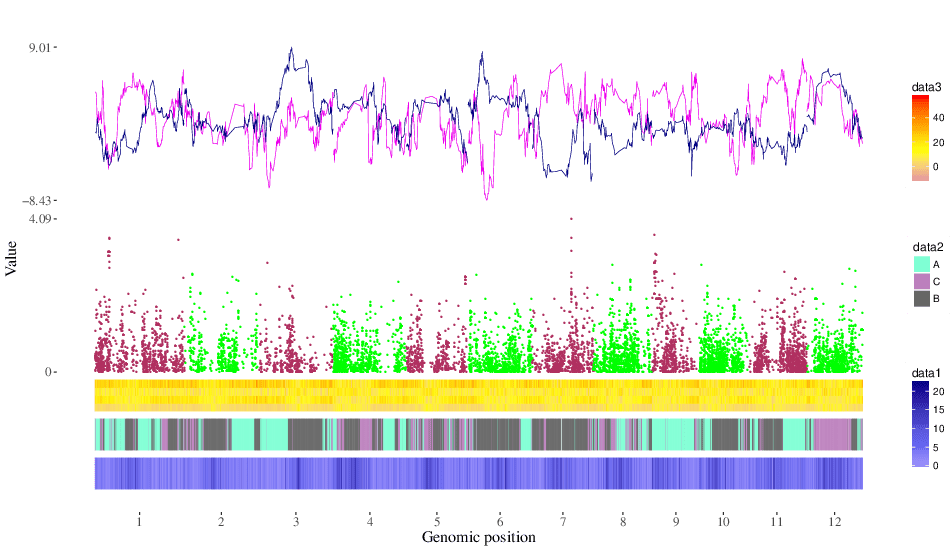
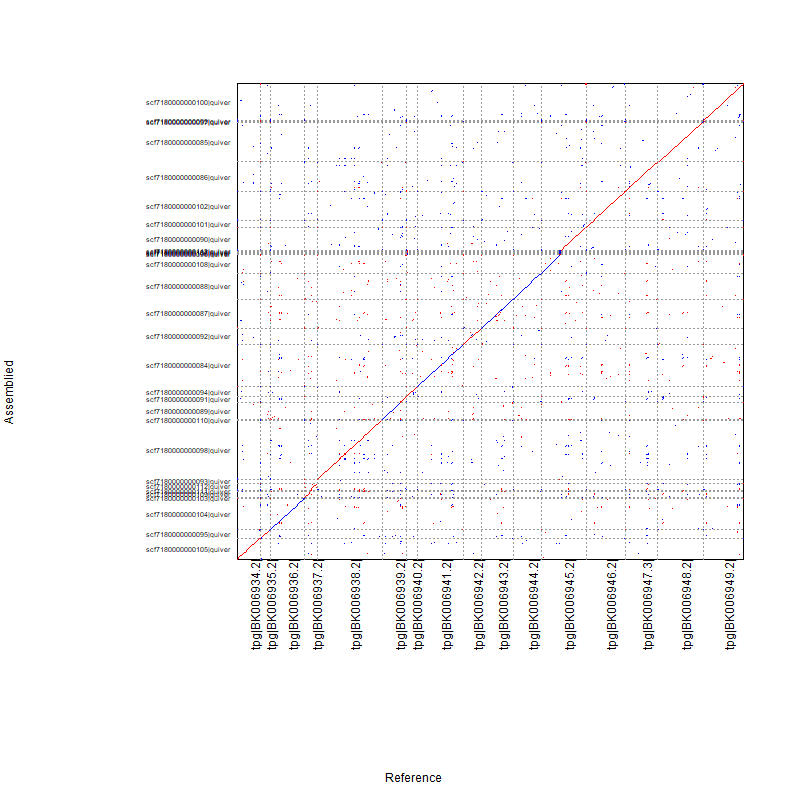
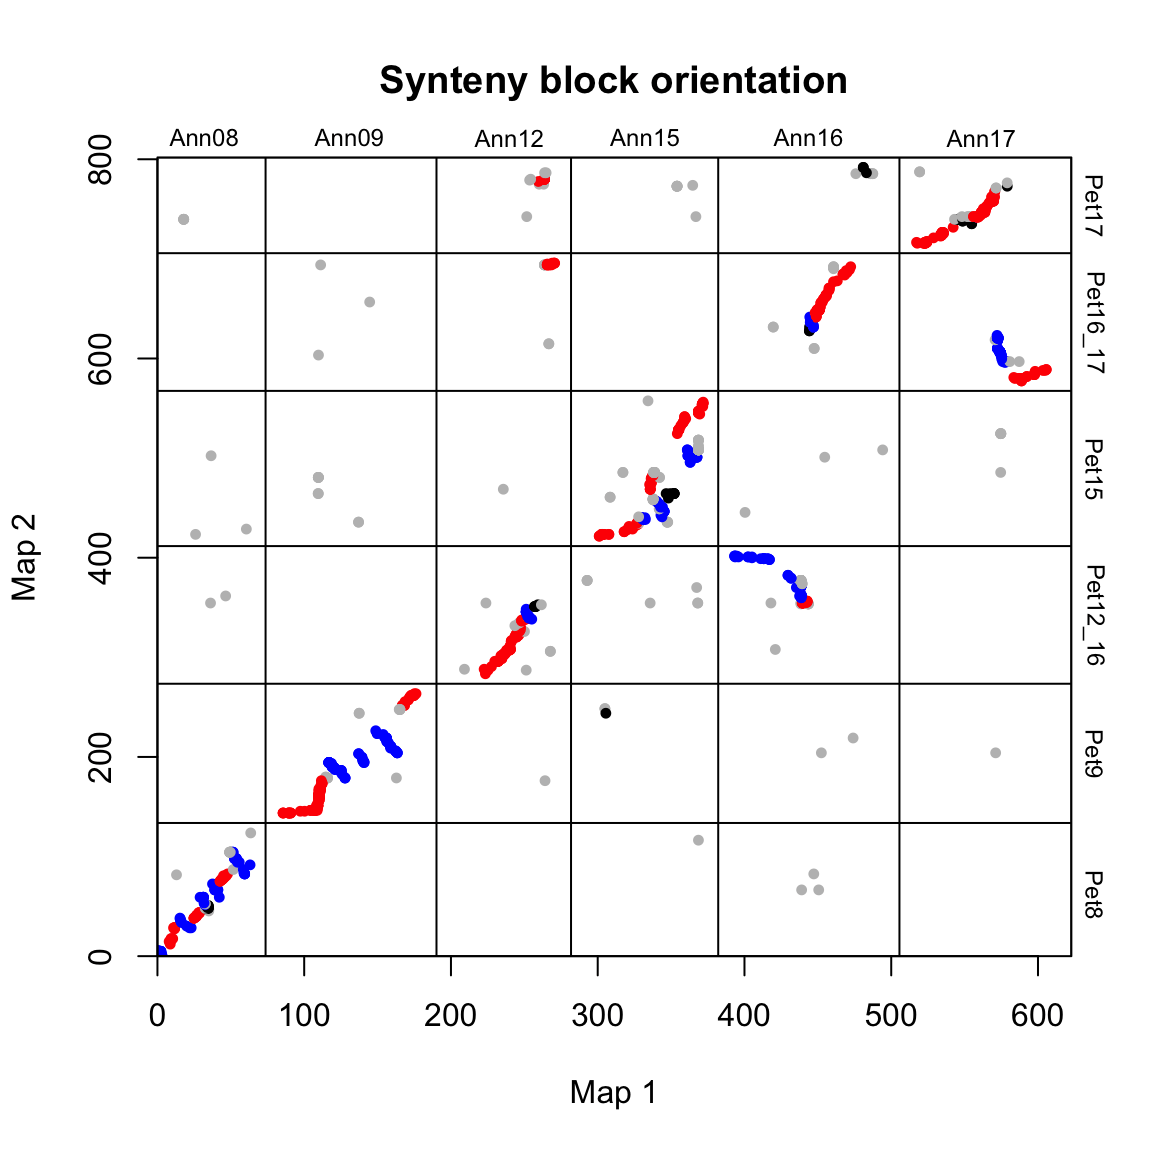
- ChIA-Pipe (img)
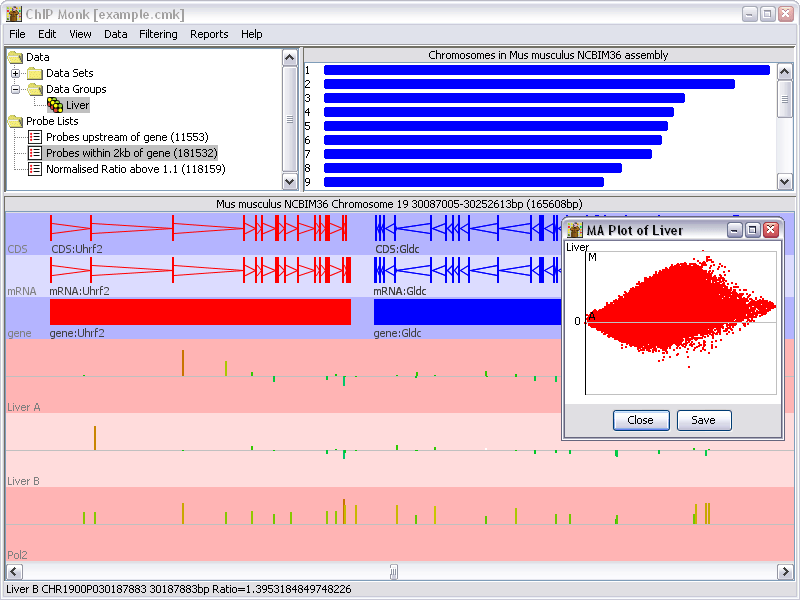
- Chip Monk (Also see SeqMonk https://www.bioinformatics.babraham.ac.uk/projects/seqmonk/) (img)
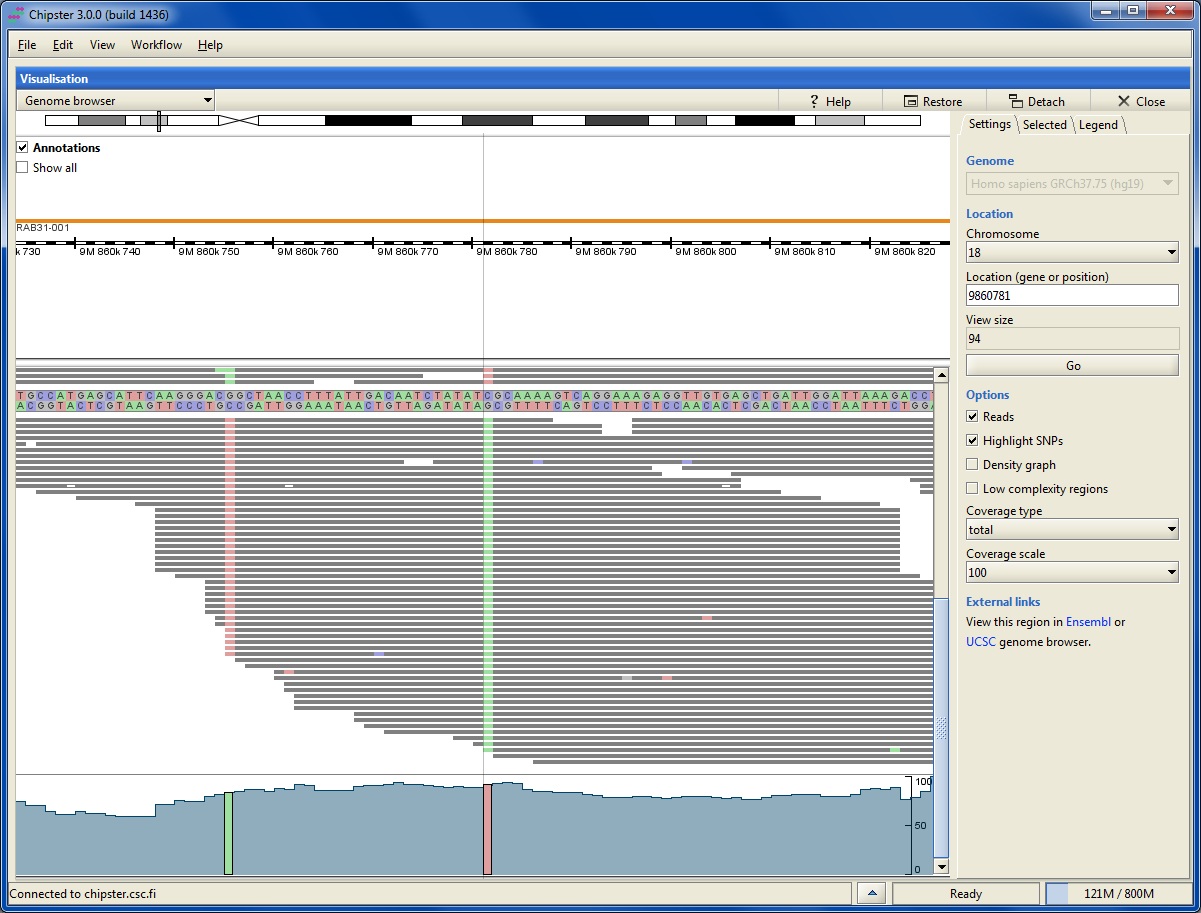
- Chipster (Copy number tutorial https://chipster.csc.fi/manual/cn-tutorial.pdf) (img)
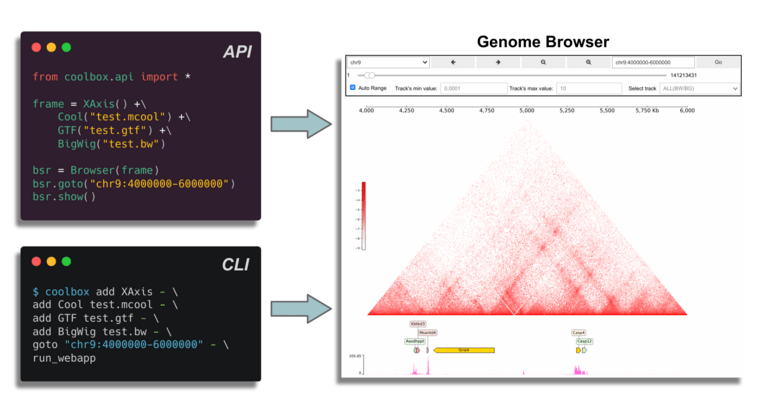
- CoolBox (fork of pyGenomeTracks) (img)
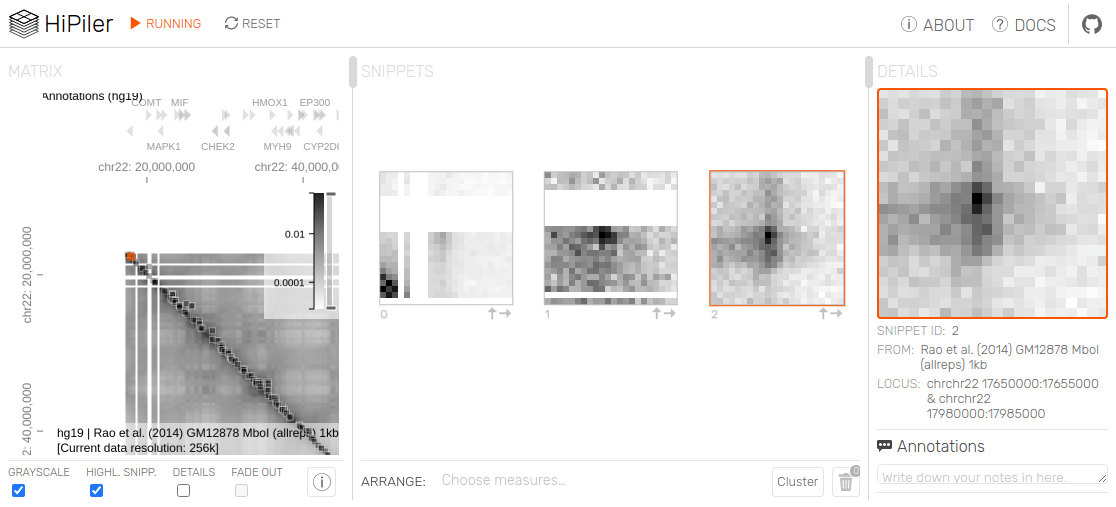
- HiPiler (img)
- Juicebox (img)
- Juicebox.js (img)
- Methplotlib (img)
- python-genome-browser aka pygbrowse (img)
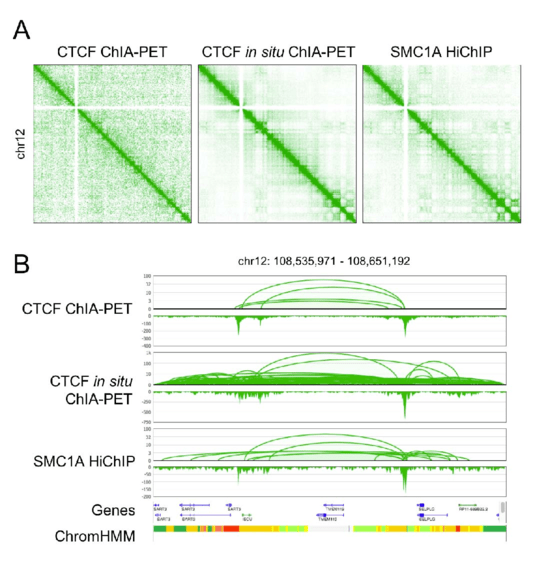
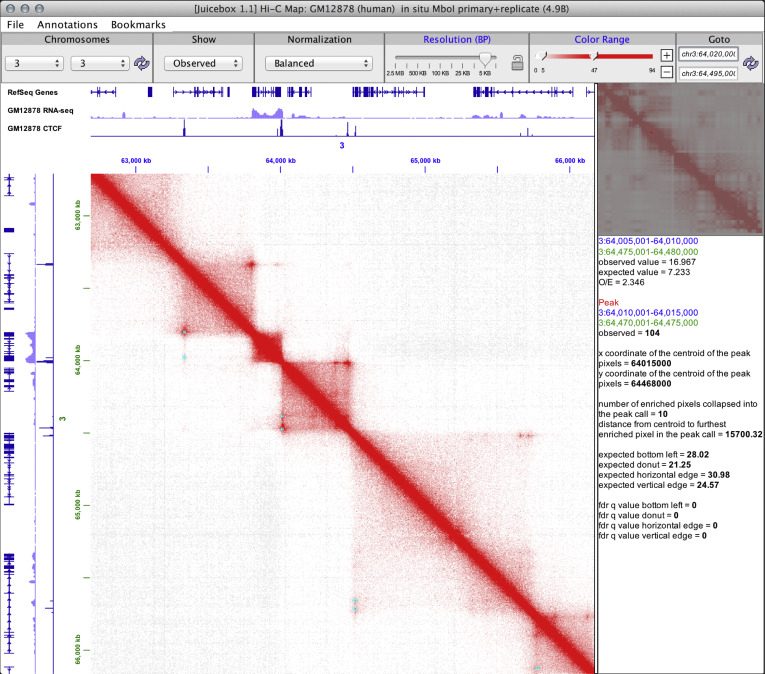
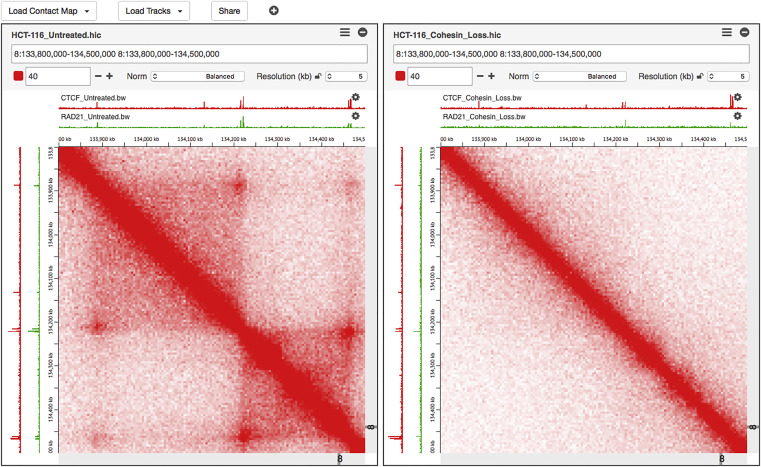
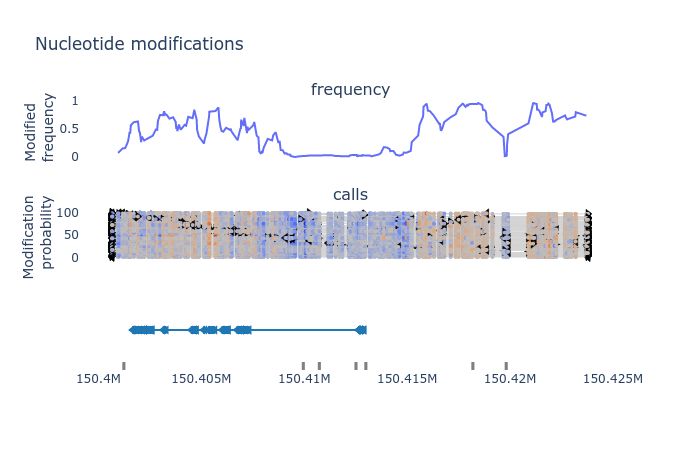
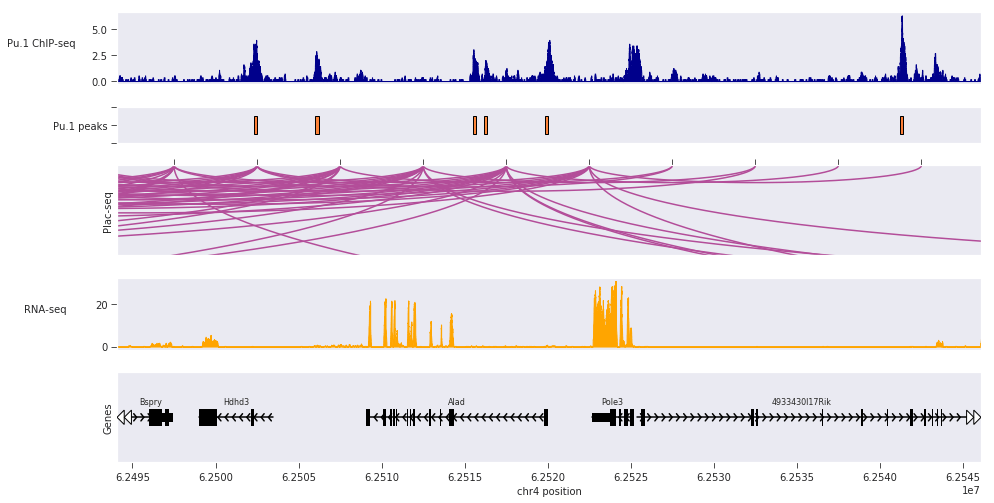
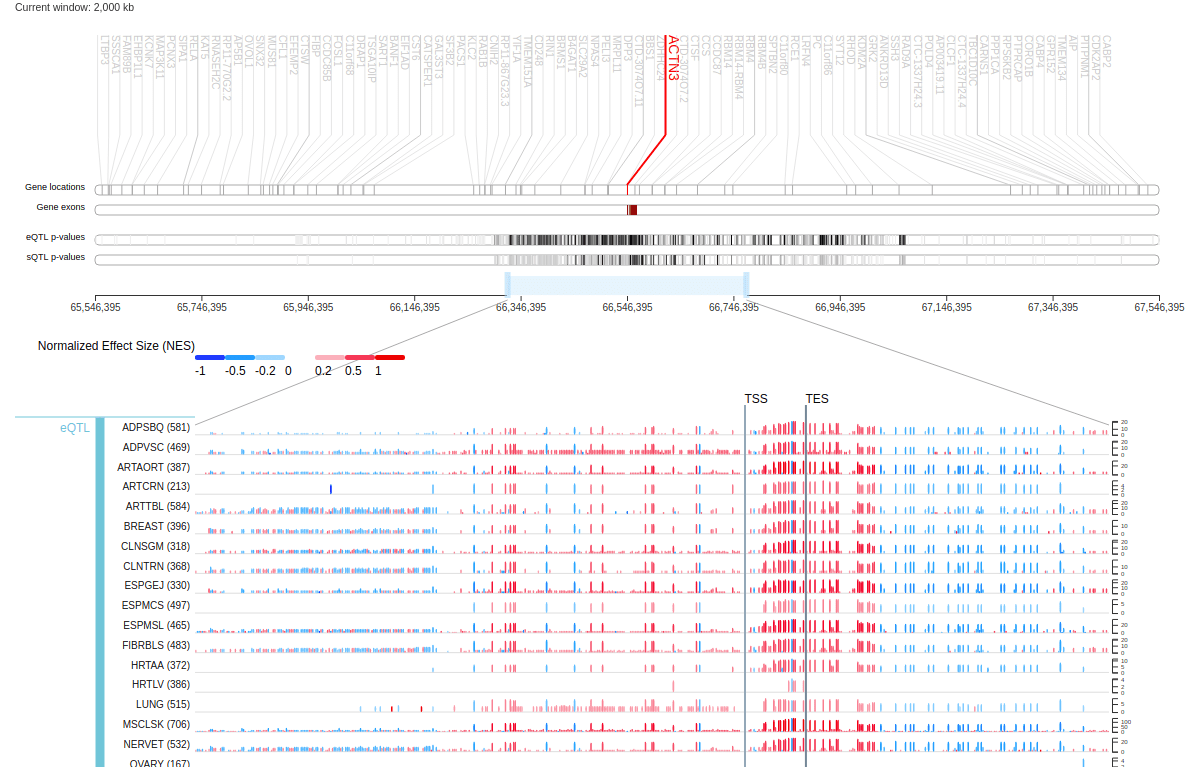
- GTEX Locus browser (img)
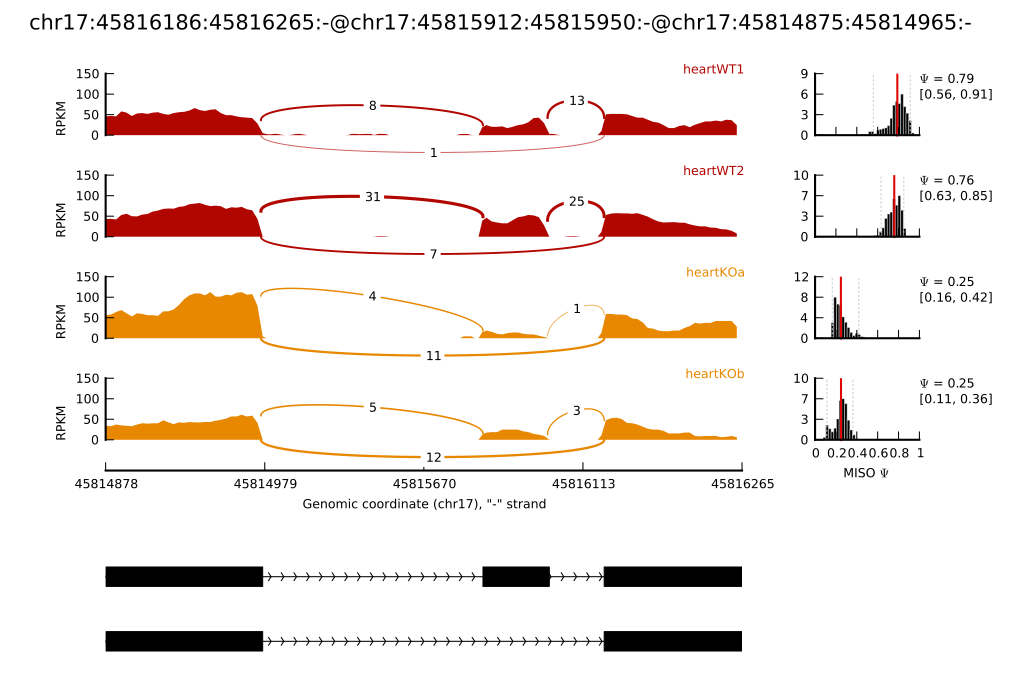
- SashimiPlot (See also rmats2sashimiplot which uses MISO. MATS stands for Multivariate Analysis of Transcript Splicing) (img)
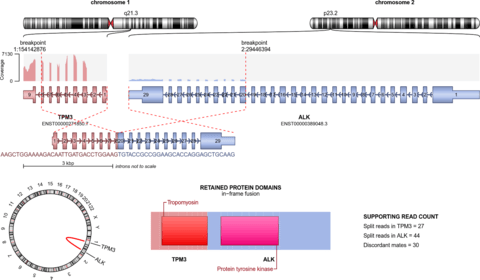
- AGFusion (See also https://www.agfusion.app/ for web based version) (img)
- arriba (img)
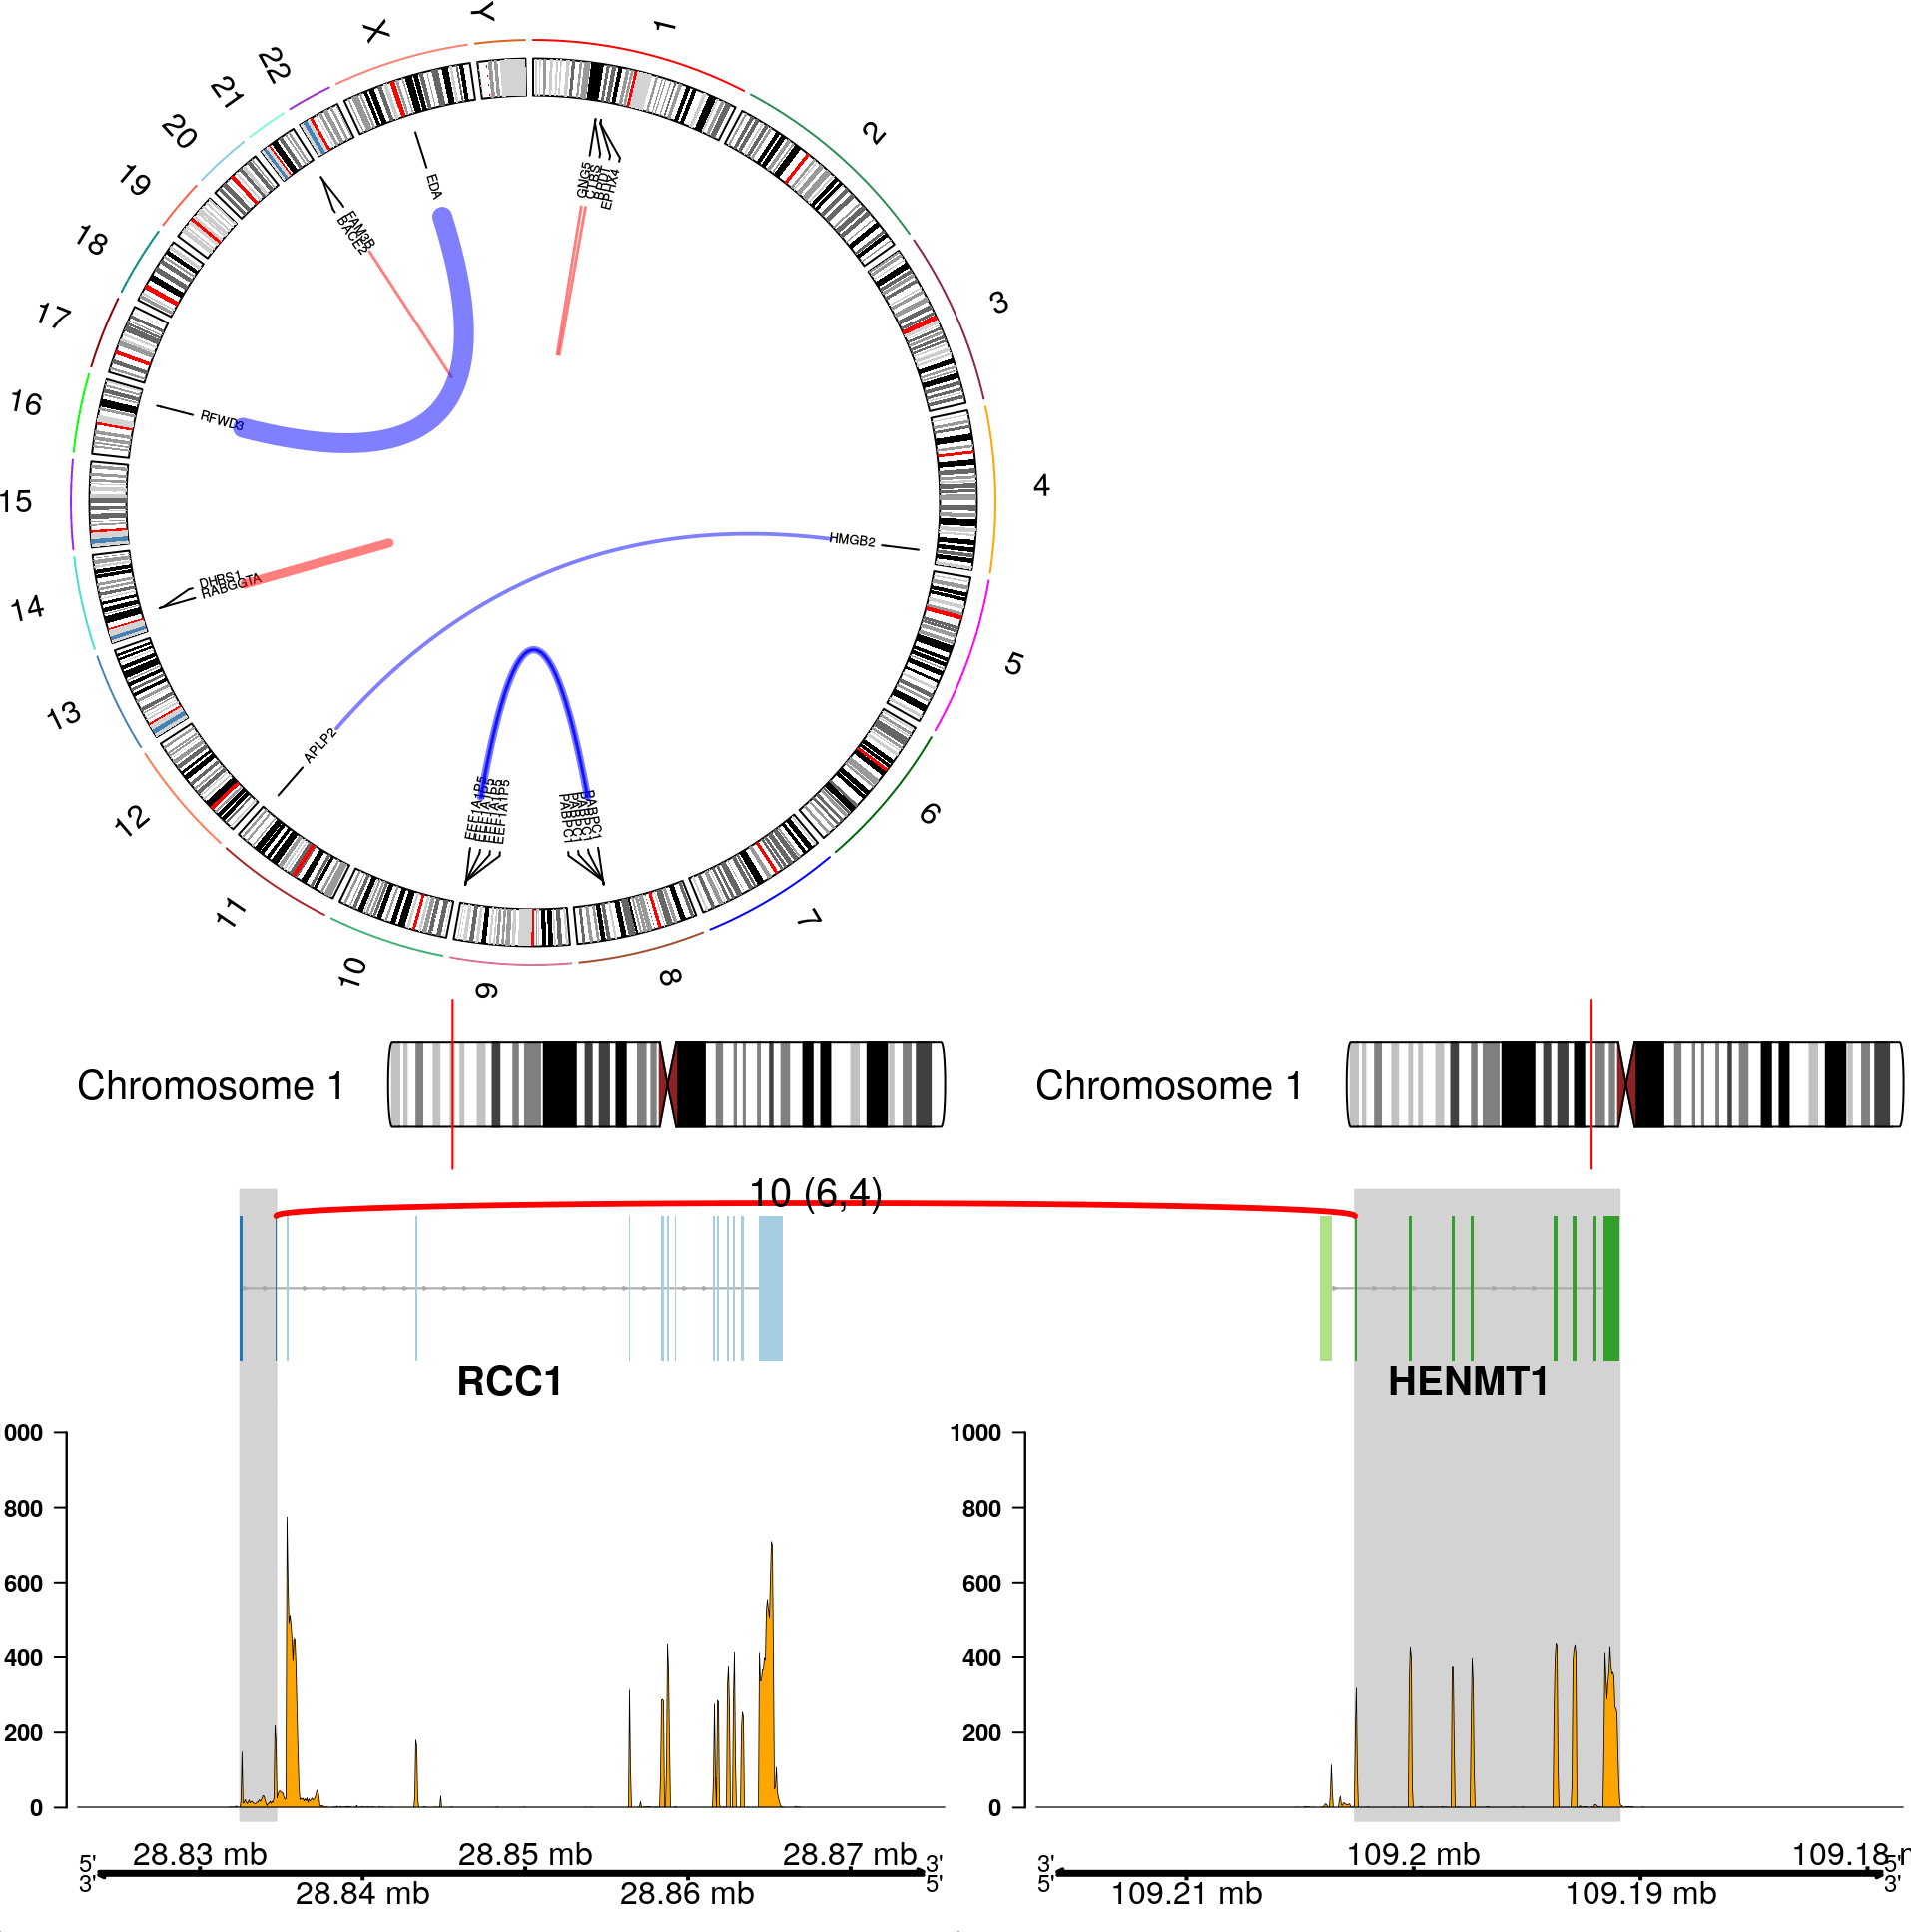
- Chimeraviz (img)
- clinker (gene fusion software) (img)
- FusionInspector (Uses igv.js) (img)
- GeneFuse (img)
- MAVIS (img)

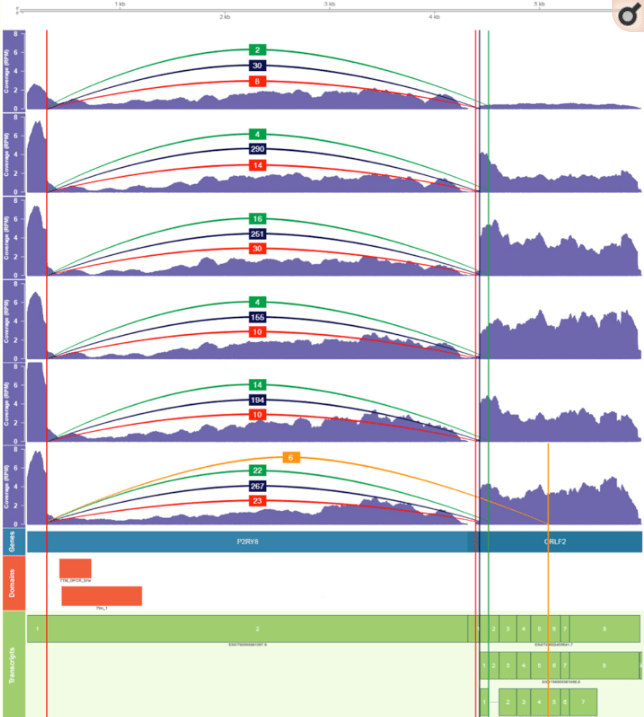


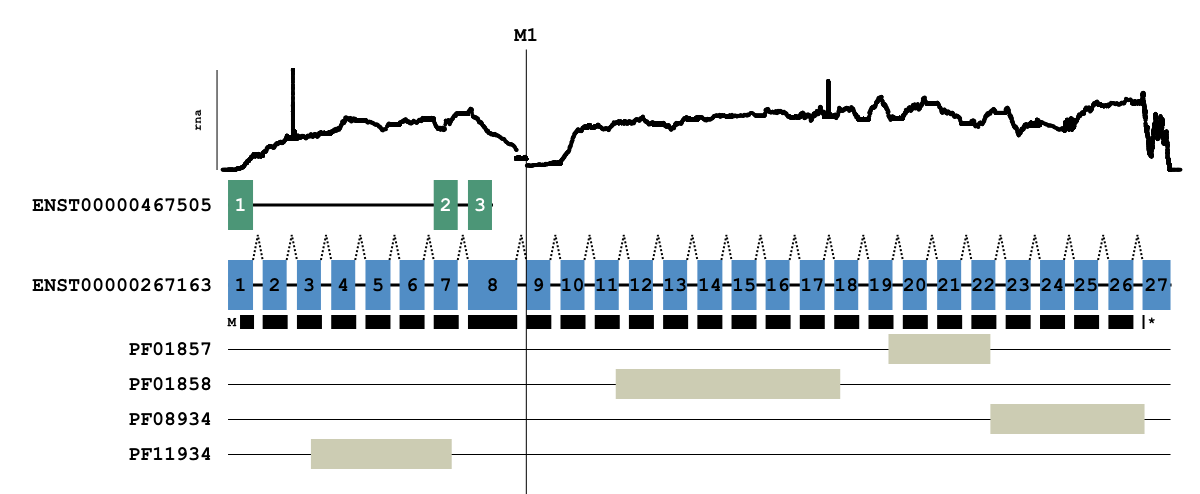
- BactoGENIE (img)
- clinker (img)
- GCSnap (img)
- GeCoViz (img)
- geneviewer (img)
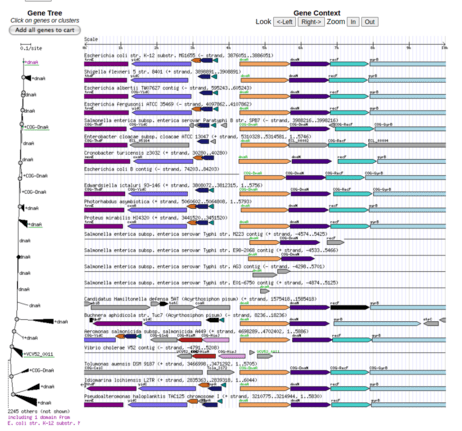
- Genome Context Viewer (img)
- GGgenes (img)
- multiGenomicContext (img)
- OMA local synteny browser (img)
- PSAT (img)

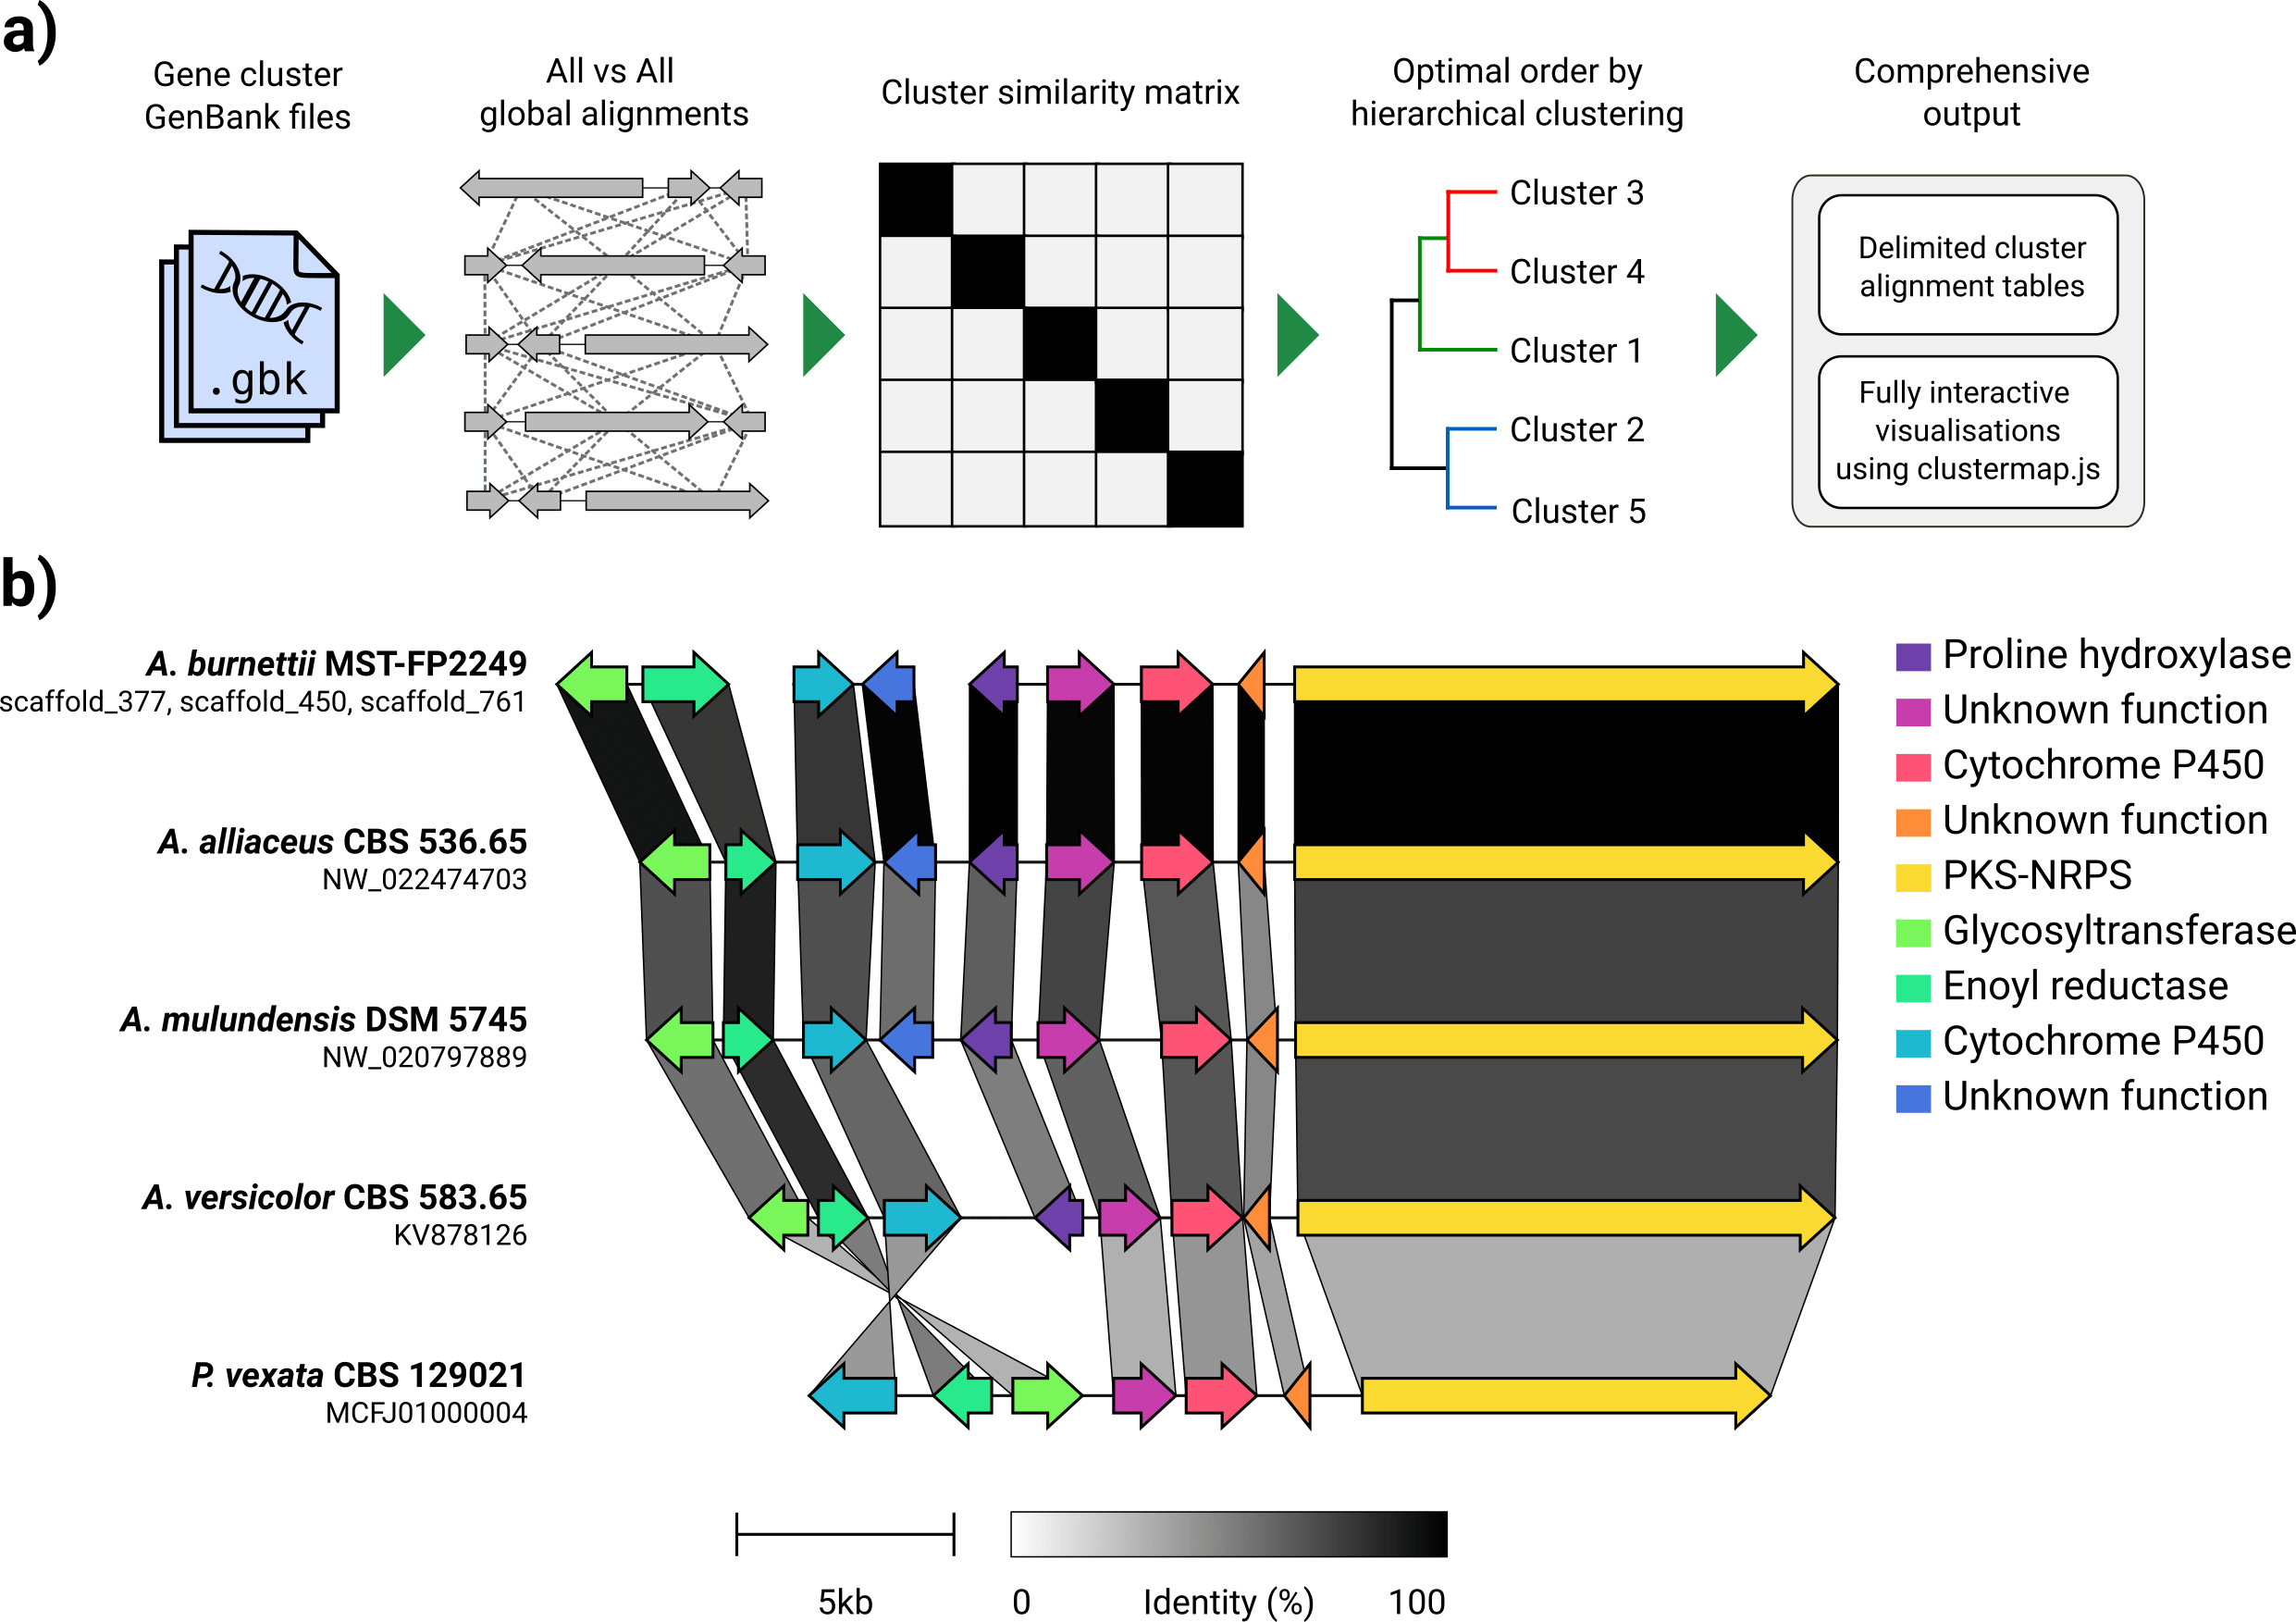
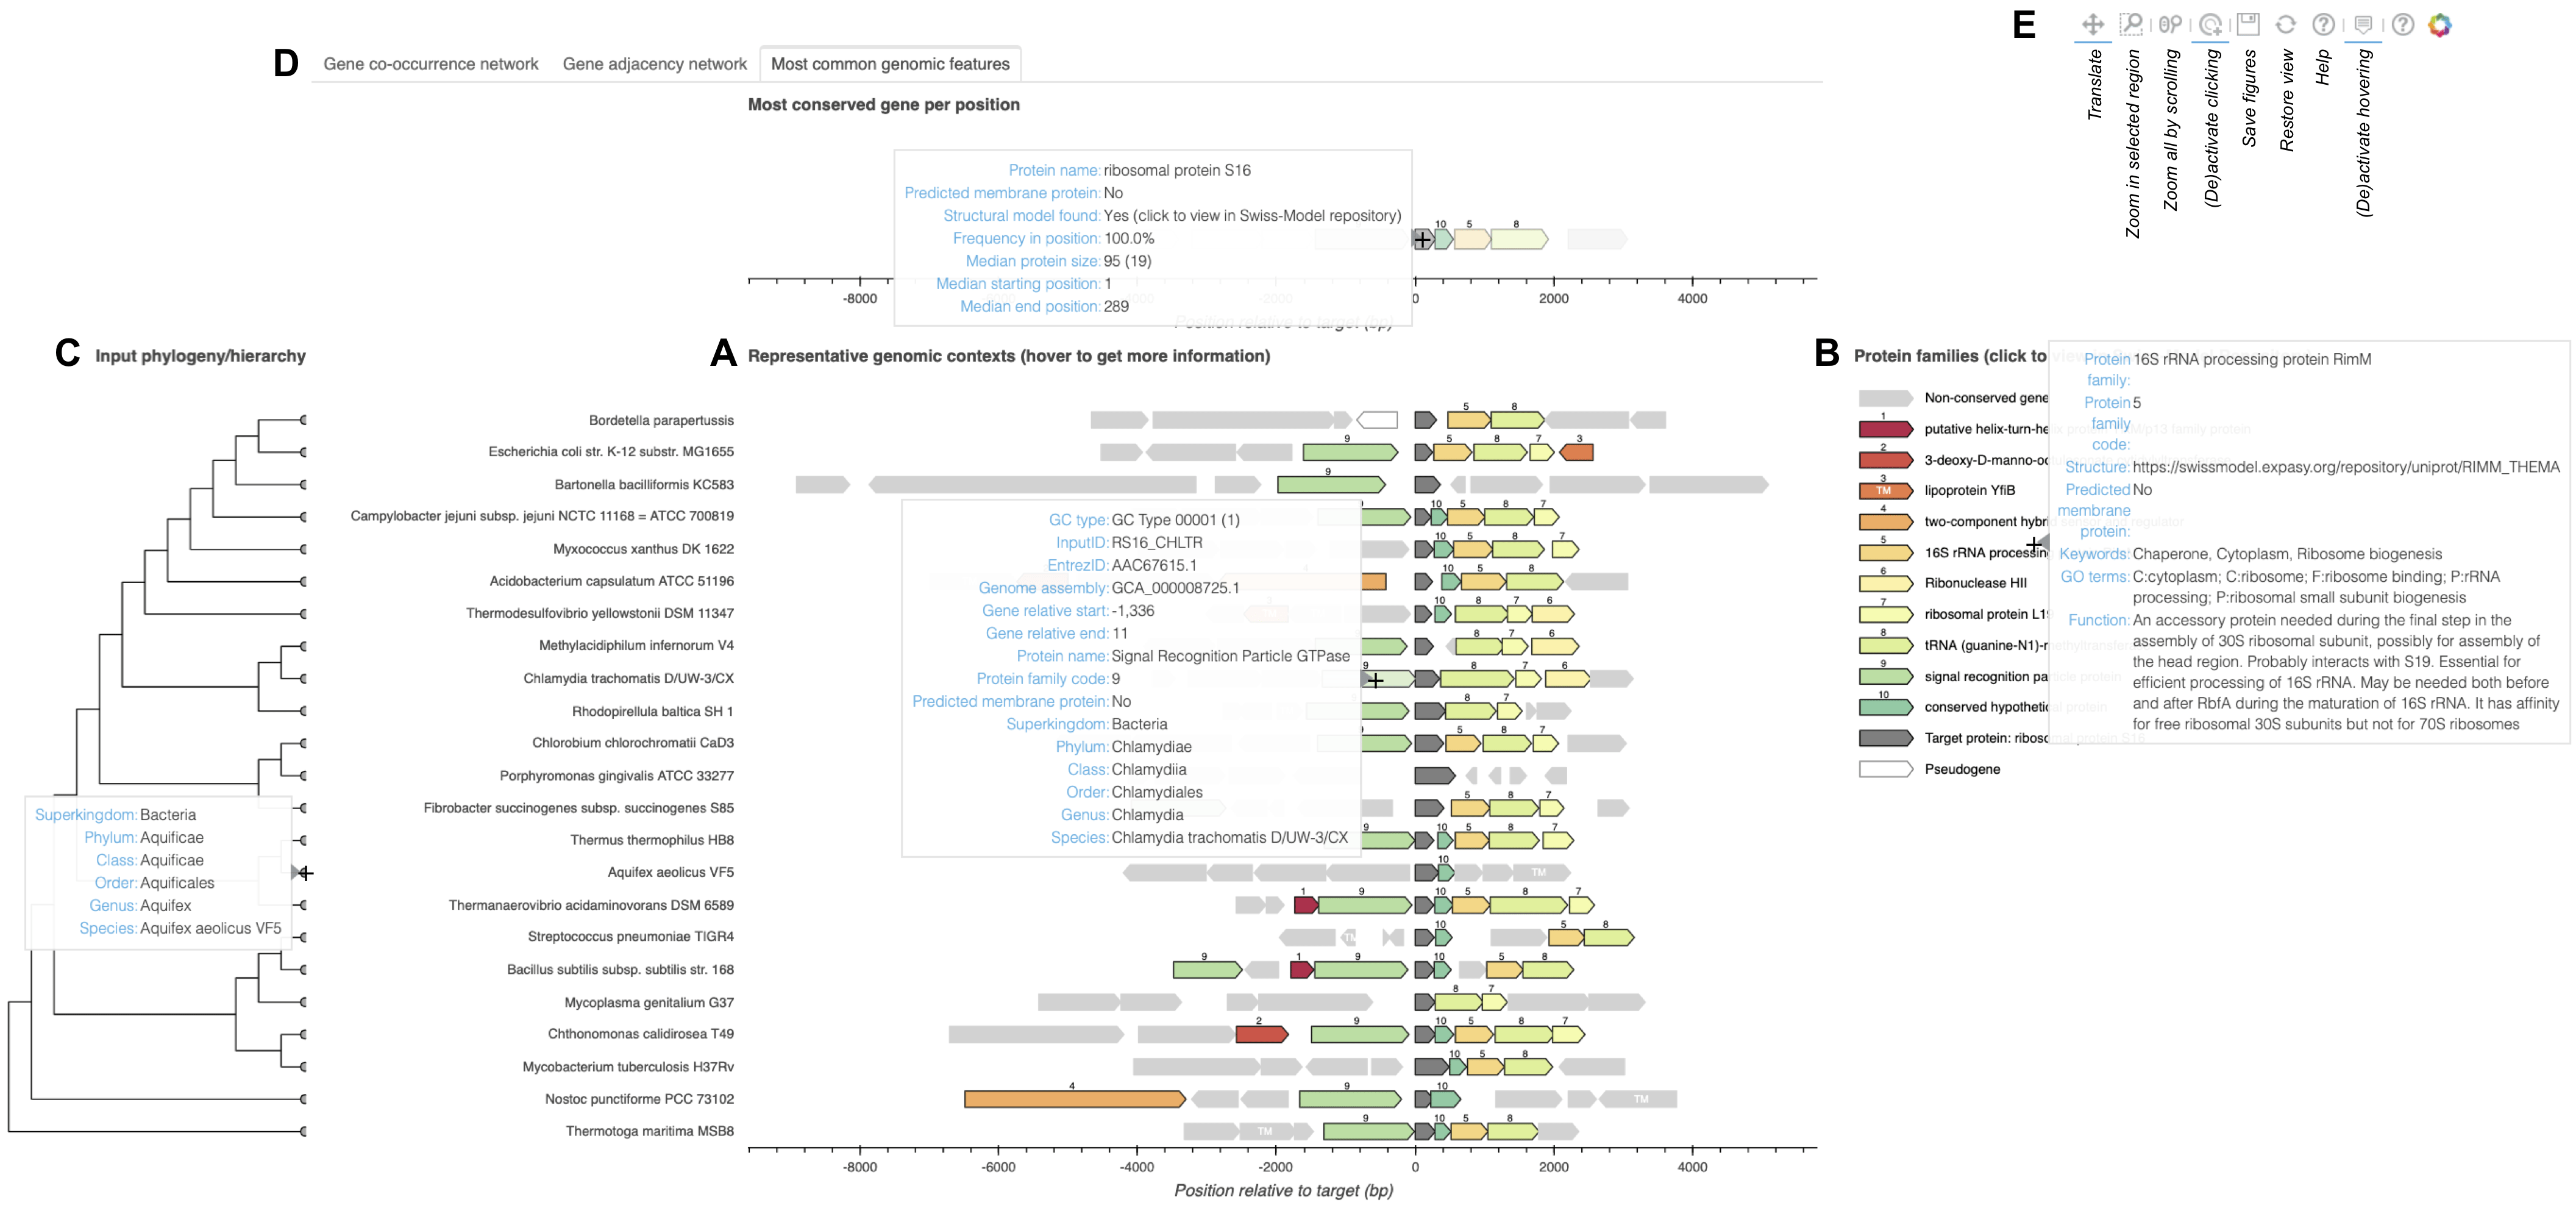
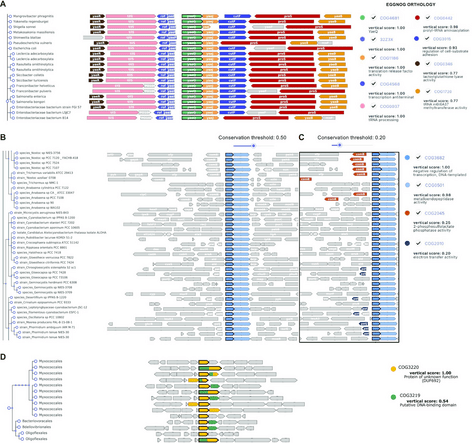
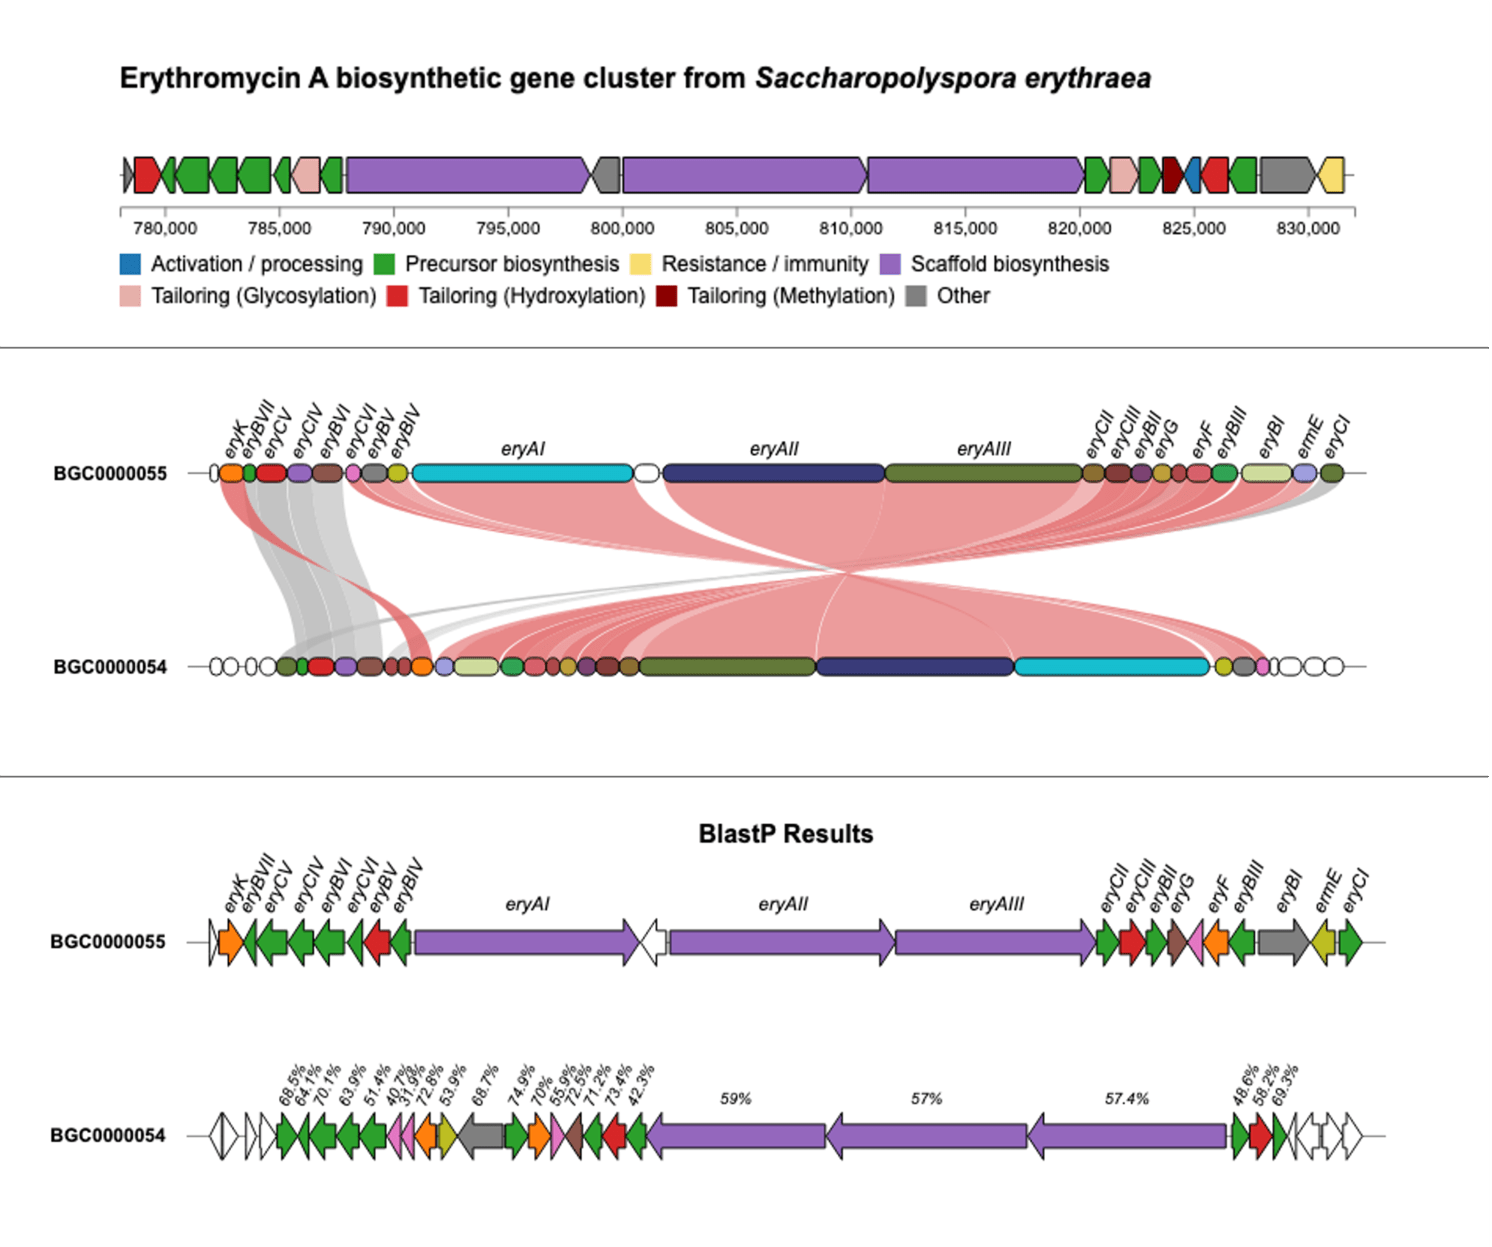
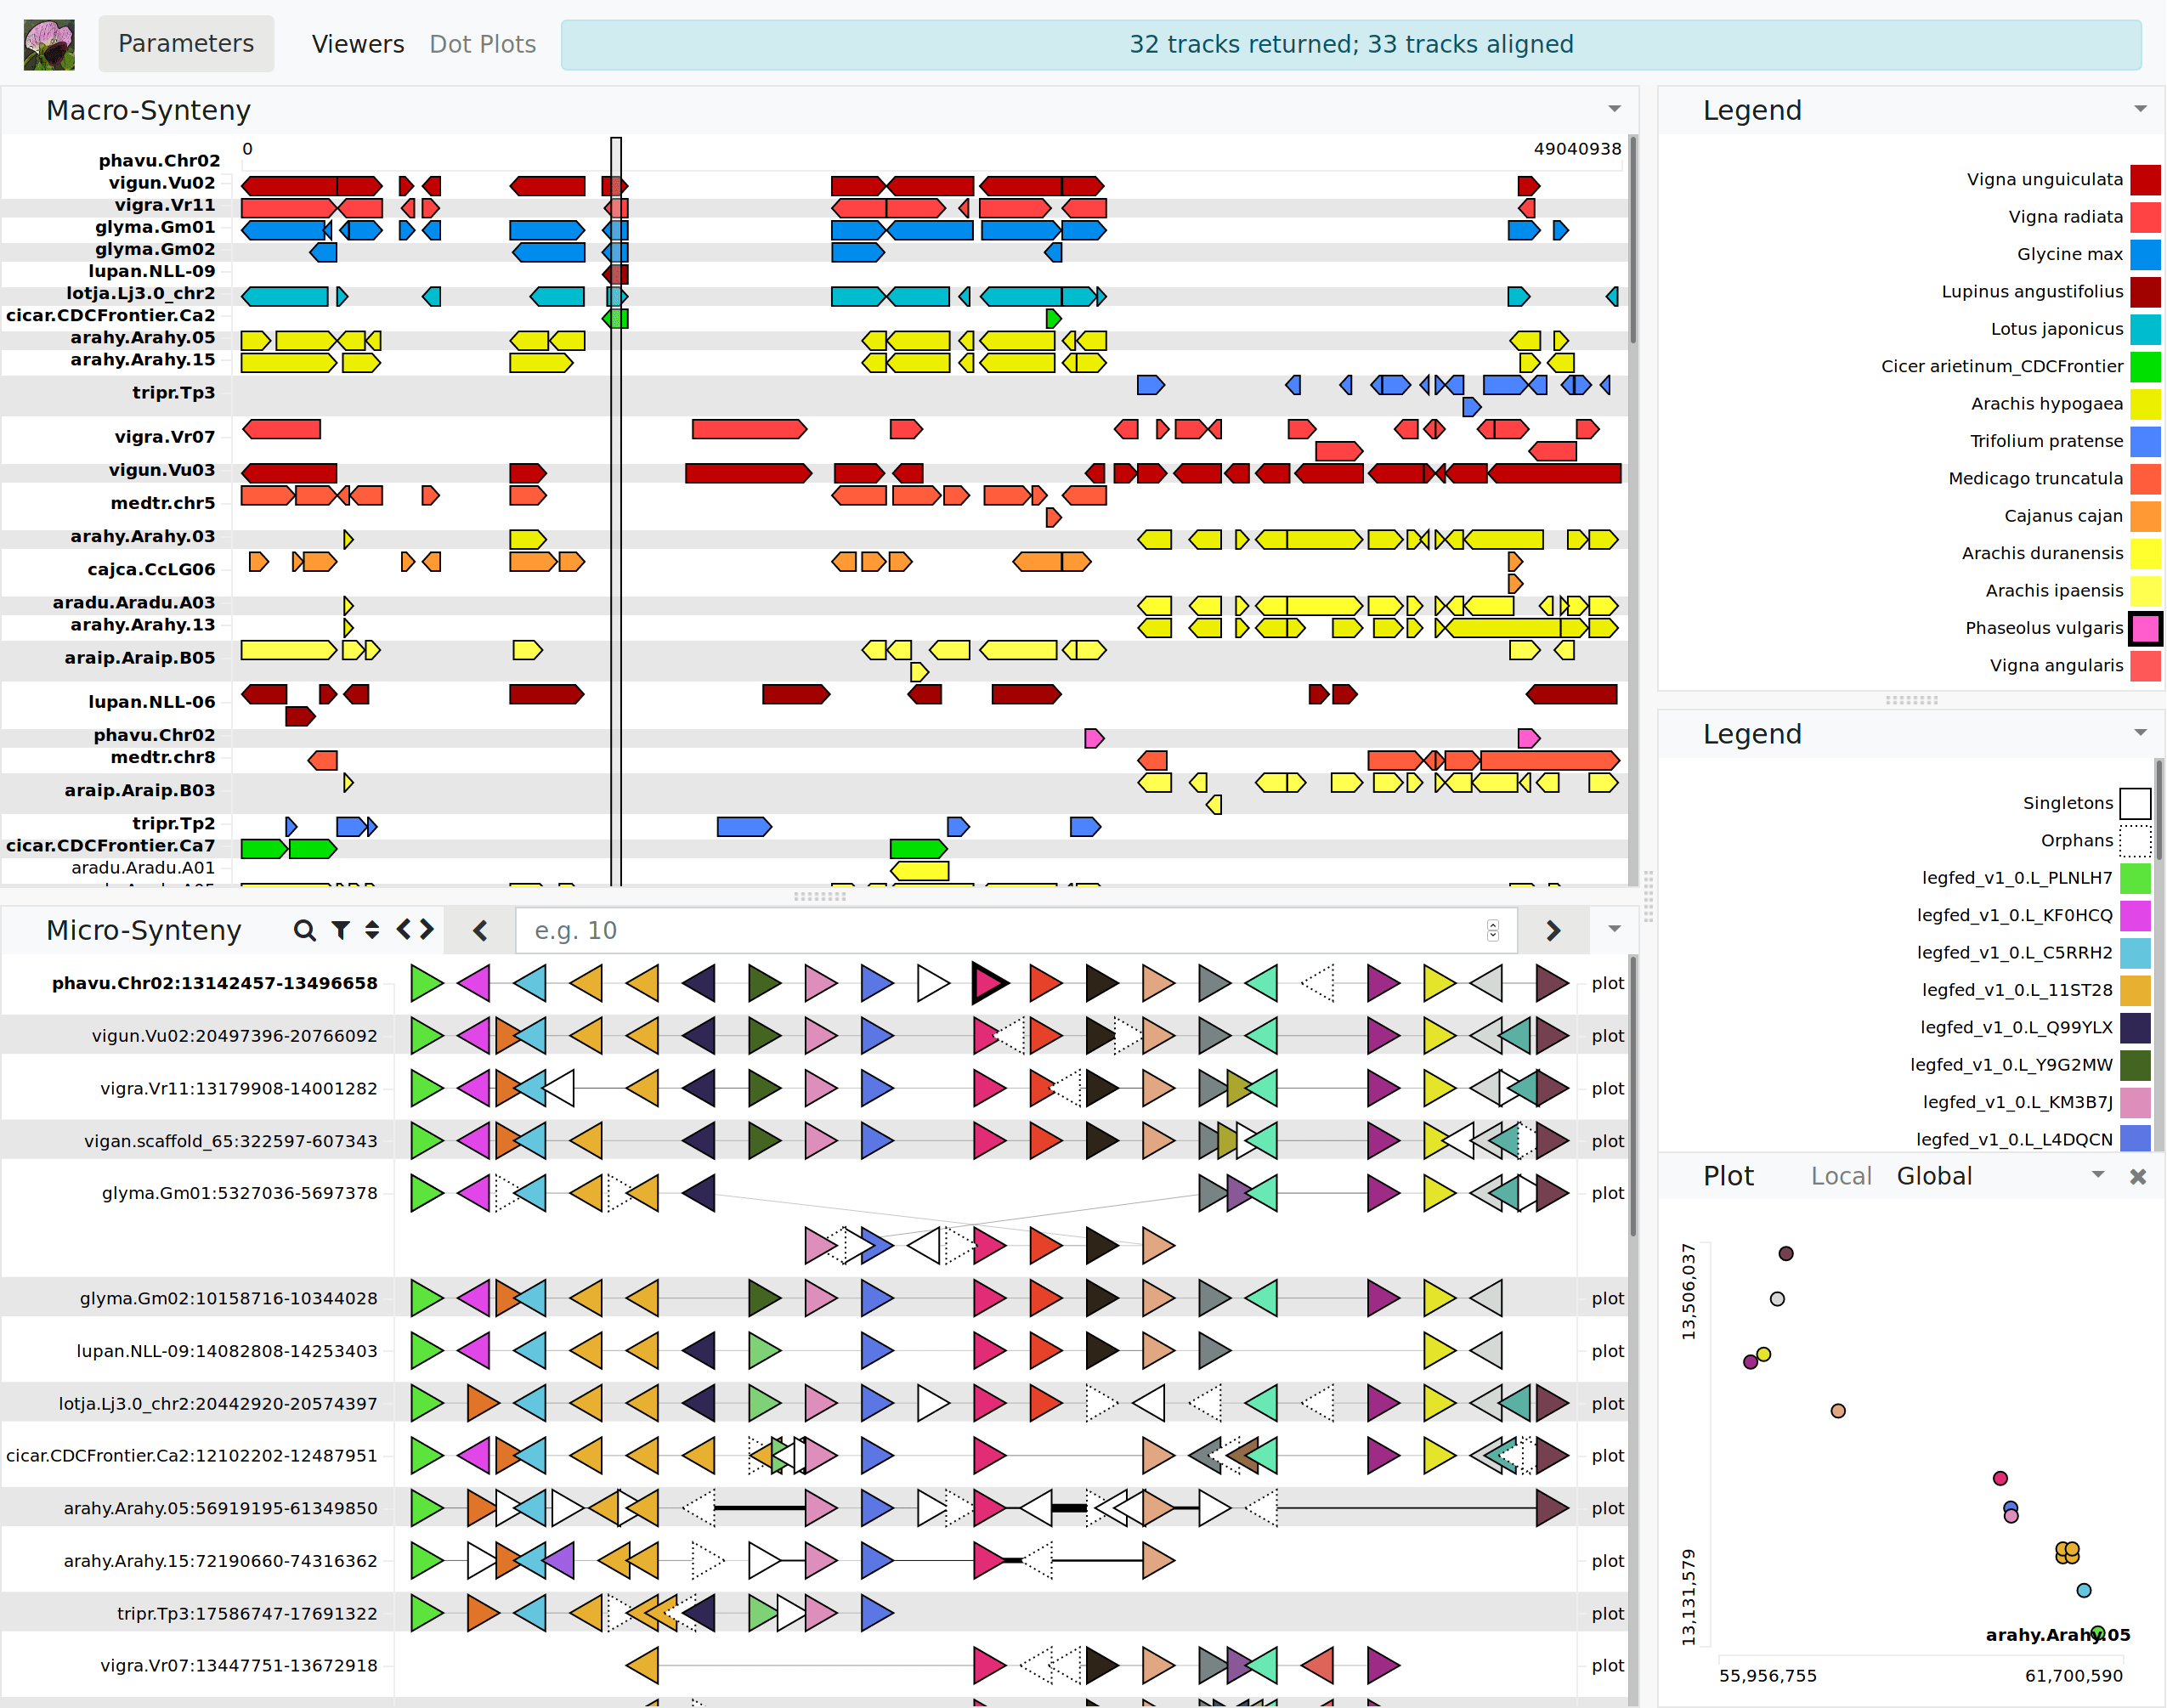
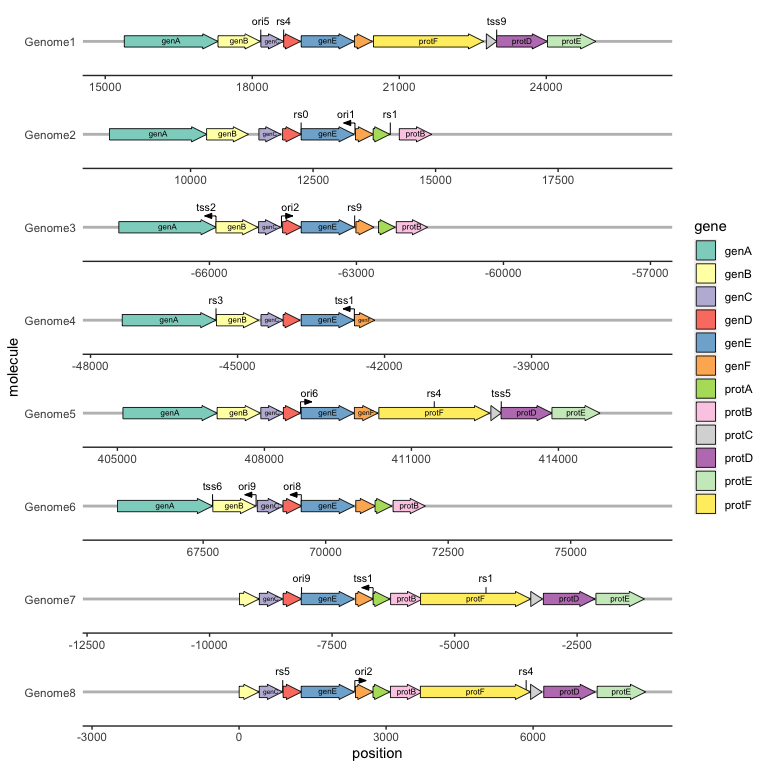
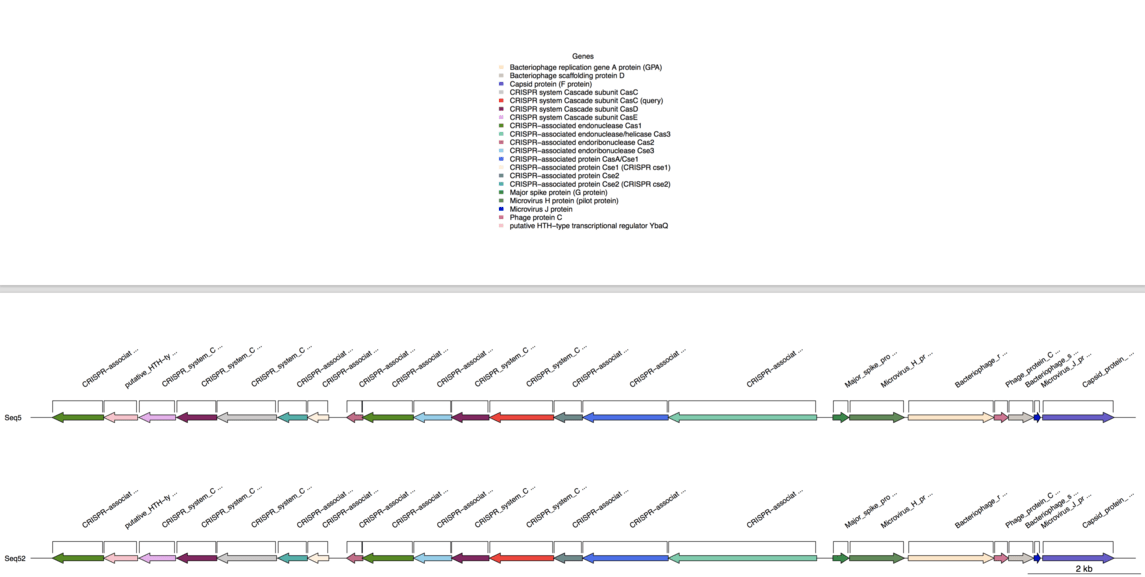
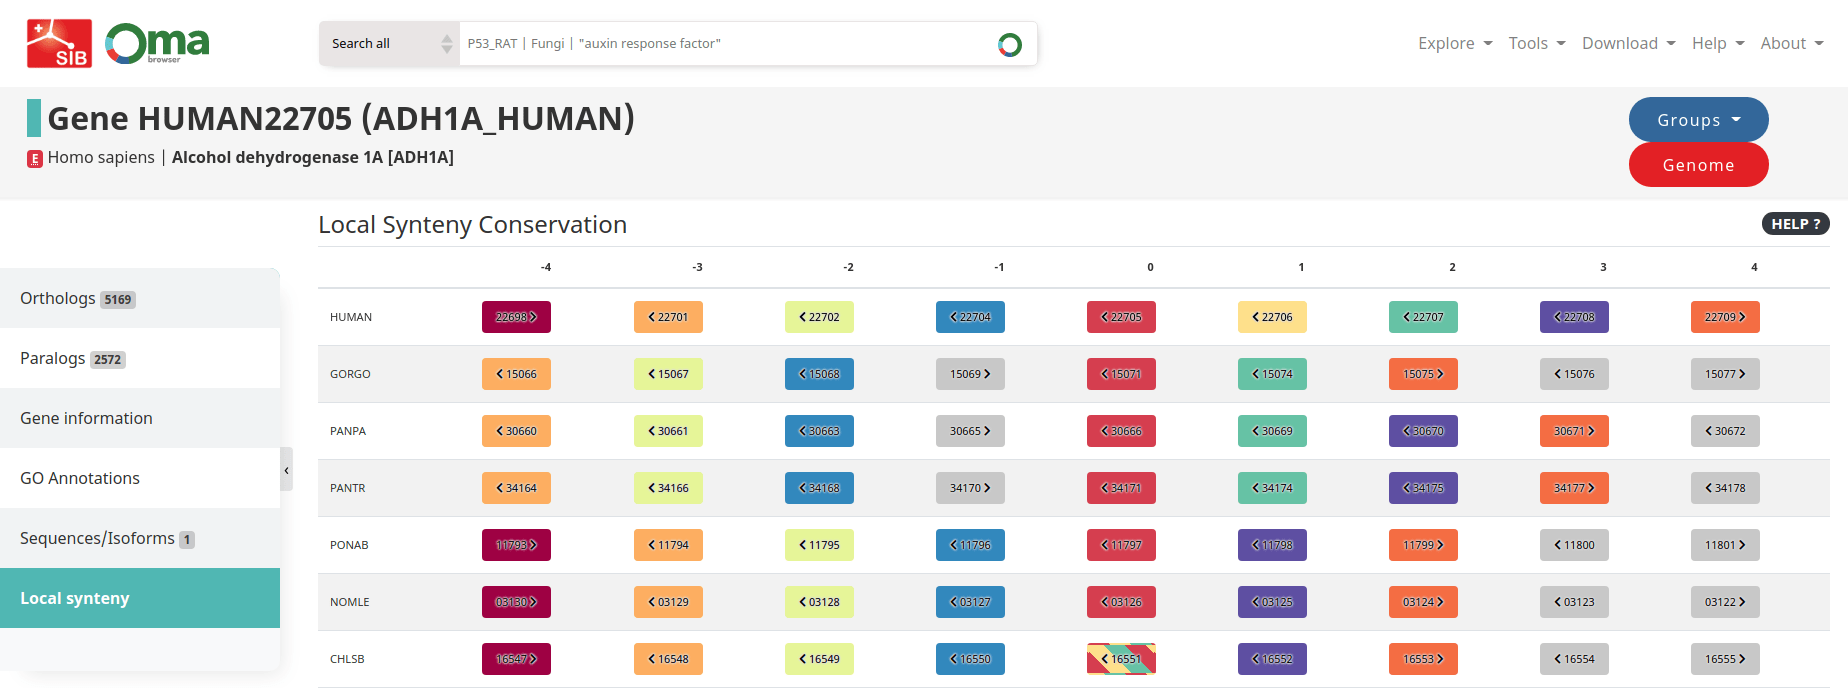
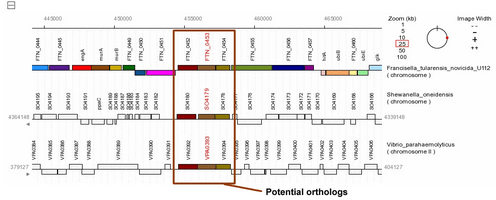
- Apollo (URL is an archive.org link) (img)
- Apollo aka WebApollo (img)
- D3GB (Live link http://d3gb.usal.es/docs/HumanGenomeBrowser/index.html?r=12:121113963-121213963 doesn't work anymore) (img)
- ExonIntron (img)
- FeatureViewer (img)
- Geneviz (img)
- GenomeTools (img)
- gff2ps (Used to make original figures for the human Celera genome) (img)
- ggtranscript (img)
- TnT (img)
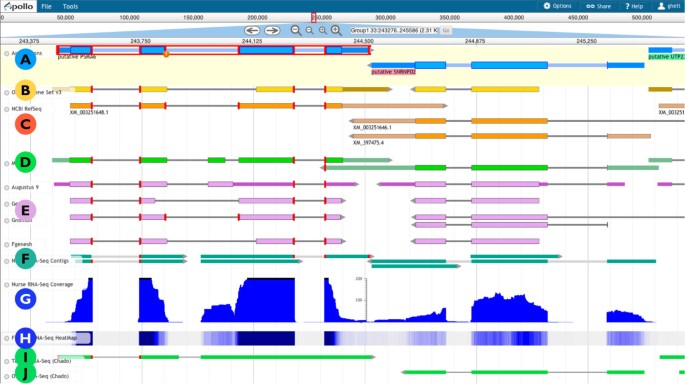
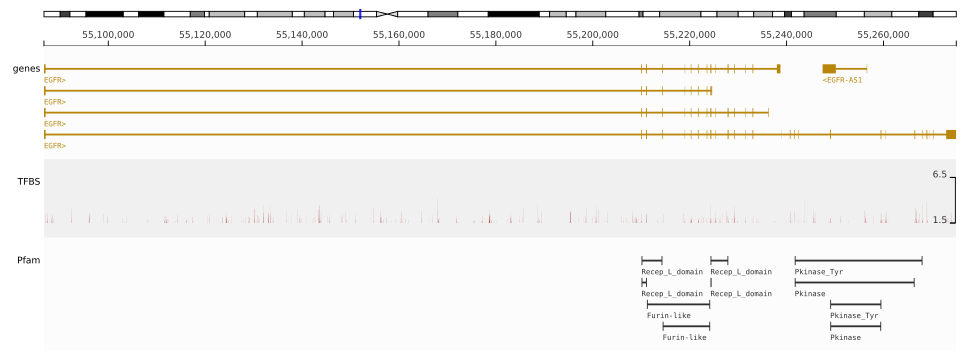
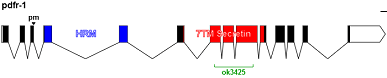
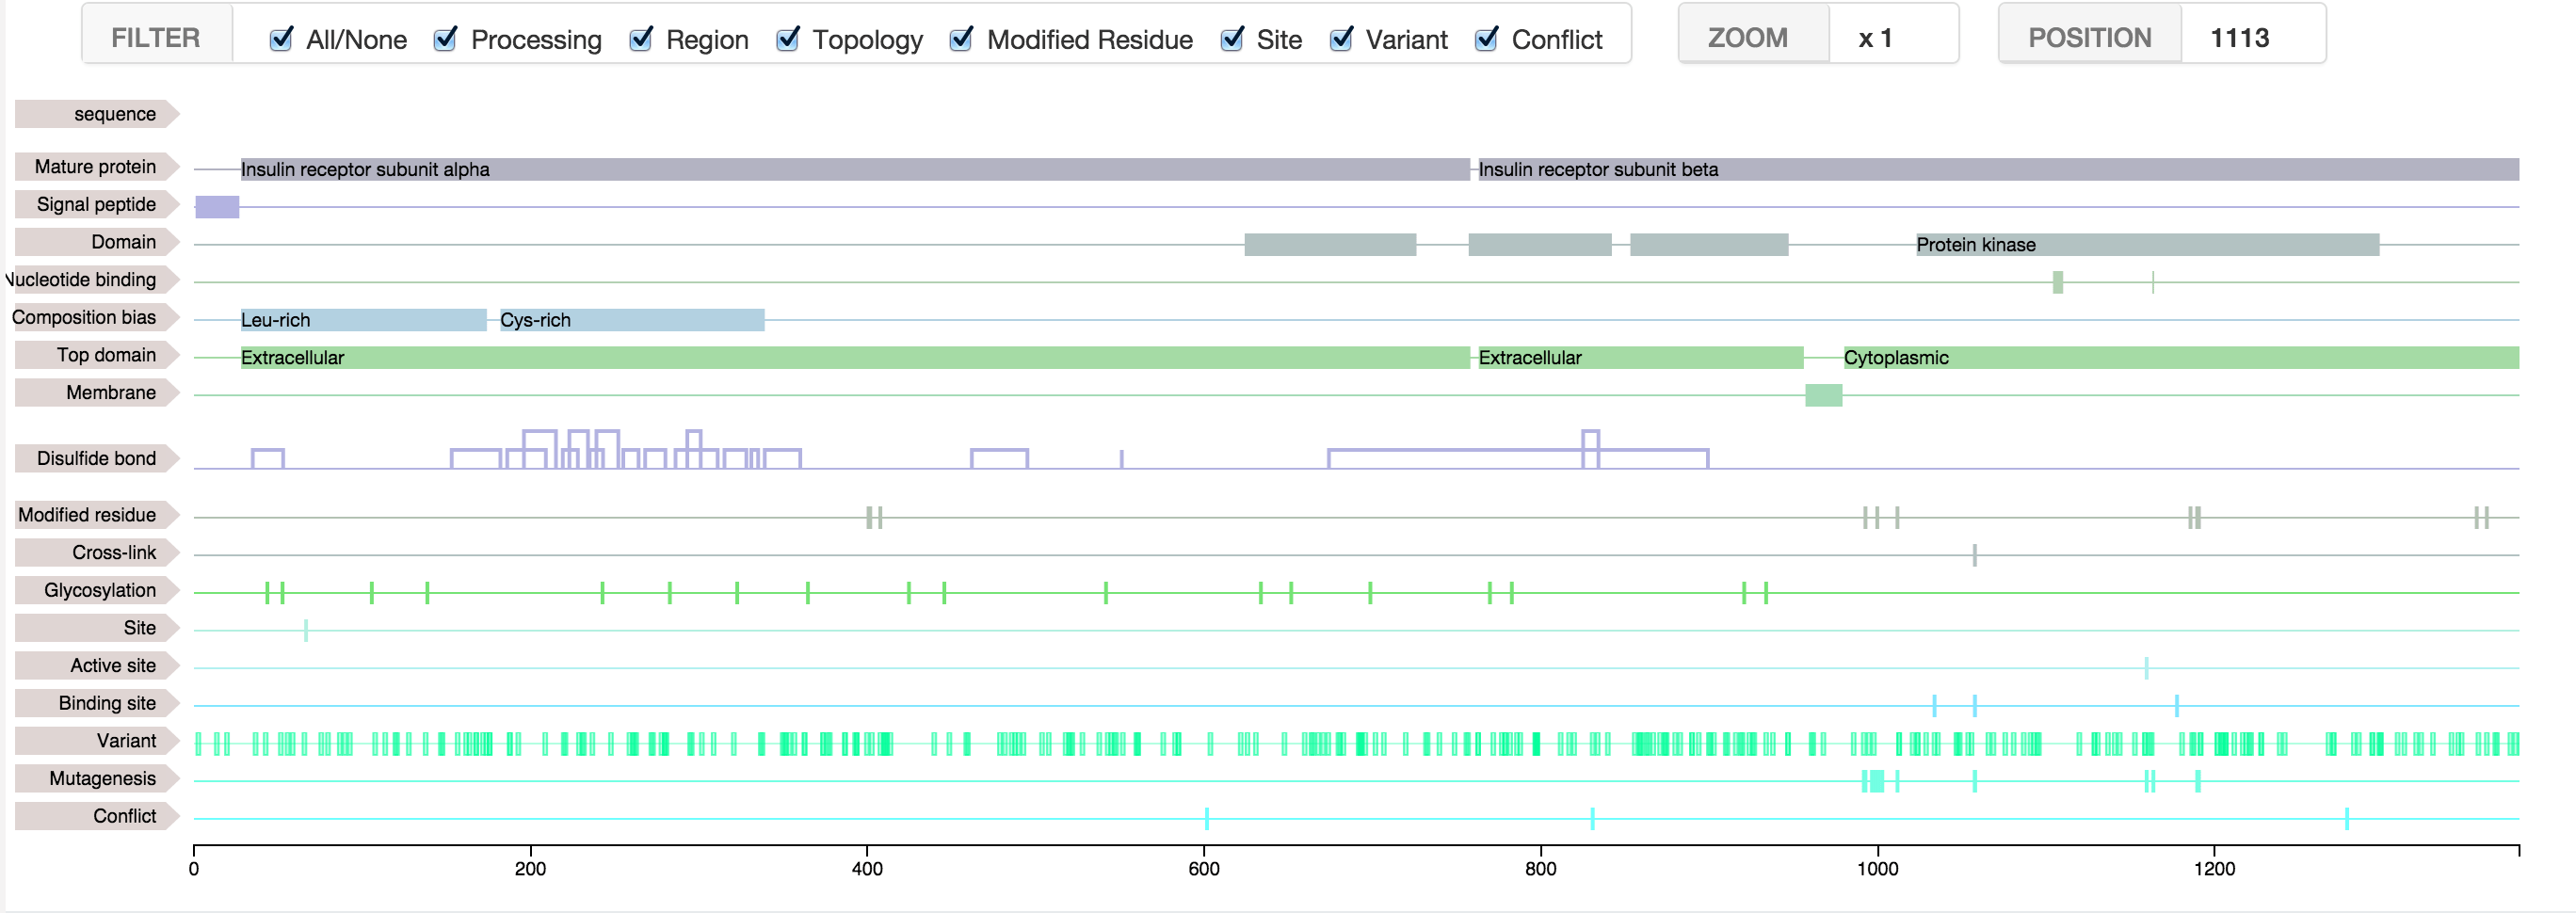
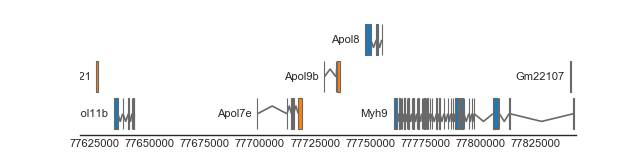
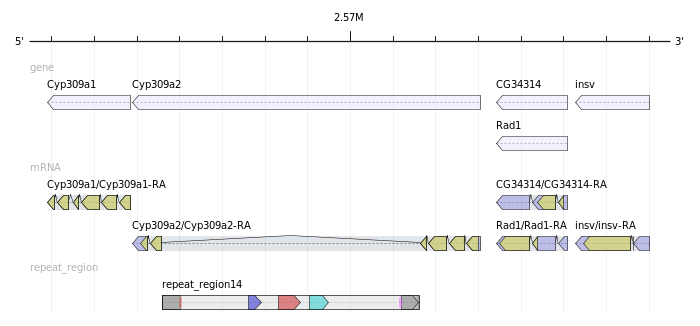
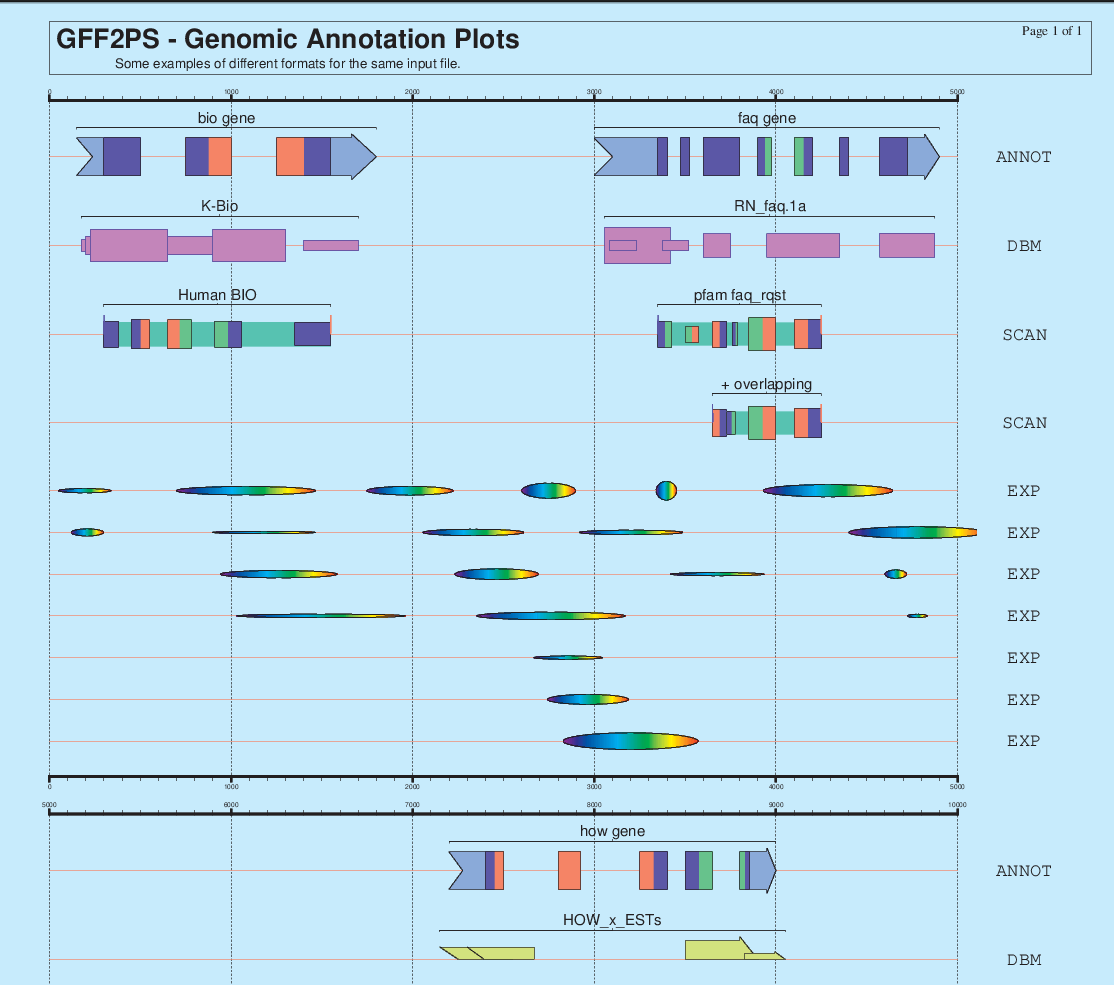
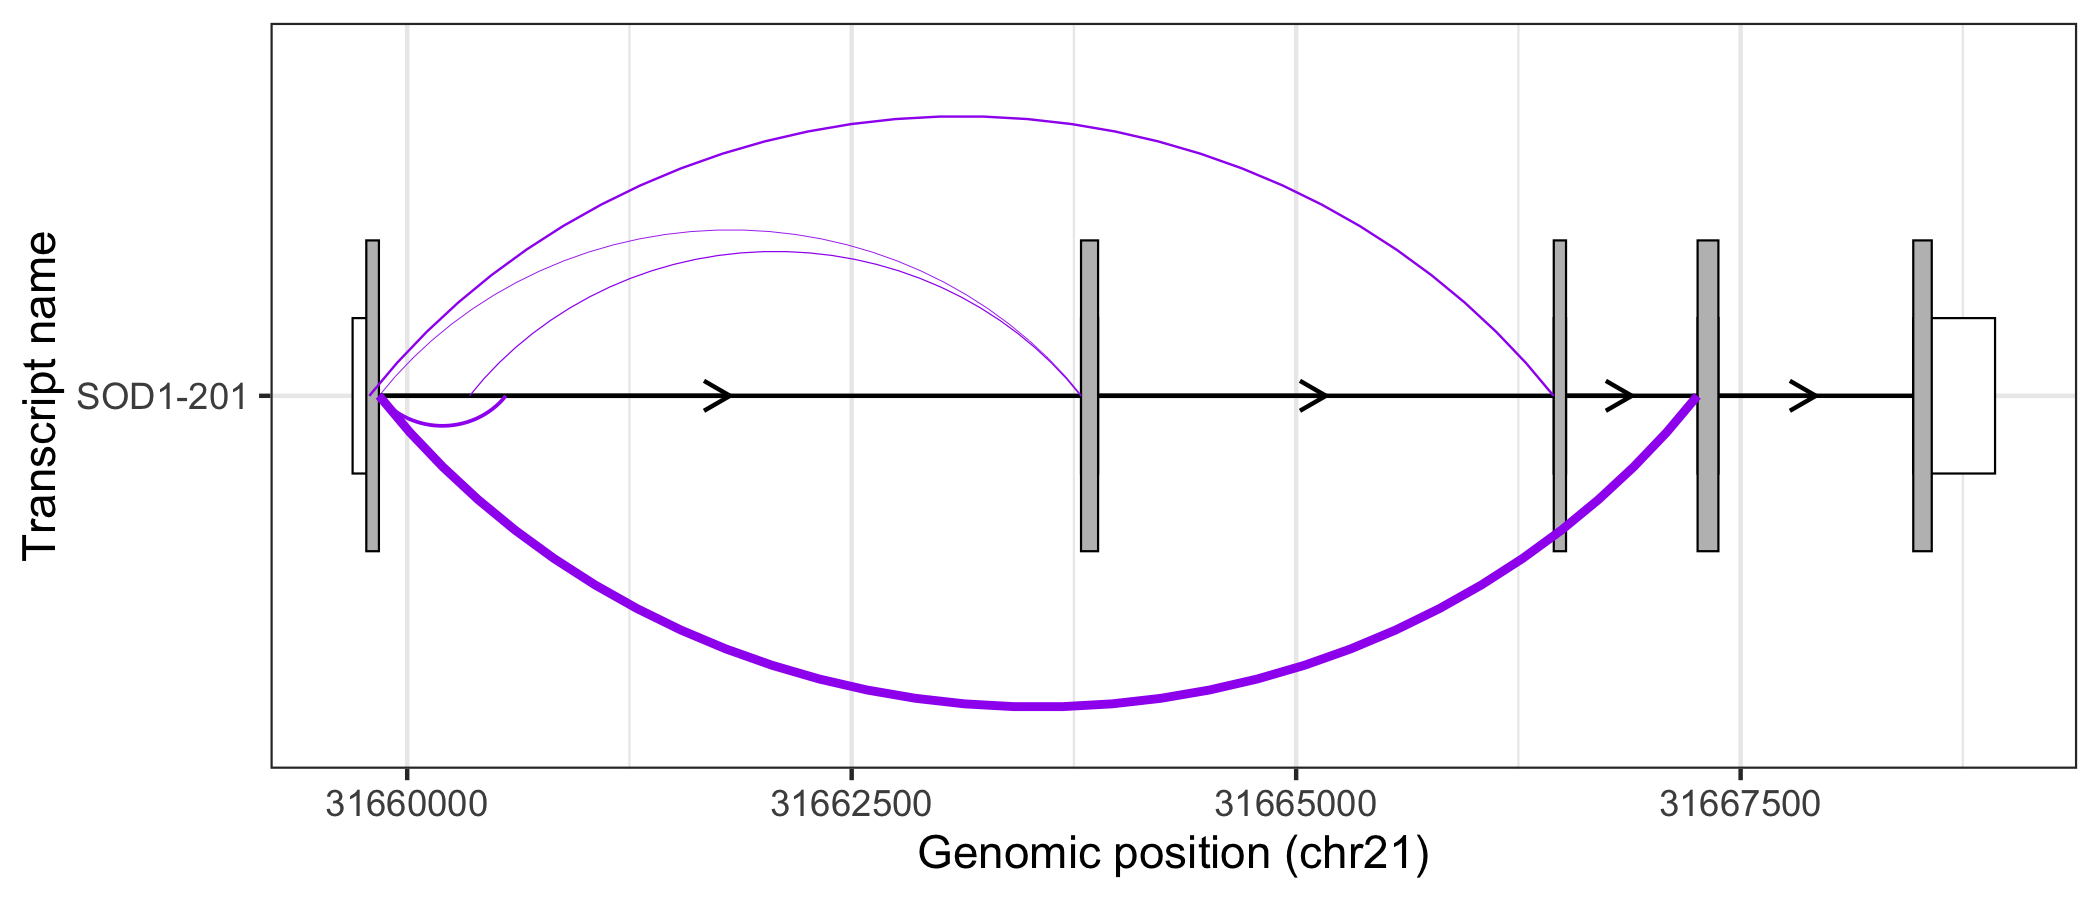
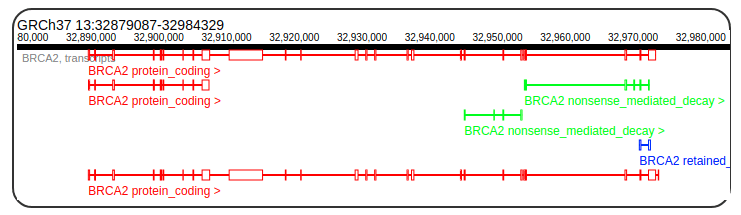
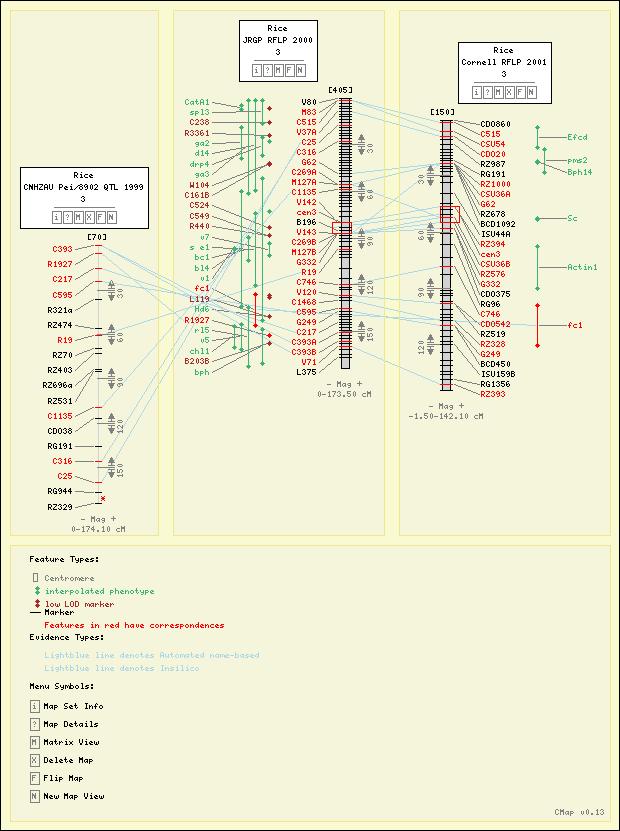
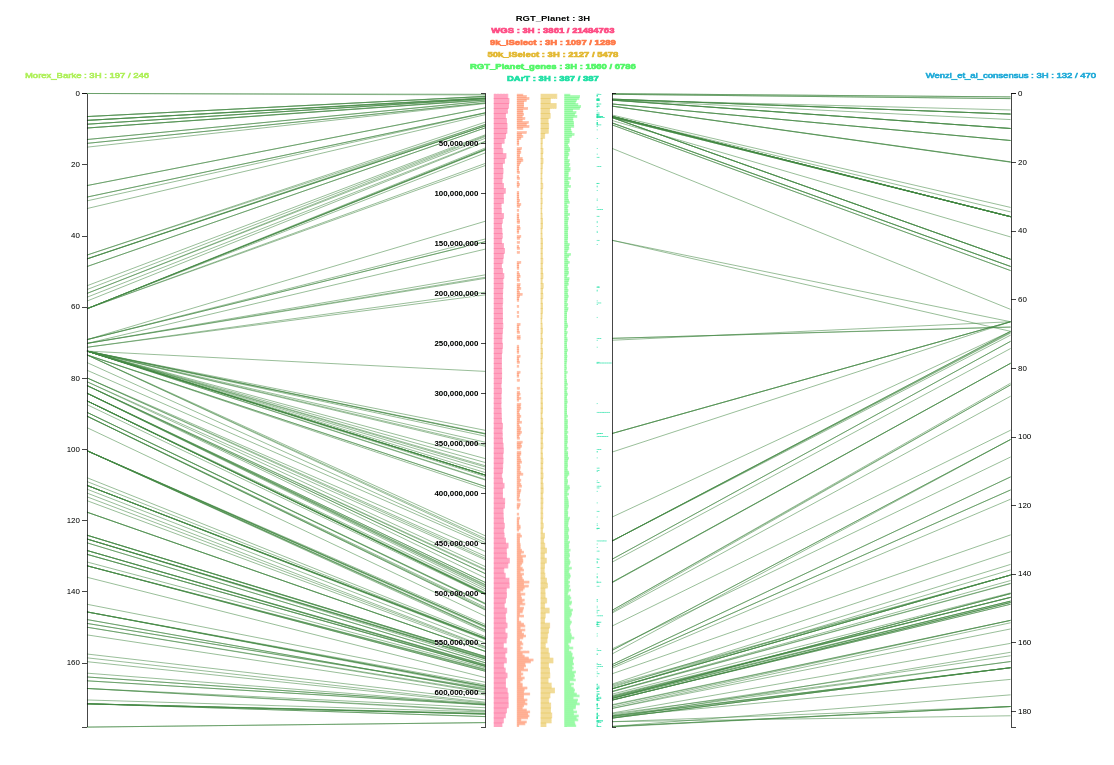
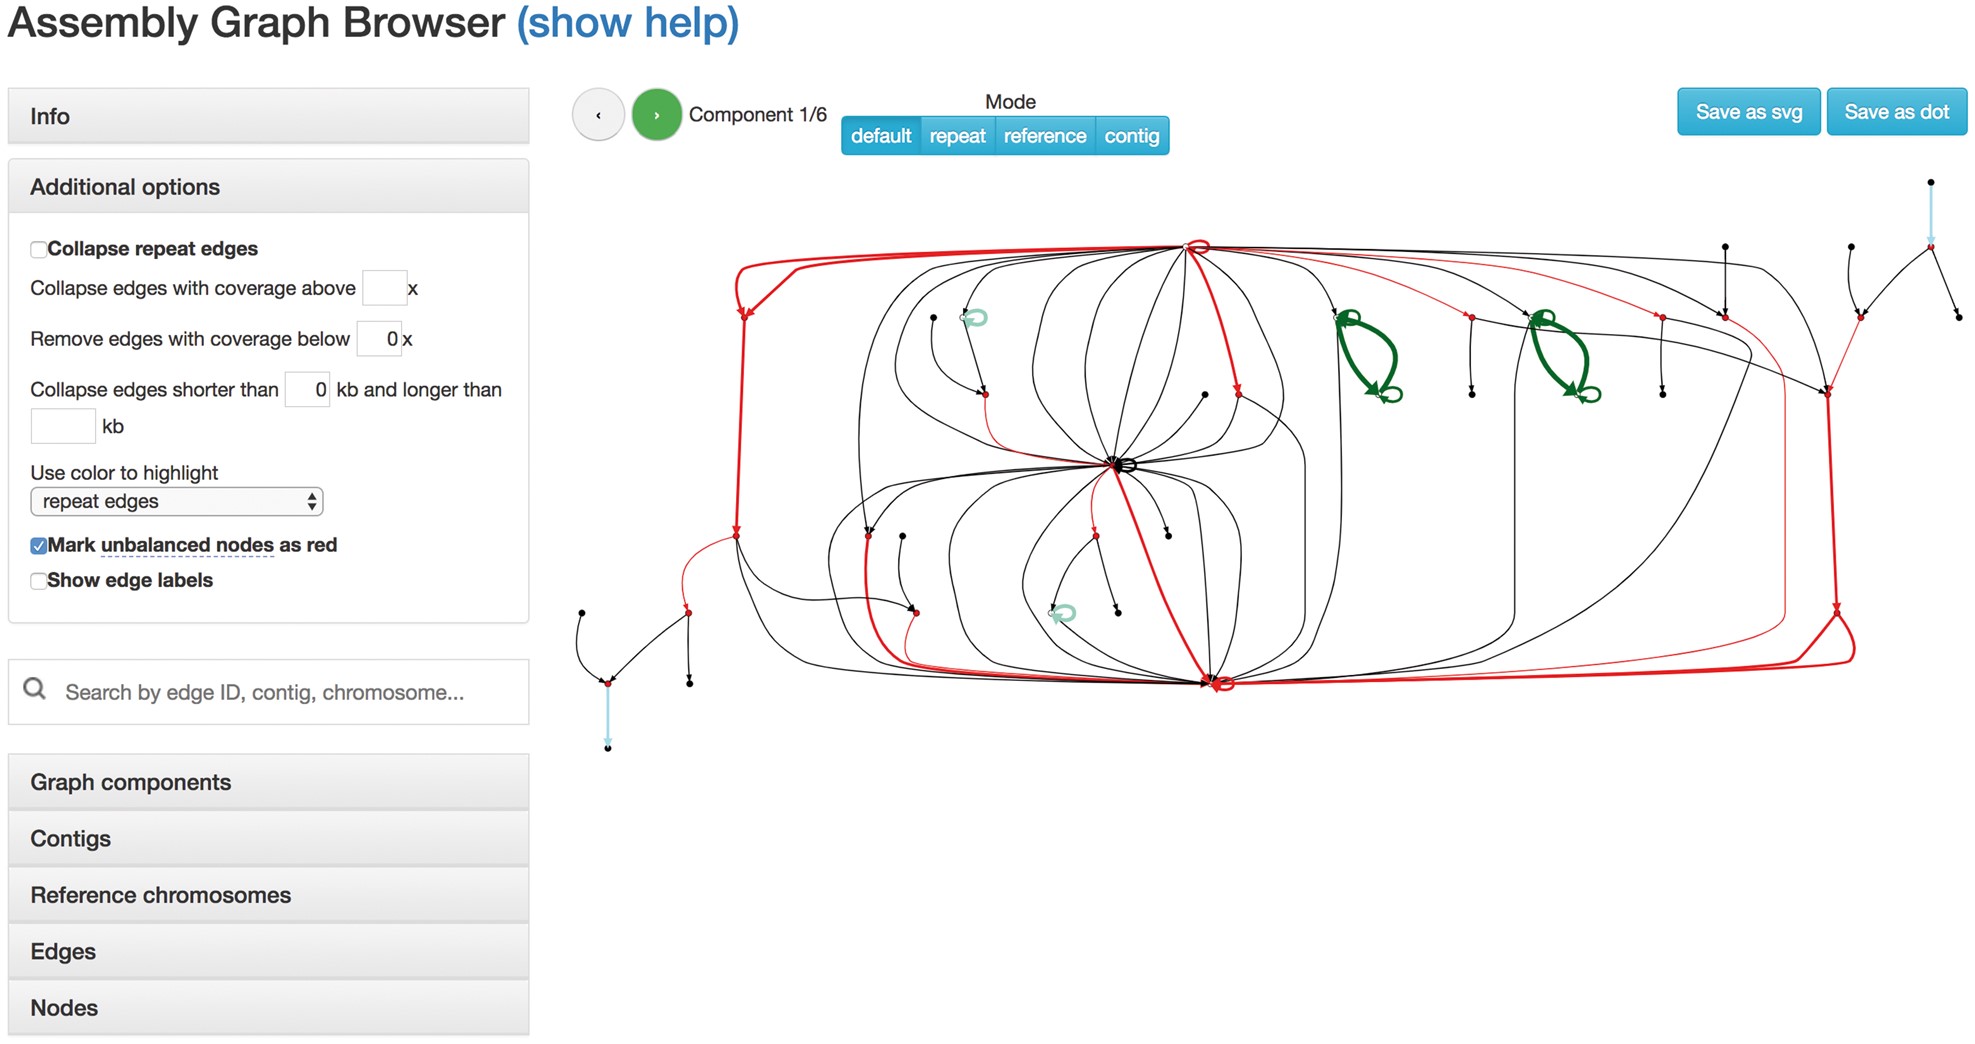
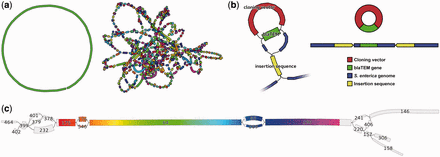
- AGB assembly graph browser (img)
- Bandage (See also BandageNG https://github.com/asl/BandageNG) (img)
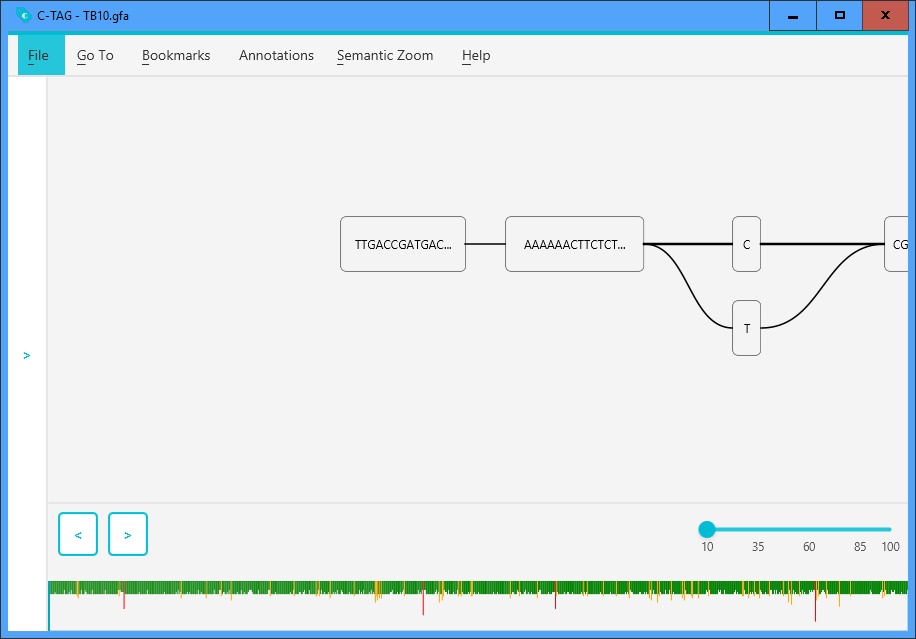
- ctag (See also hygene https://github.com/ProgrammingLife2017/hygene) (img)
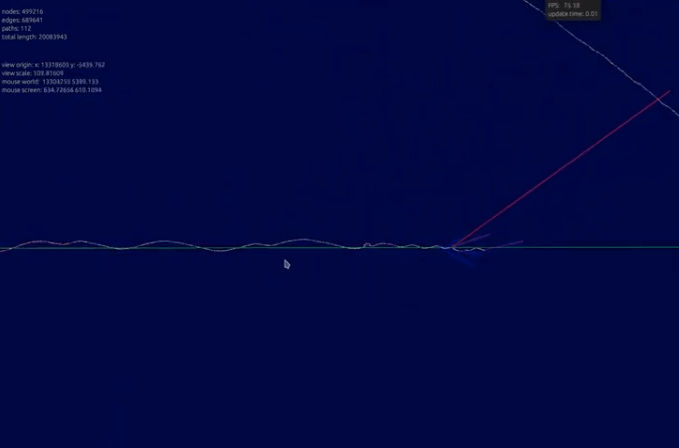
- gfaestus (See demo video displaying GFF3 annotations on graph https://www.youtube.com/watch?v=A-HnKXIrJl4) (img)
- gfalook (See also odgi viz) (img)
- GfaViz (img)
- graphgenomeviewer (img)
- IGGE (Not open source) (img)
- MoMi-G (img)
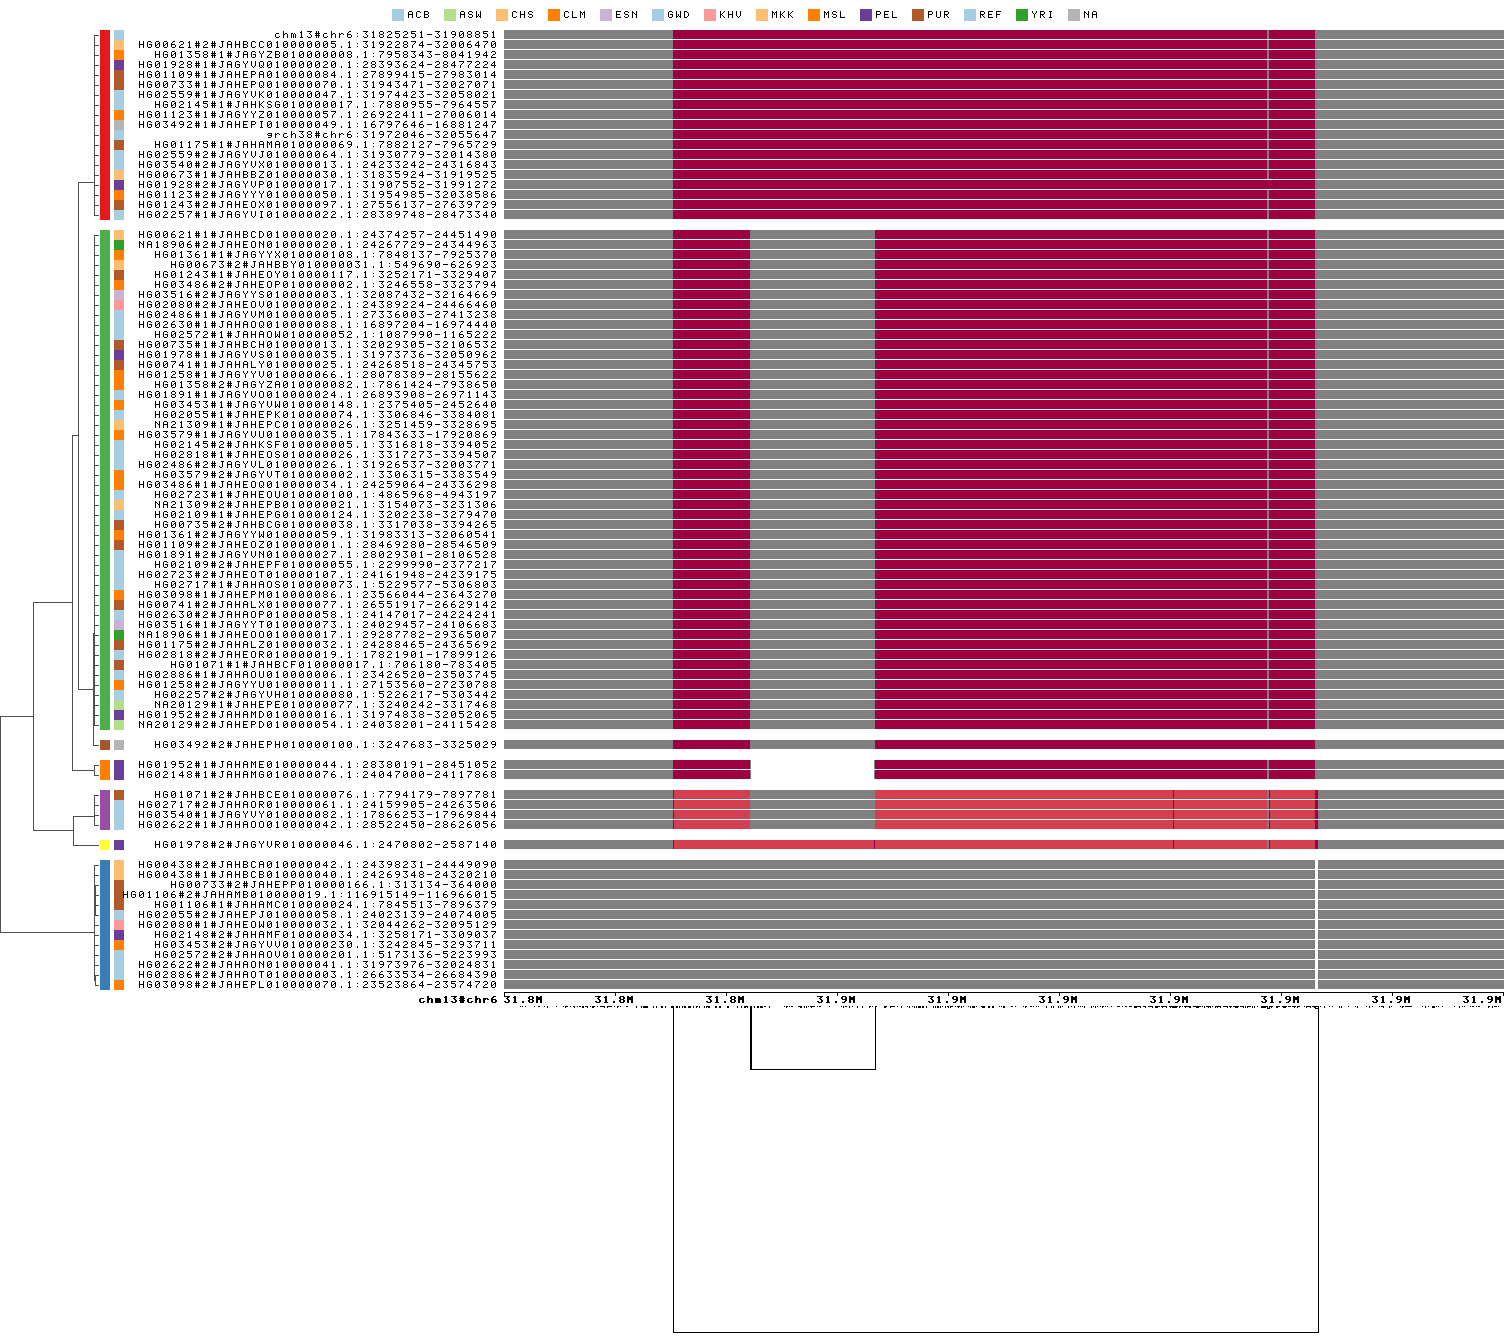
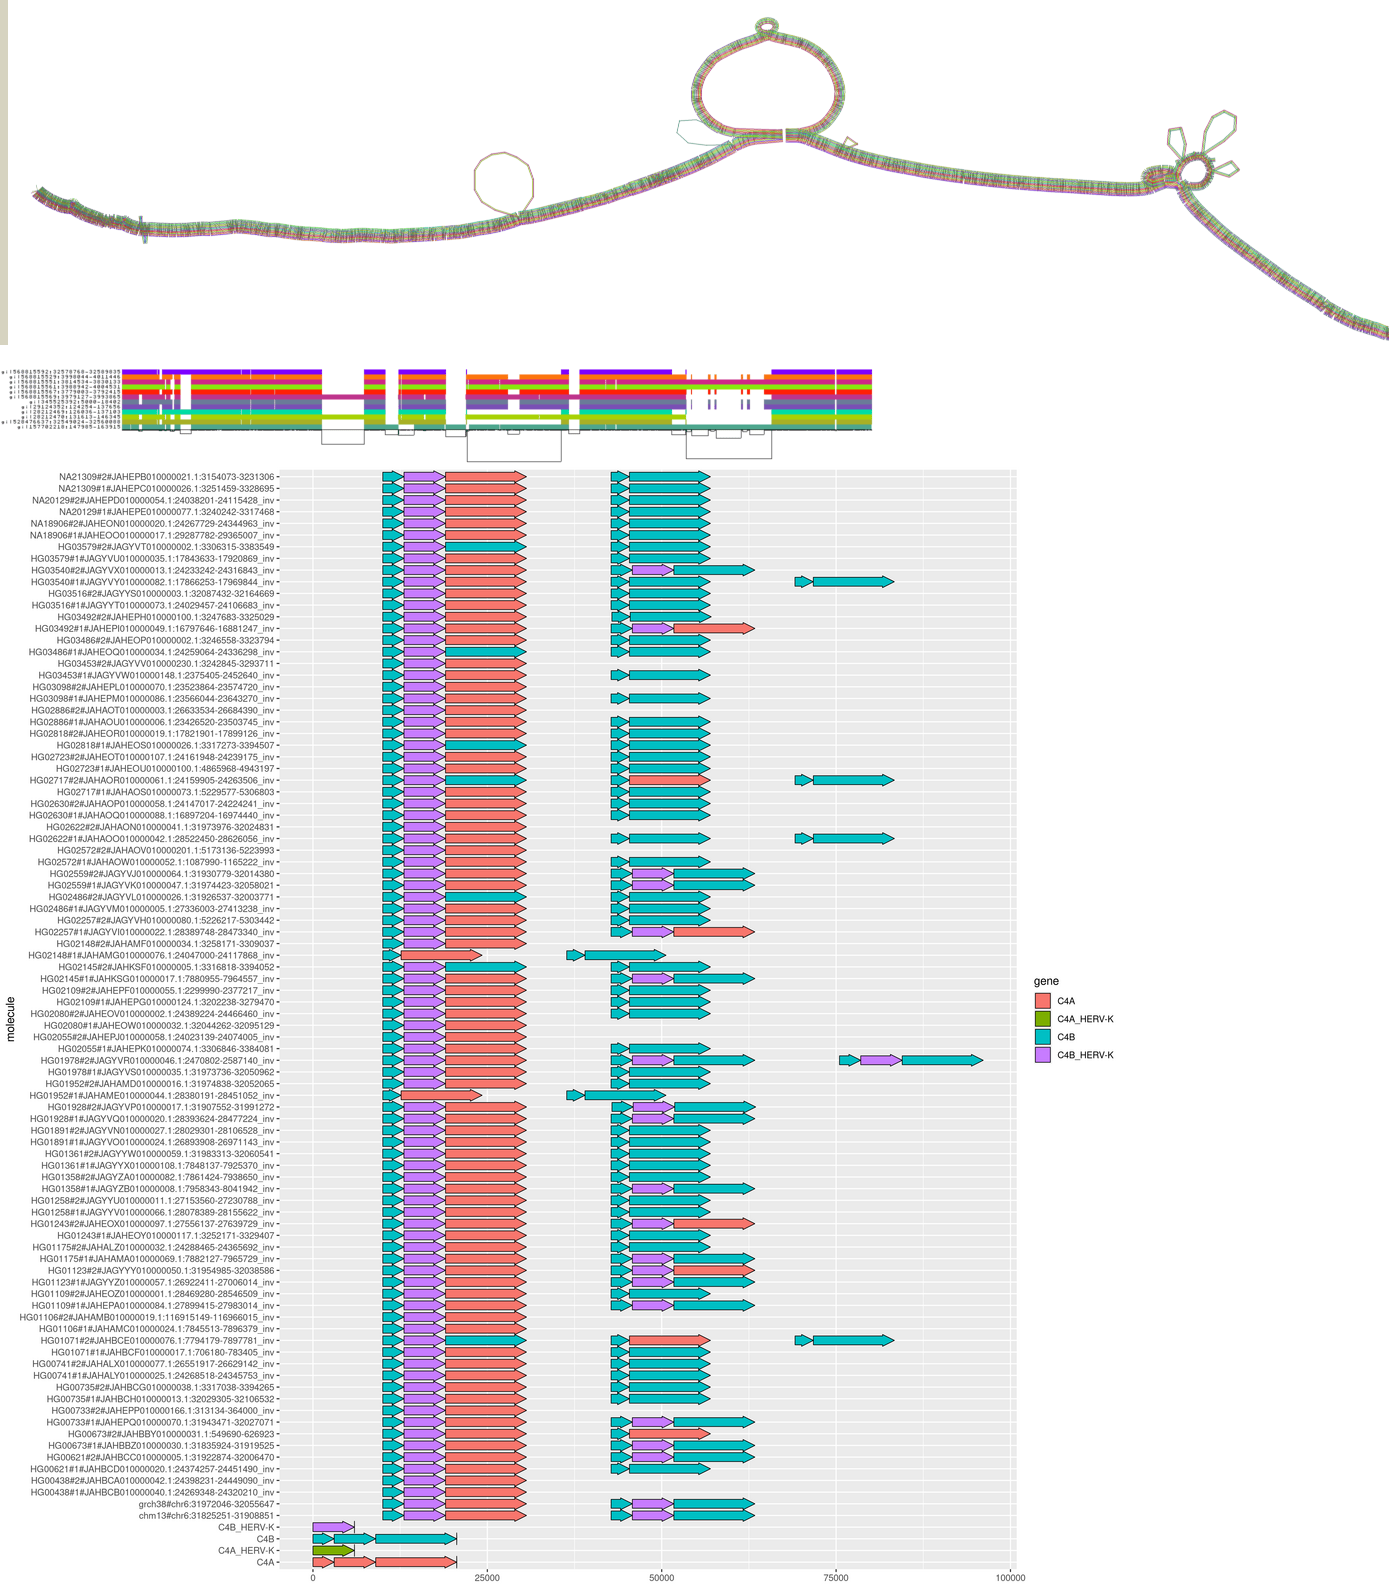
- odgi draw + odgi viz + odgi inject (Example from https://github.com/pangenome/pggb, see also gene arrow map https://odgi.readthedocs.io/en/latest/rst/tutorials/injecting_gene_arrows.html) (img)
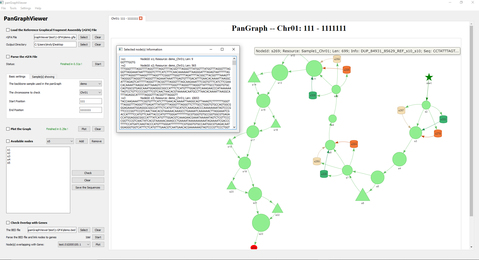
- panGraphViewer (img)
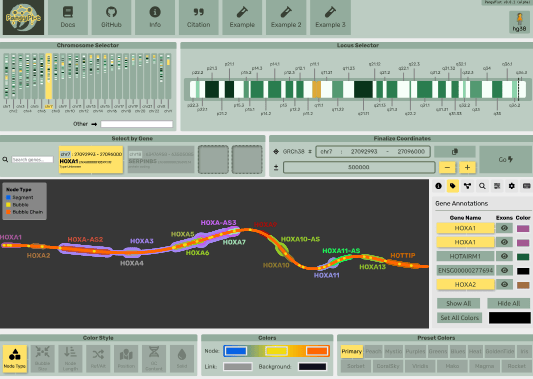
- PangyPlot (img)
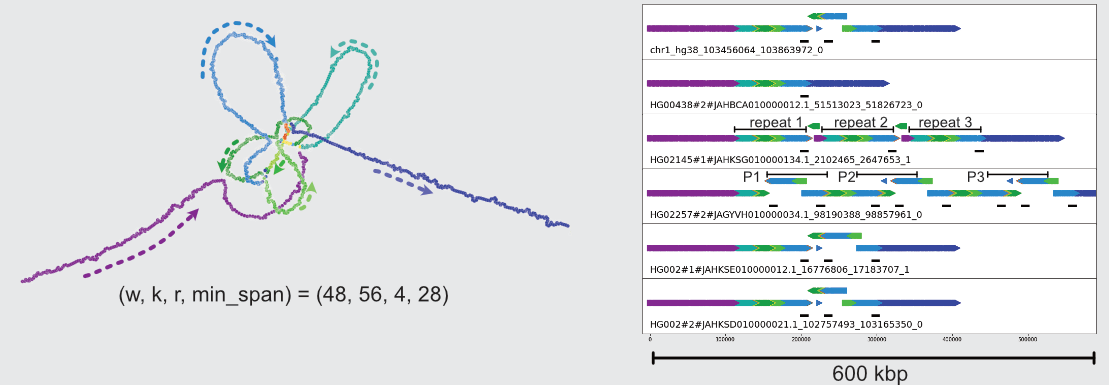
- PGR-TK (img)
- pgv (graph tool) (img)
- sequence tube map (img)
- SGTK (scaffold graph toolkit) (img)
- Shasta (Uses graphviz) (img)
- strangepg (img)
- VAG (img)
- VRPG (img)
- waragraph (Deployed to the web via wasm) (img)
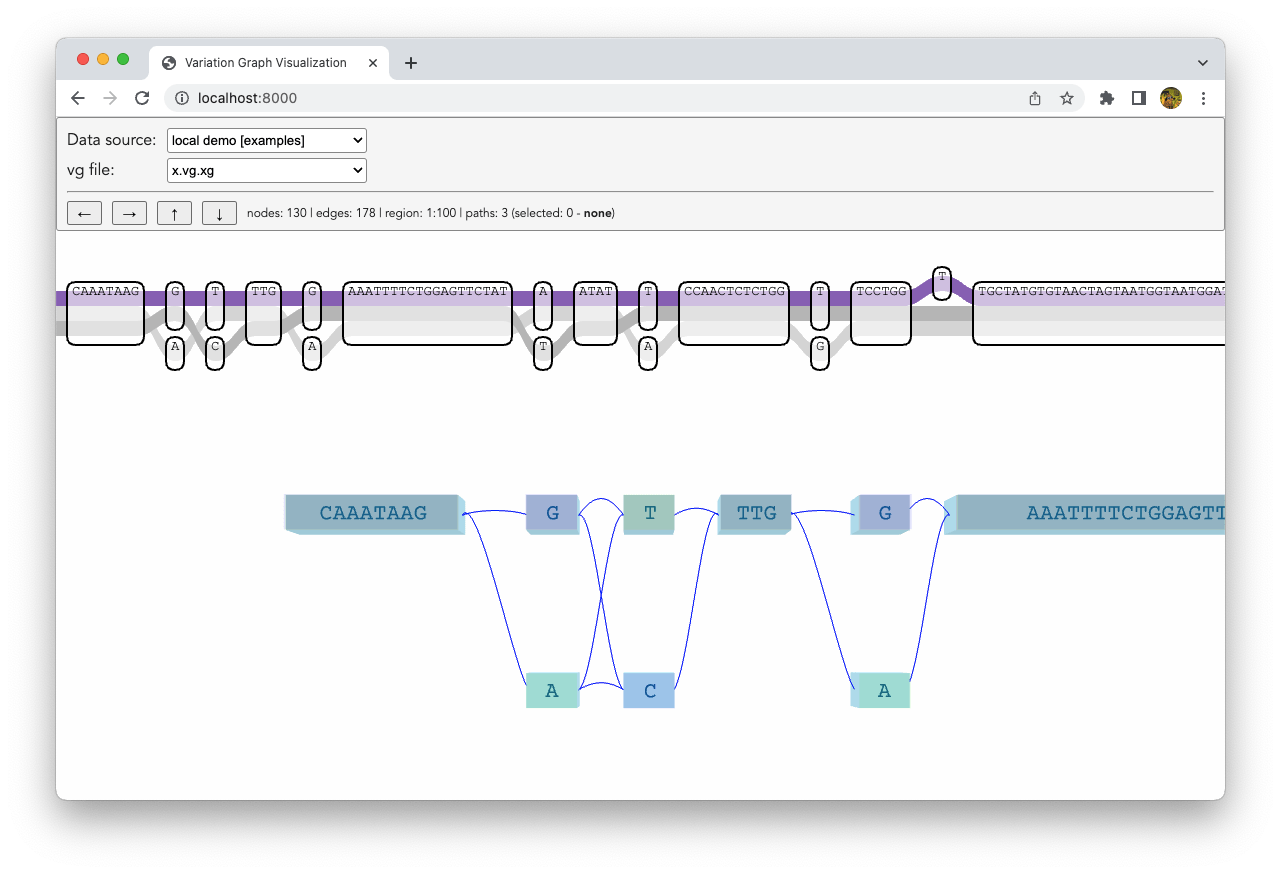
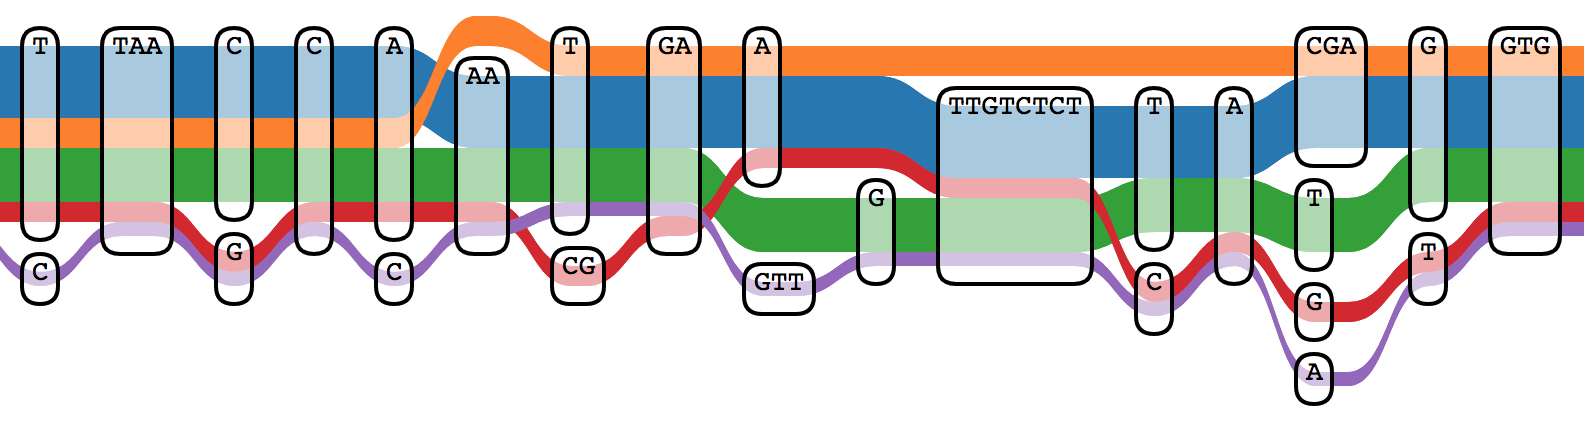
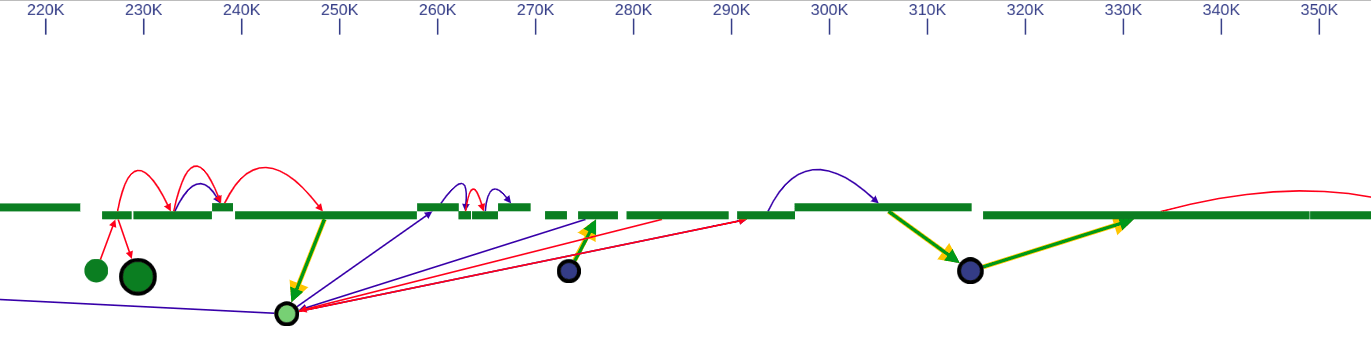
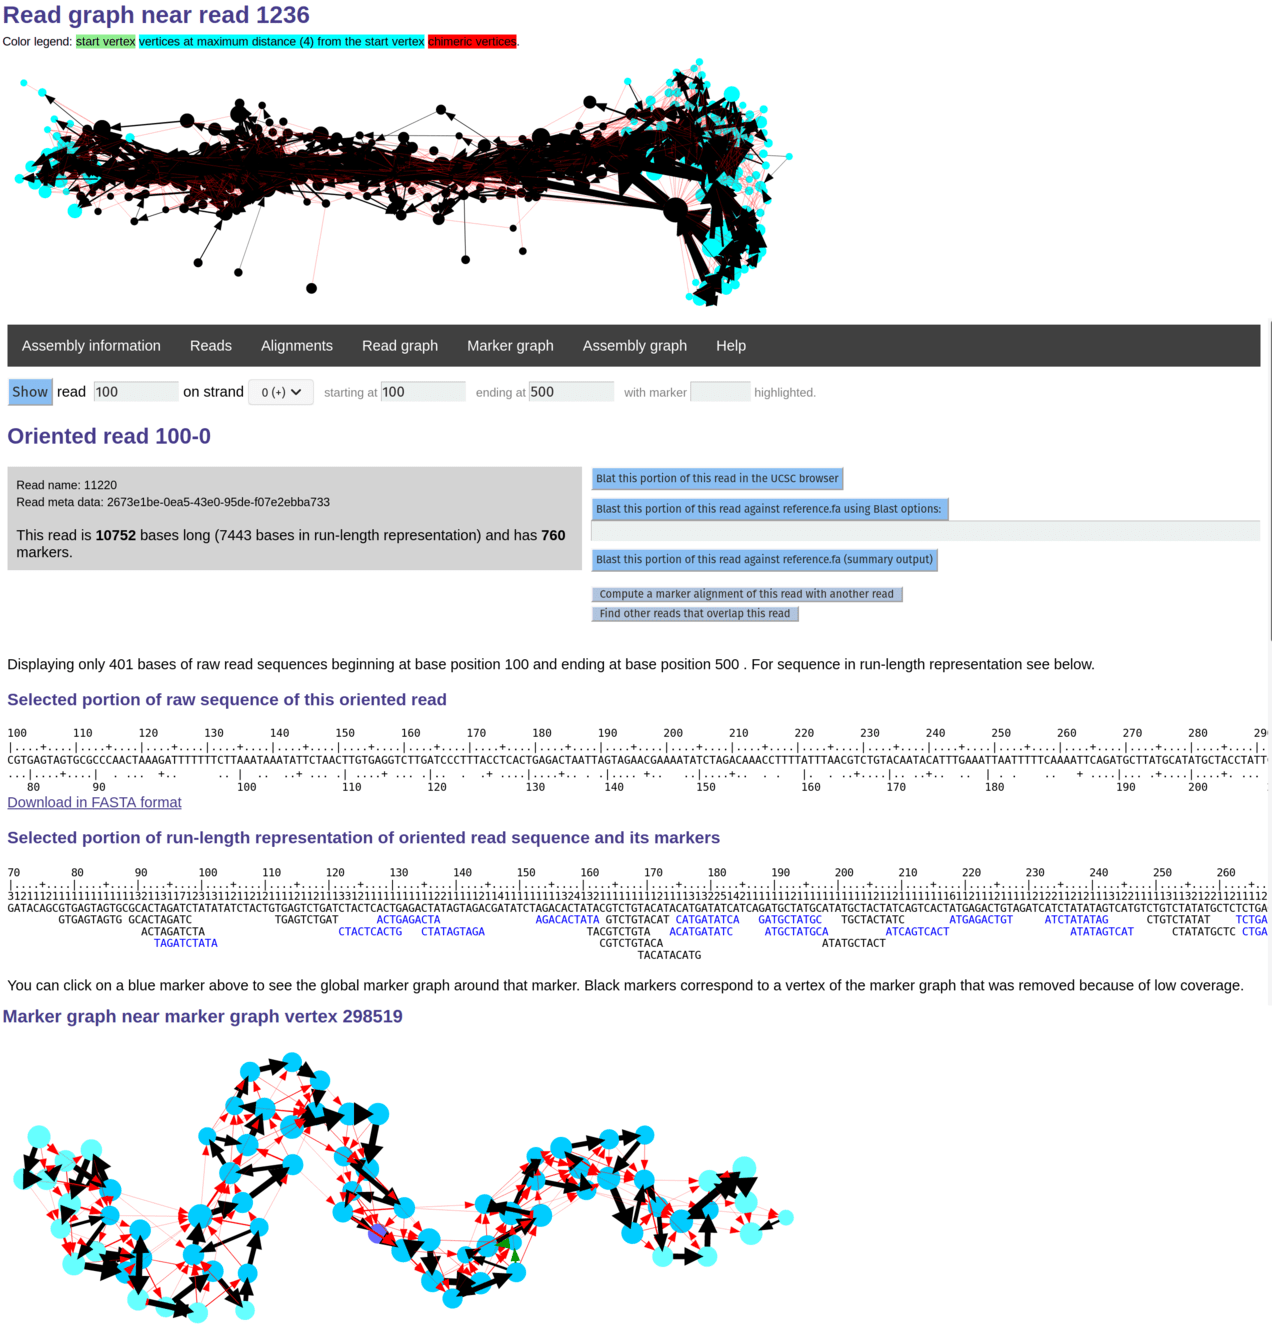
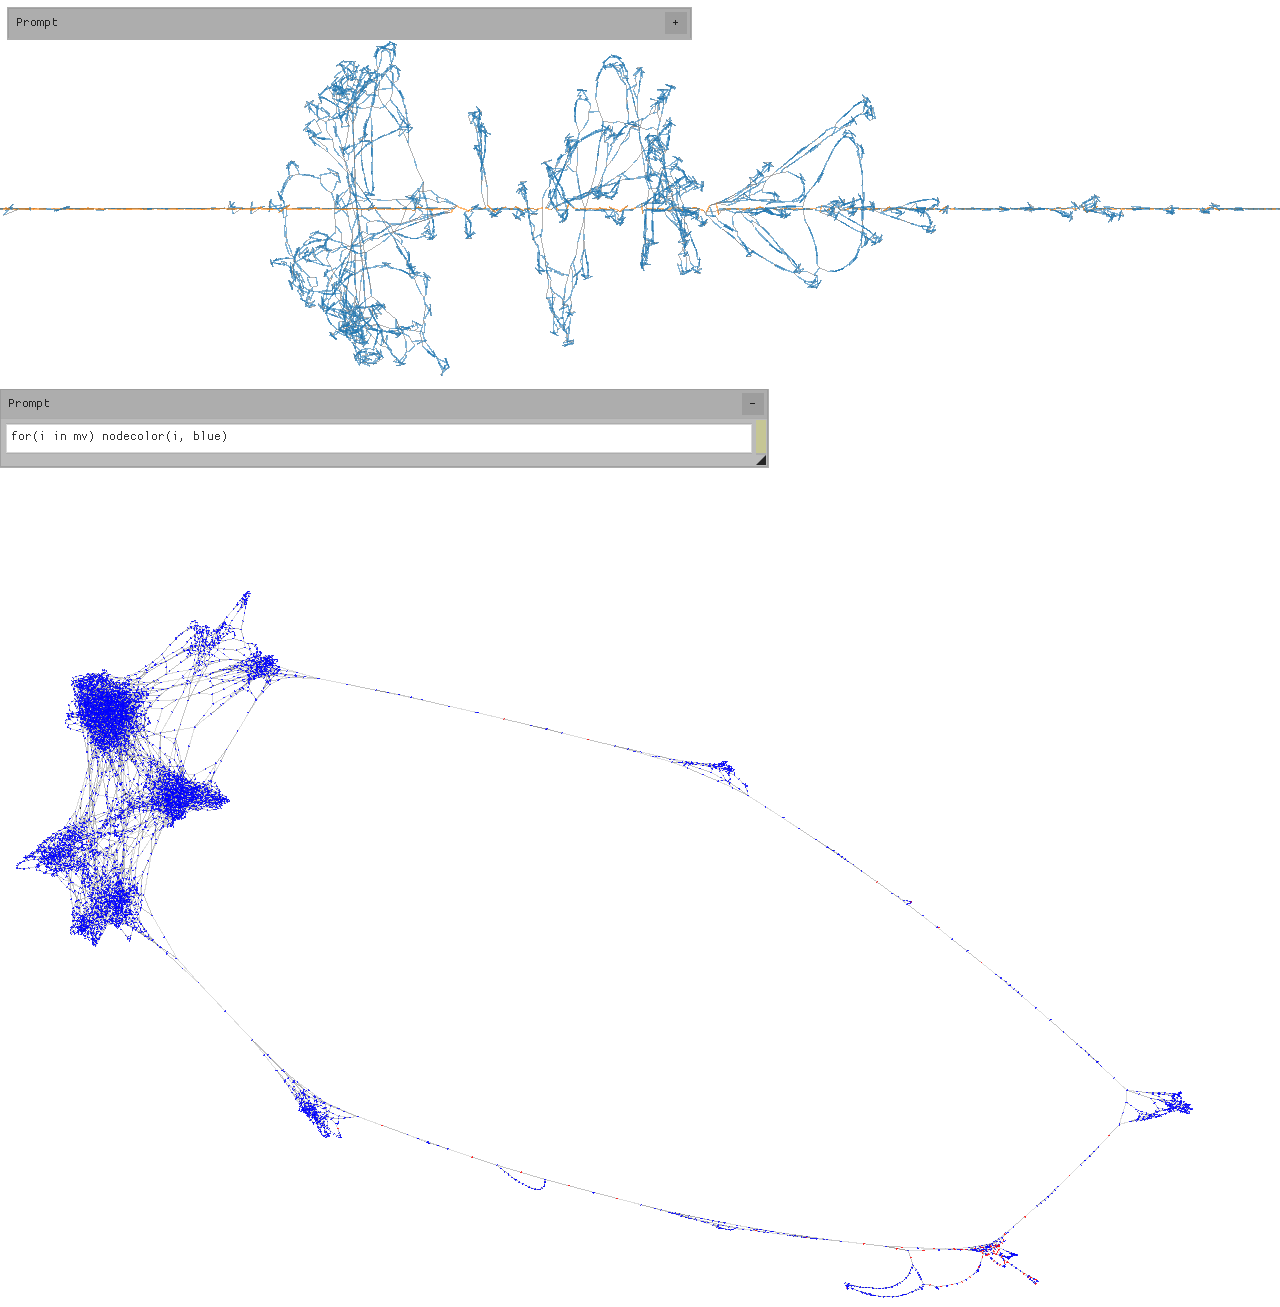
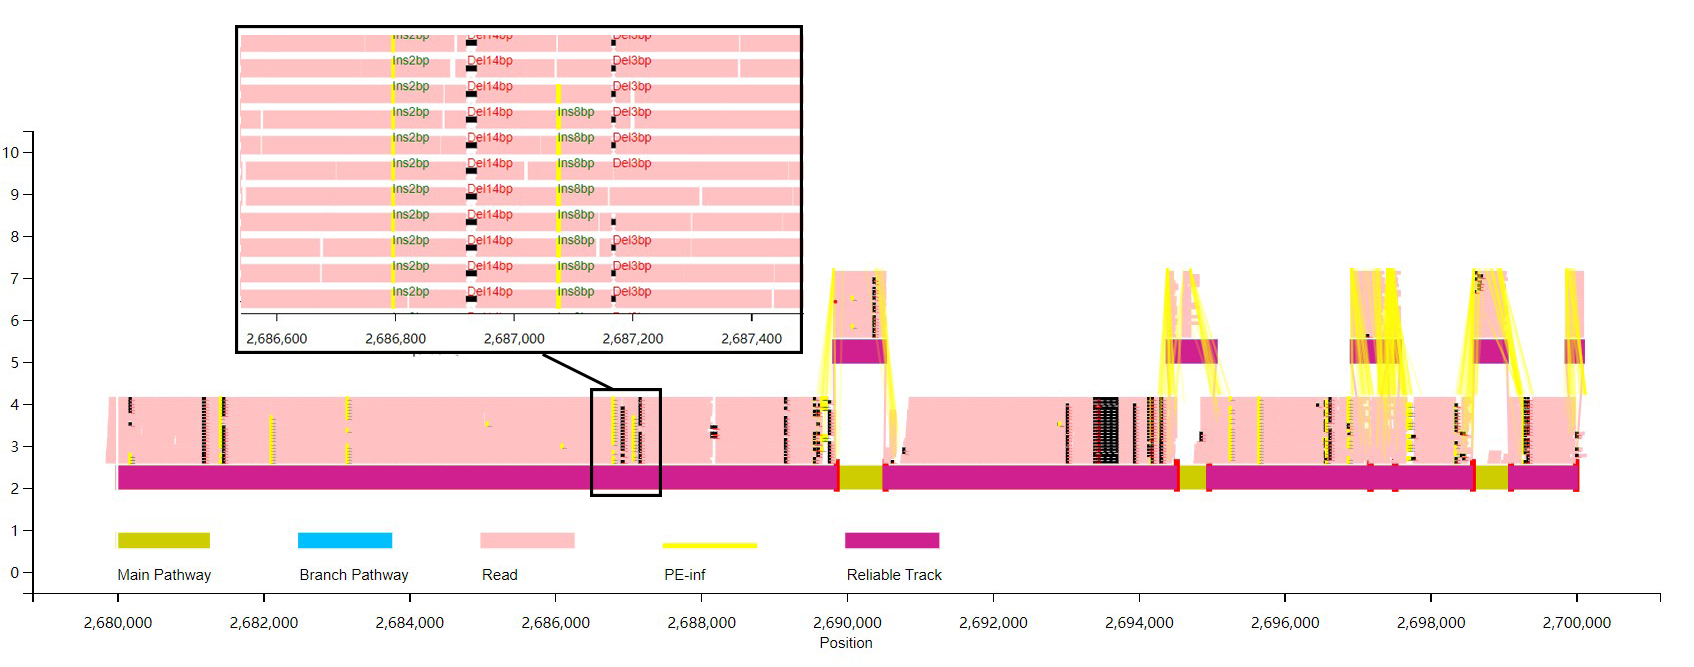
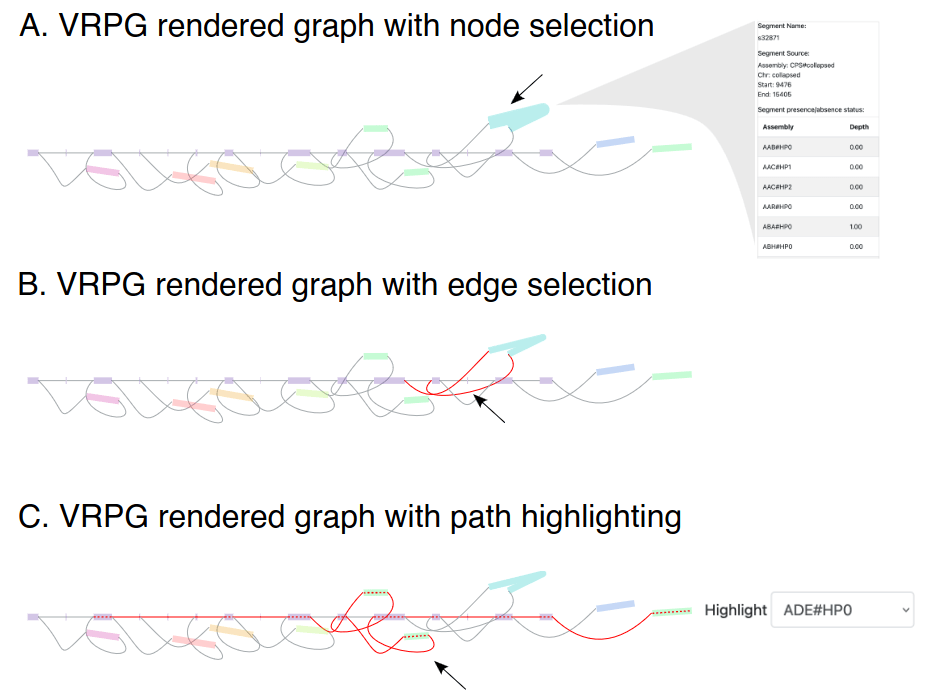
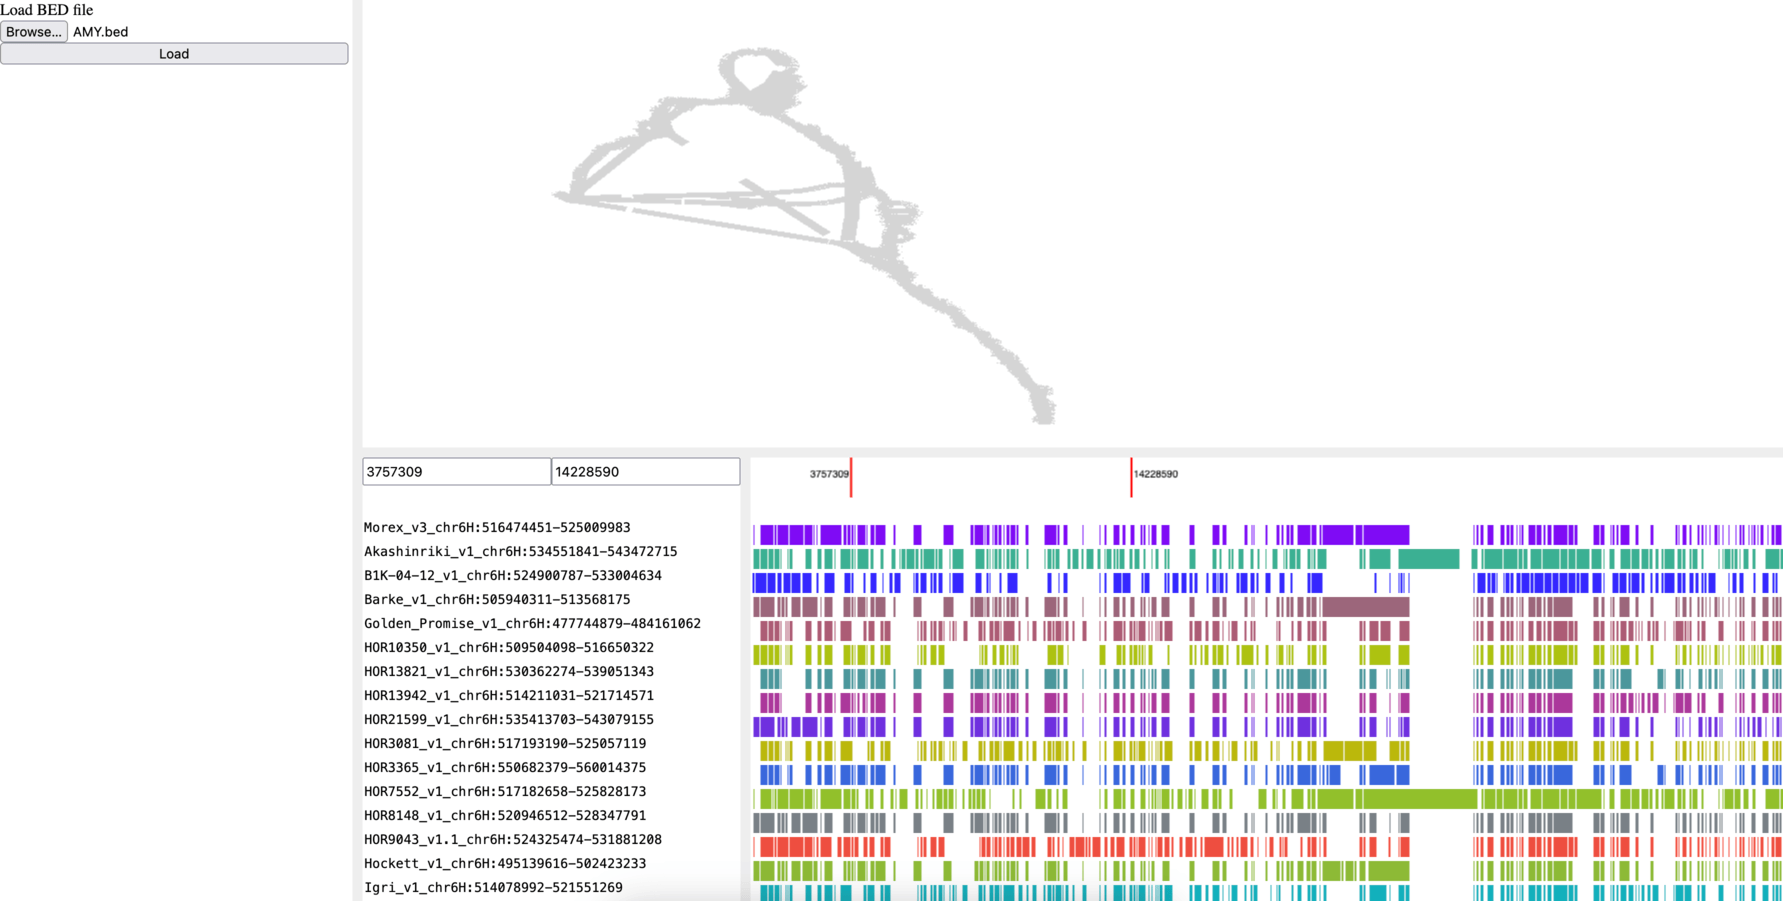
- CMPlot (img)
- GeneticsMakie.jl (img)
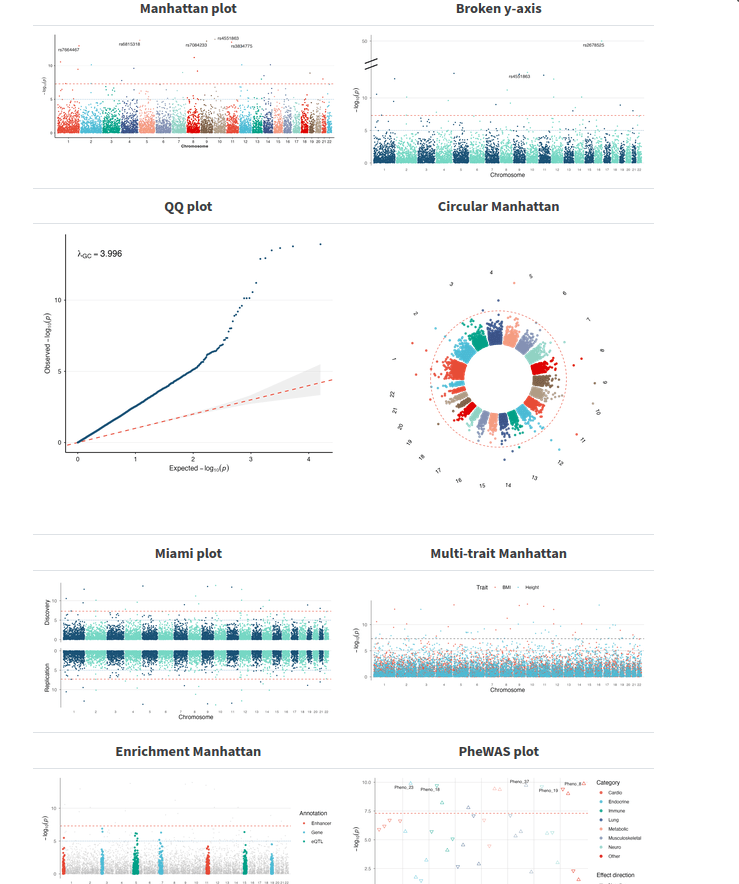
- ggplot2 manhattan plot (This is not a preconfigured tool but a blog post tutorial with tidy data and ggplot2) (img)
- LDBlockShow (img)
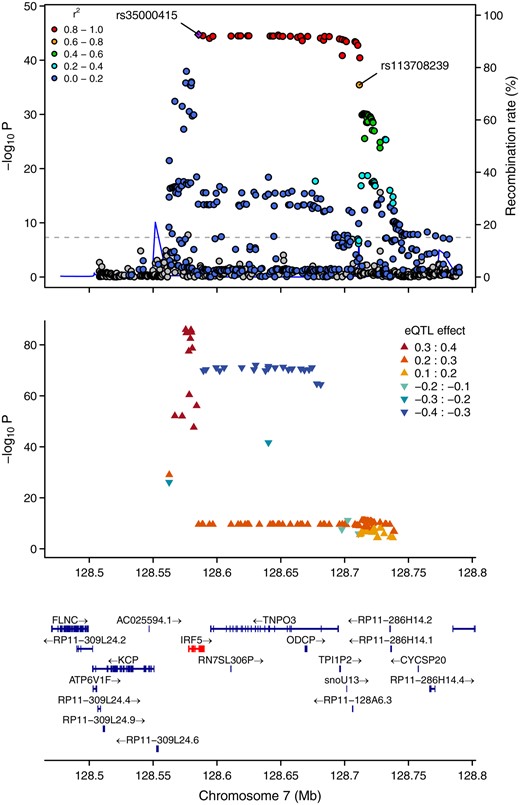
- Locuszoom (img)
- Locuszoom.js
- PureScript genetics browser (img)
- RACER (img)
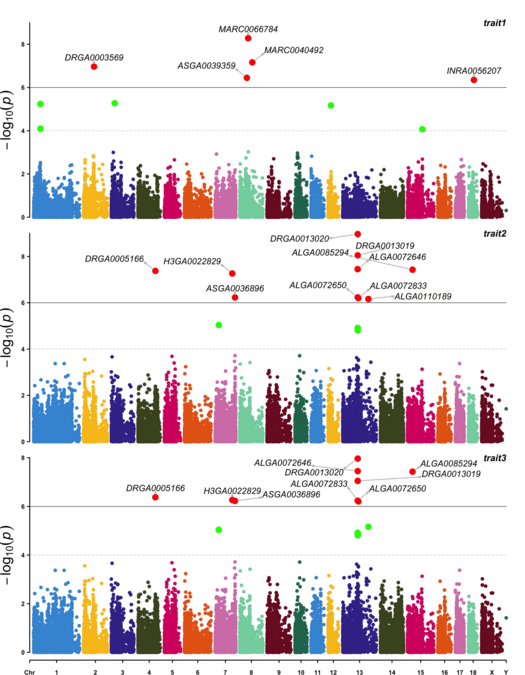
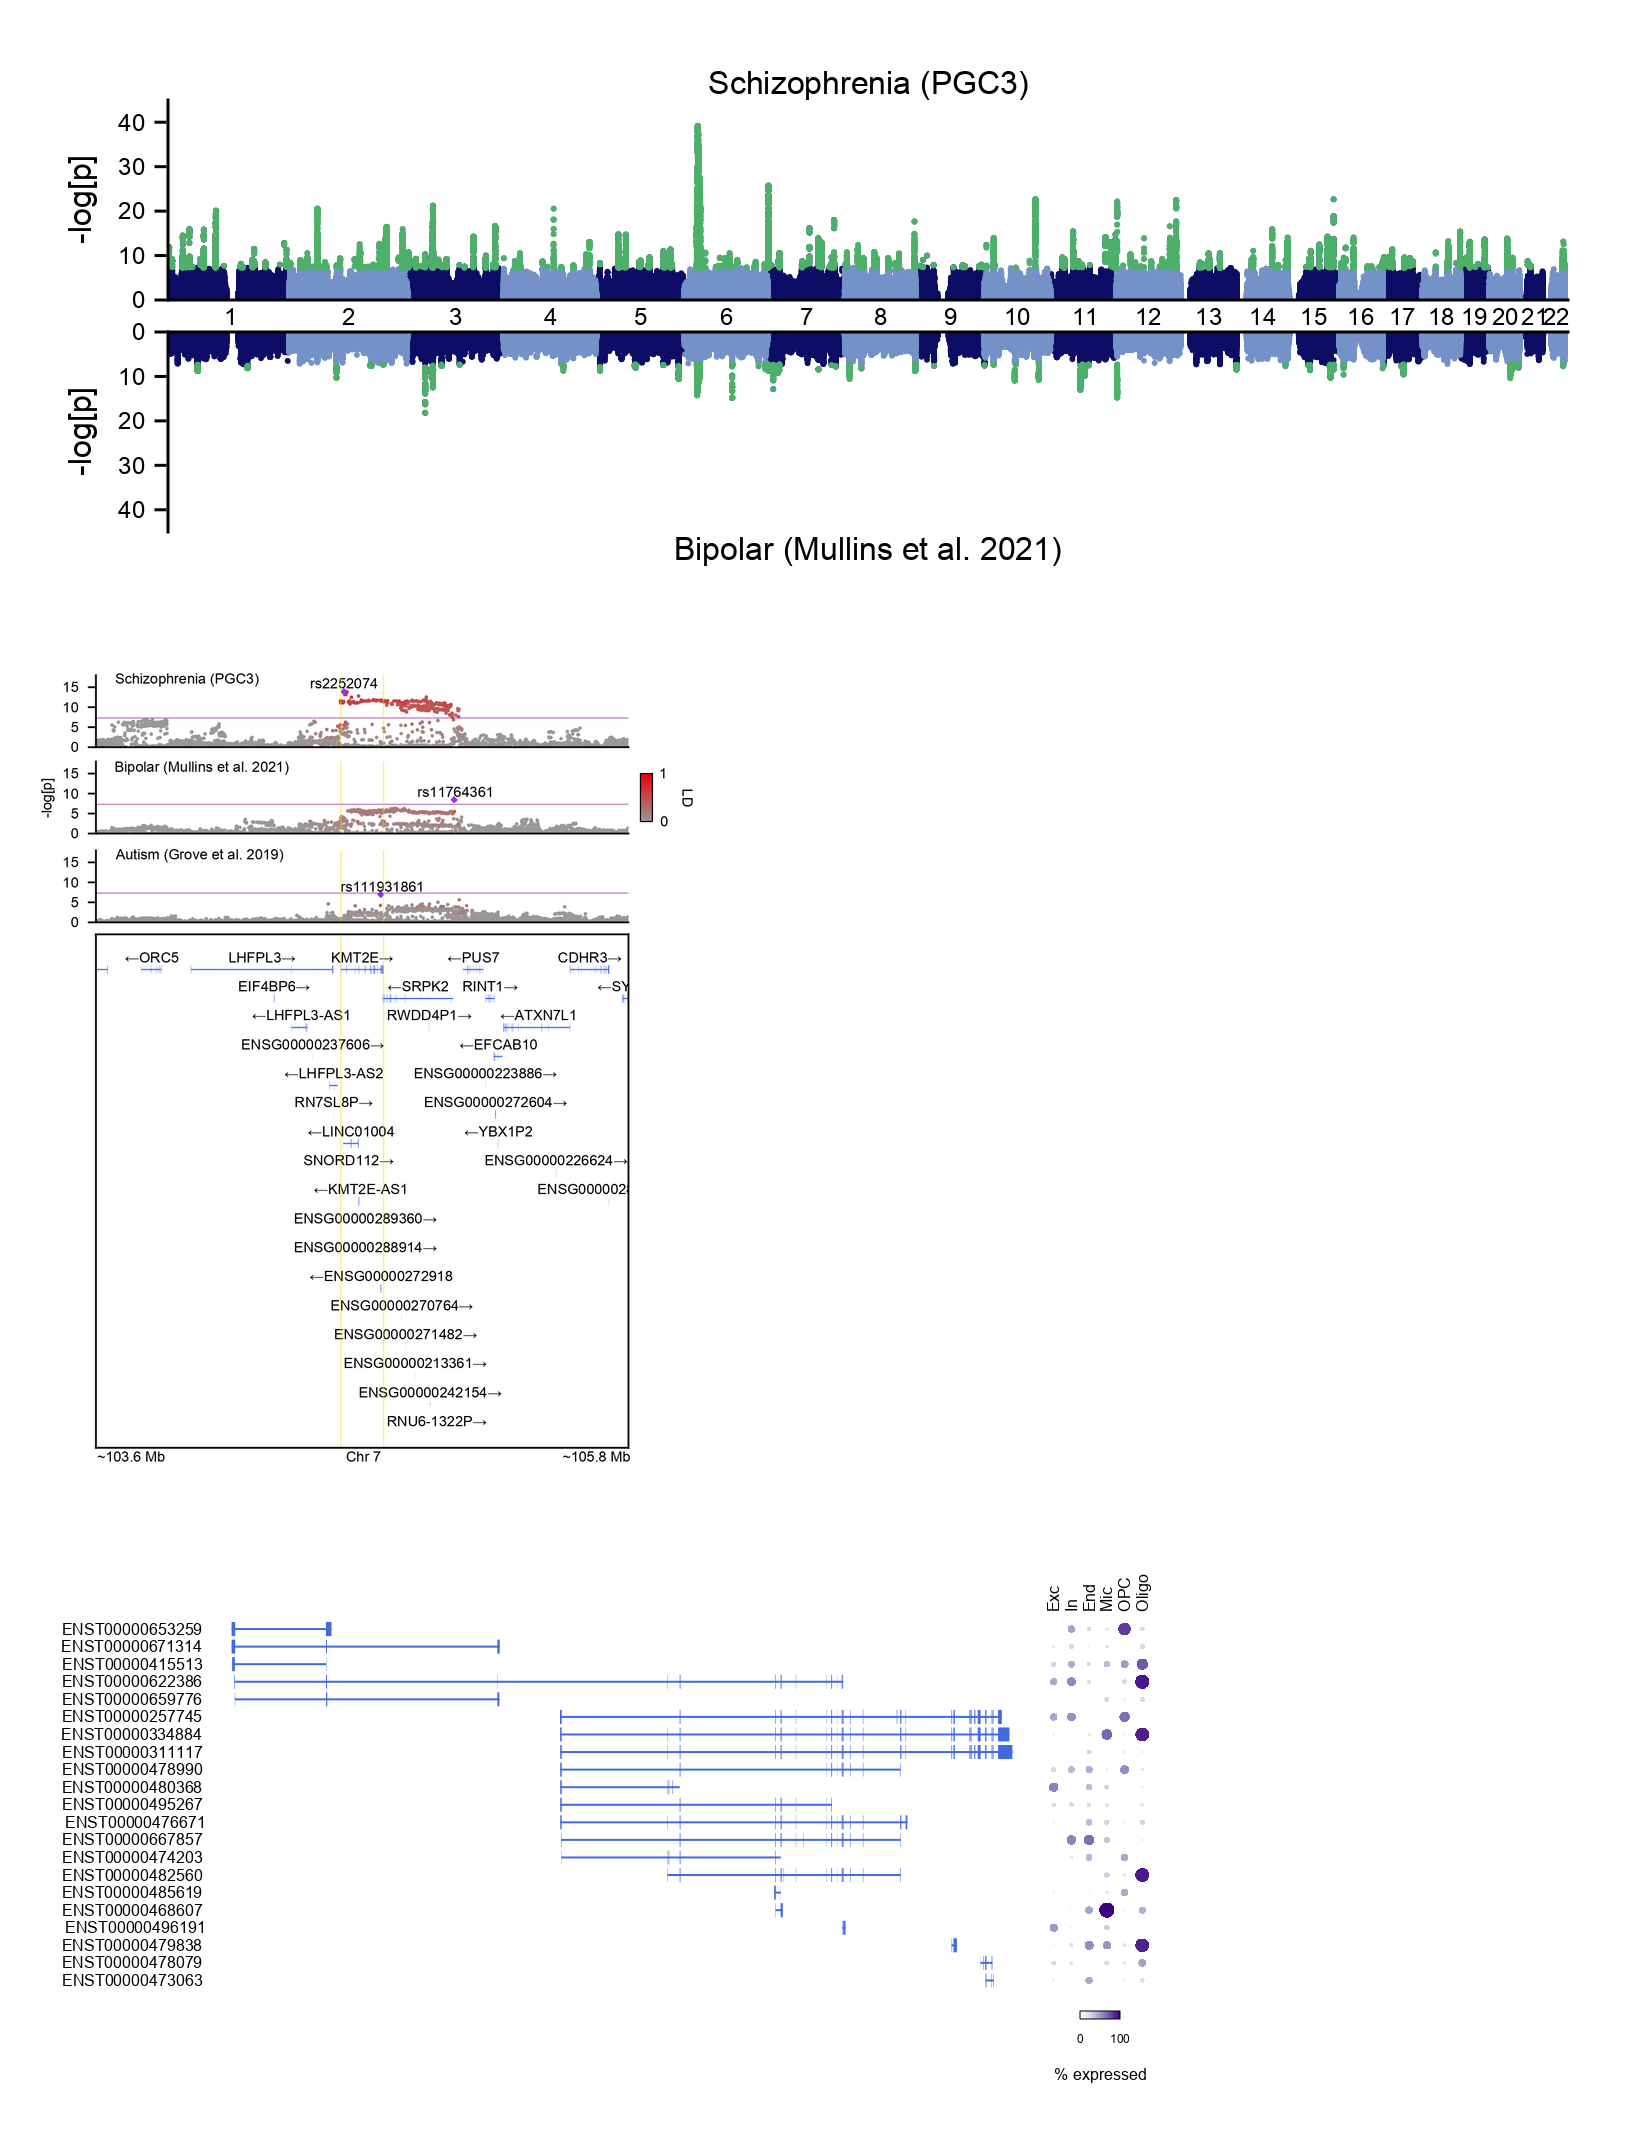
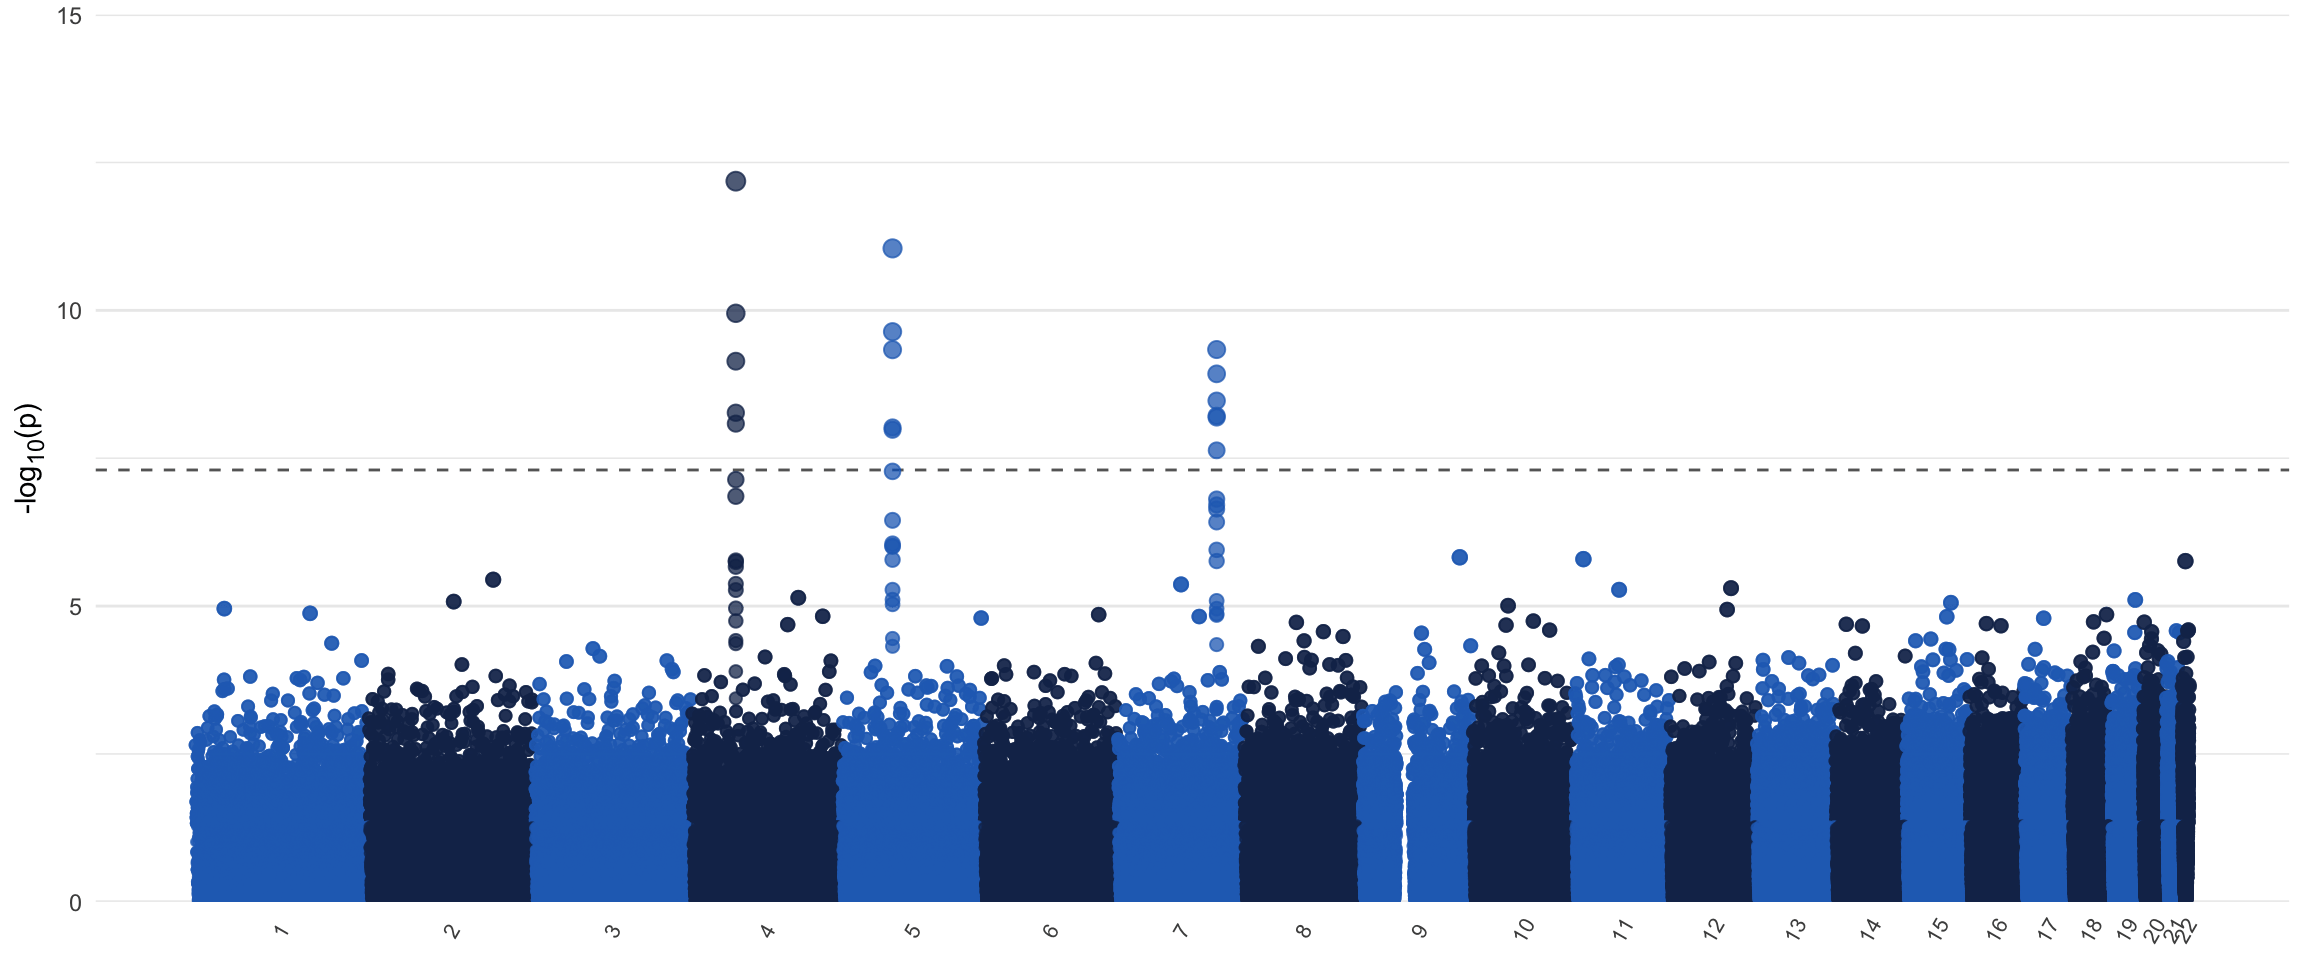
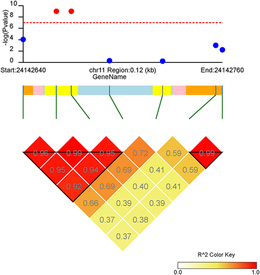
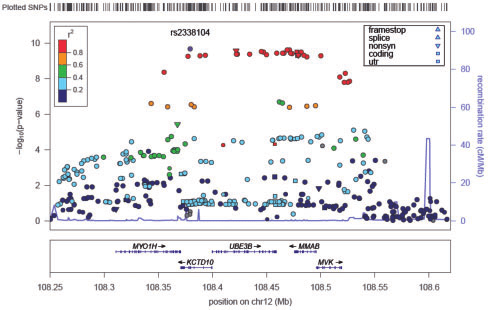
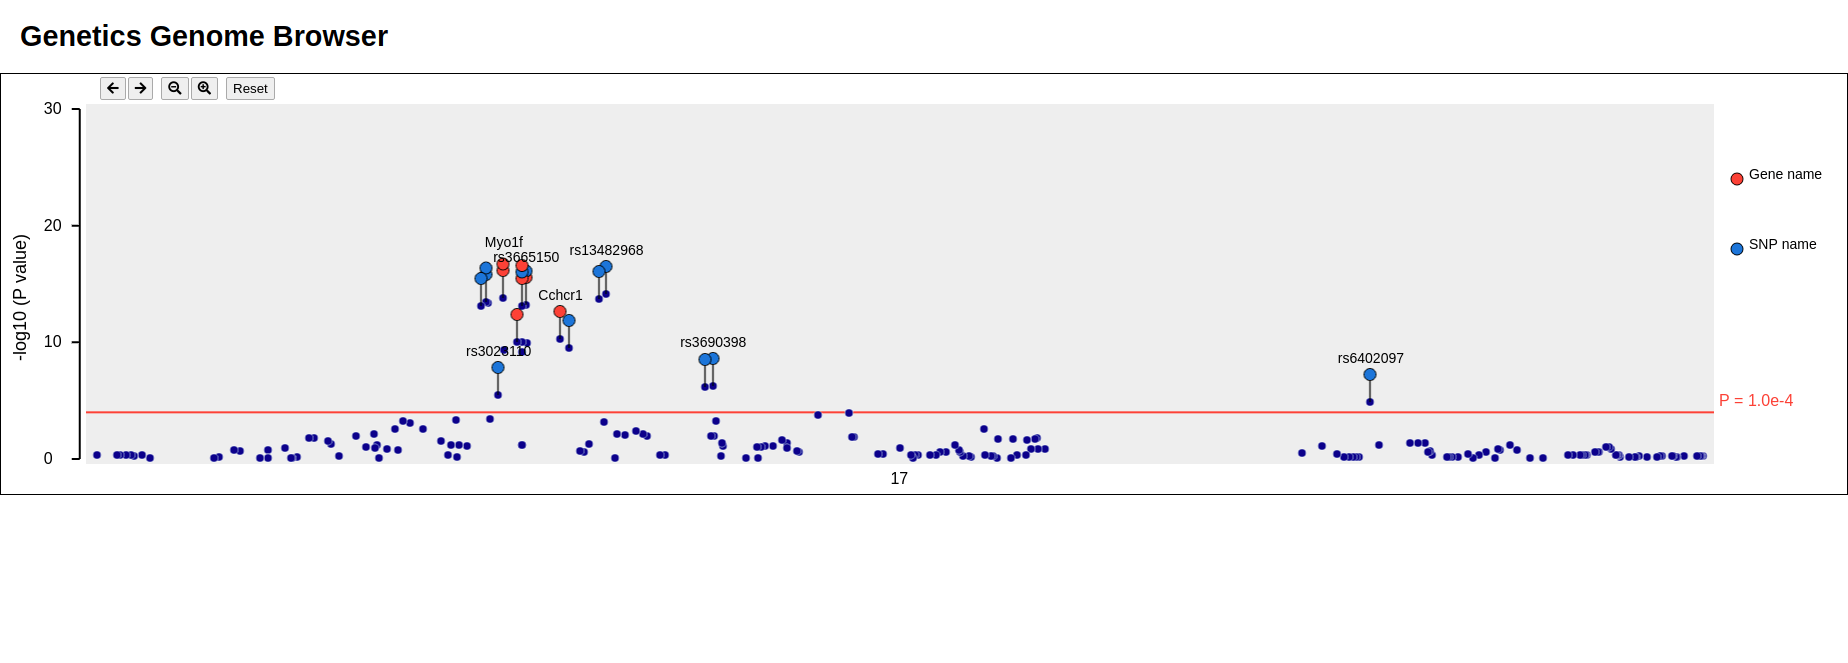
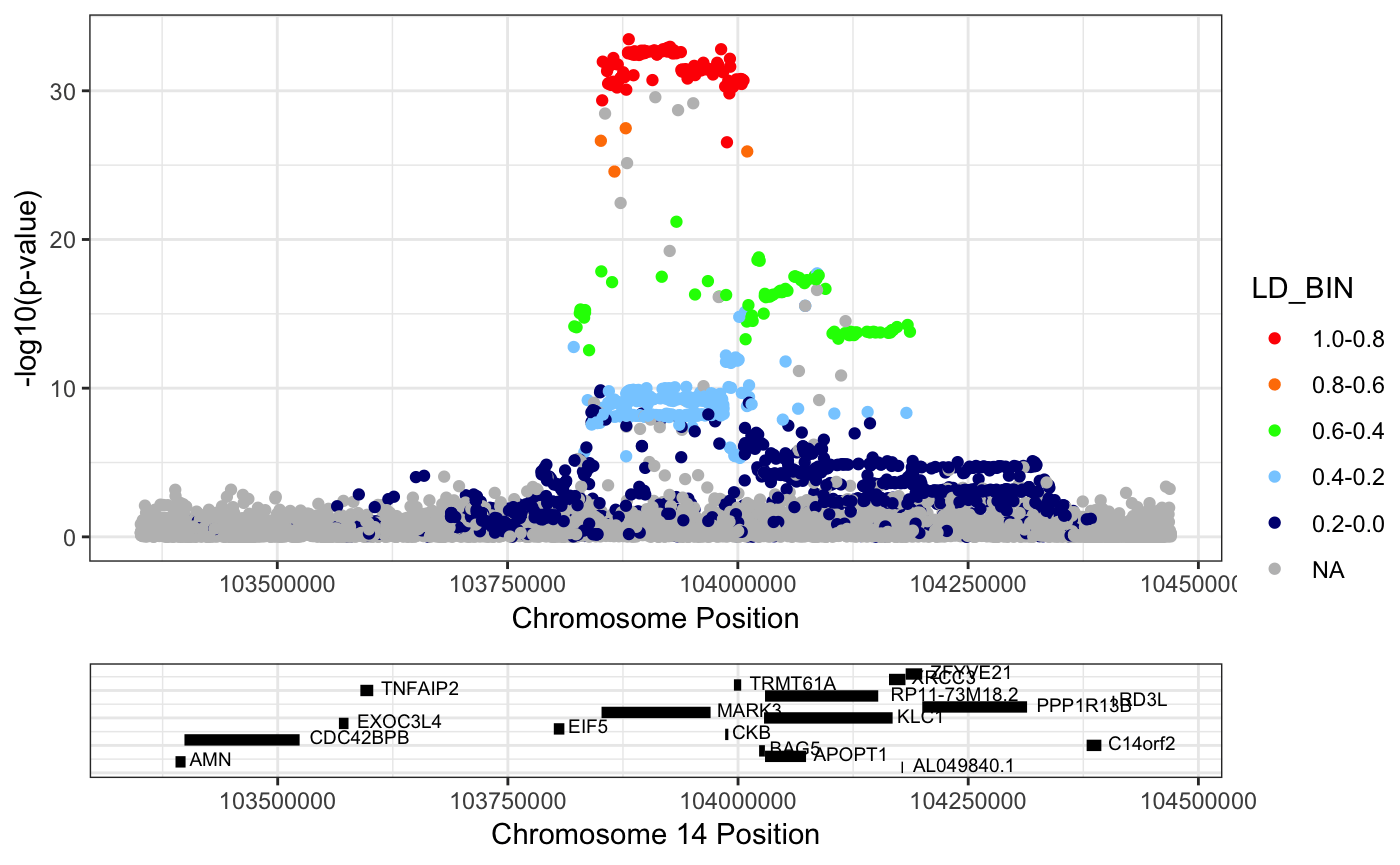
- EaSeq (img)
- UCSC Xena (img)
- vitessce (Uses higlass, web based with (optional) Python and R integrations, not all visualization are 'genome coordinates') (img)
- VIVA (img)
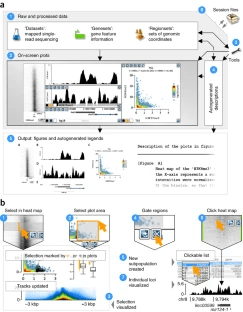

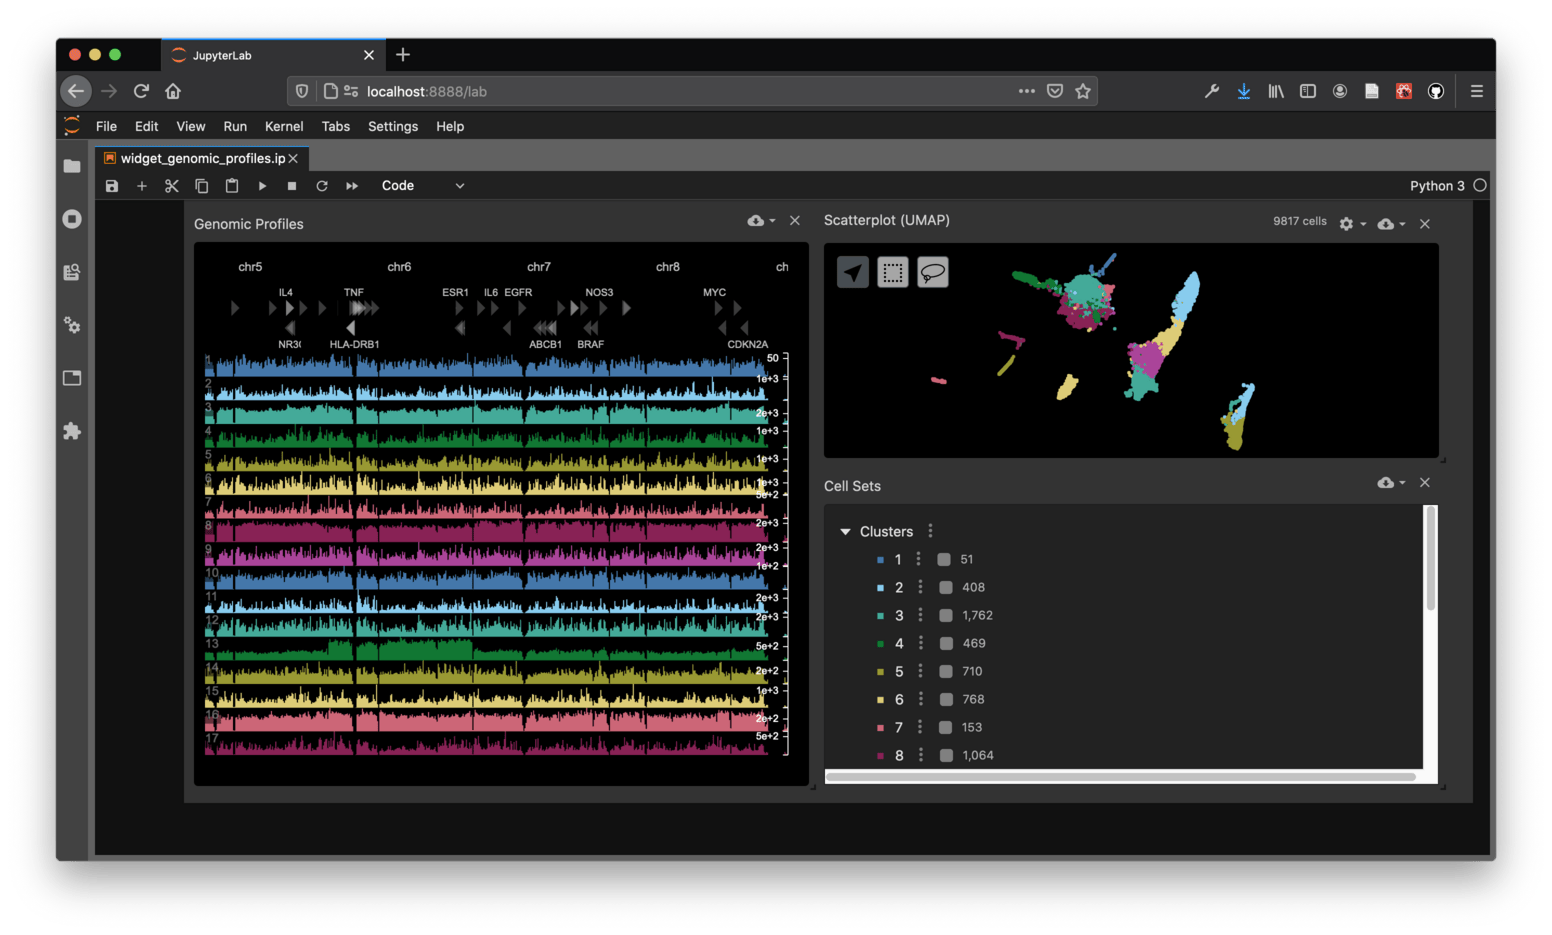
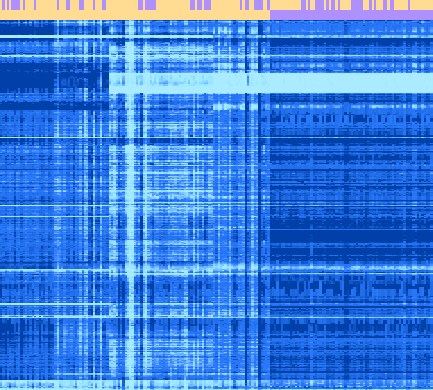
- aplot (img)
- figeno (img)
- gcMapExplorer (img)
- HiCPlotter (img)
- Plotgardener (img)
- PretextView (img)
- pyGenomeTracks (See also https://pypi.org/project/gtracks/ which is a separate project that is powered by pyGenomeTracks) (img)
- SparK (img)
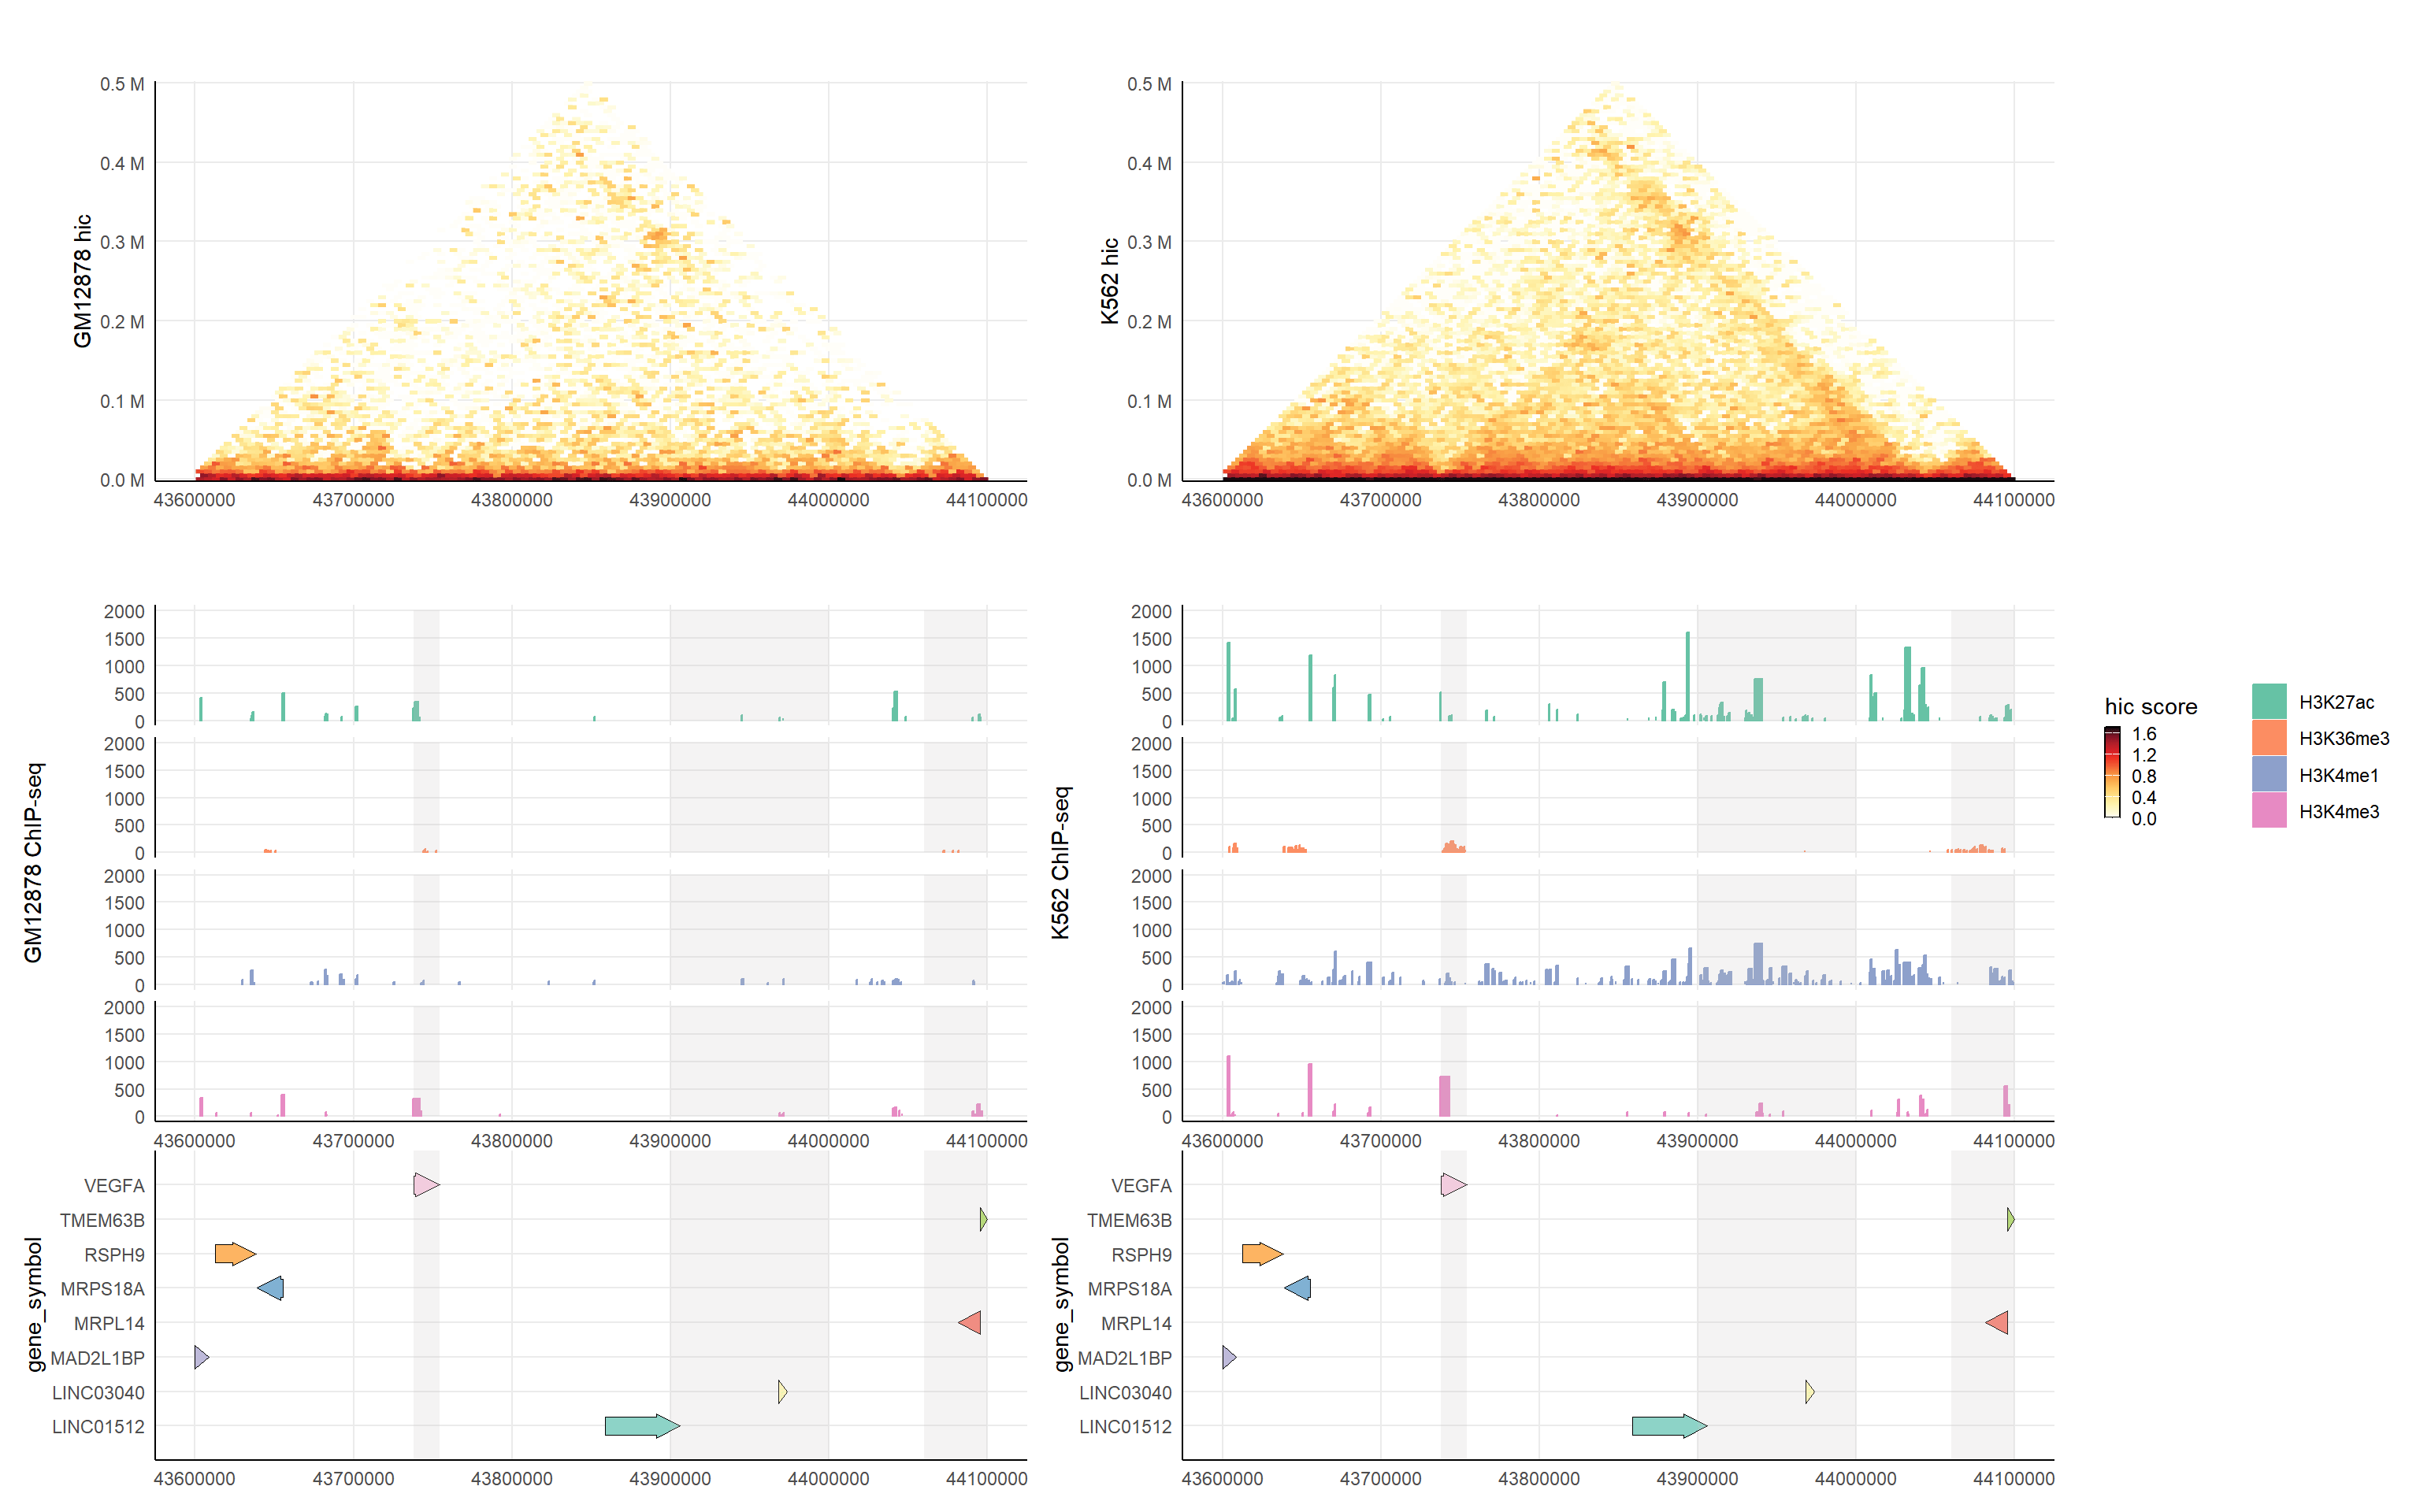

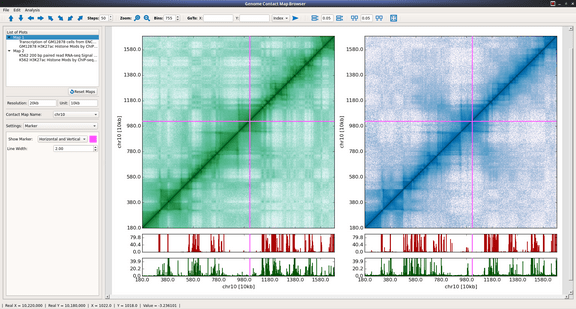
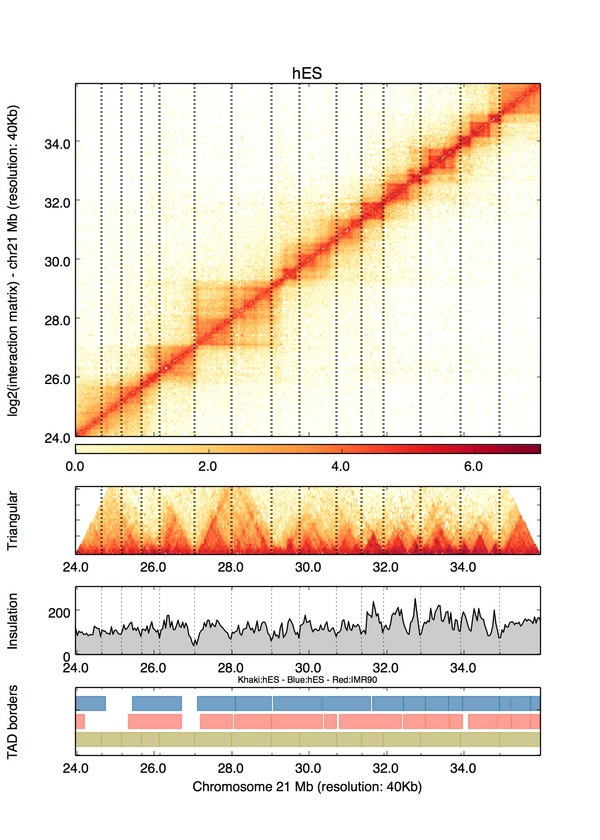
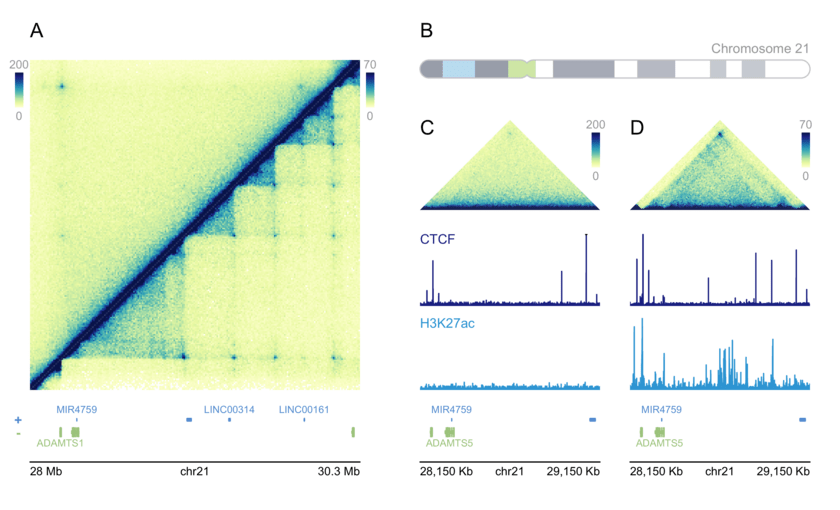
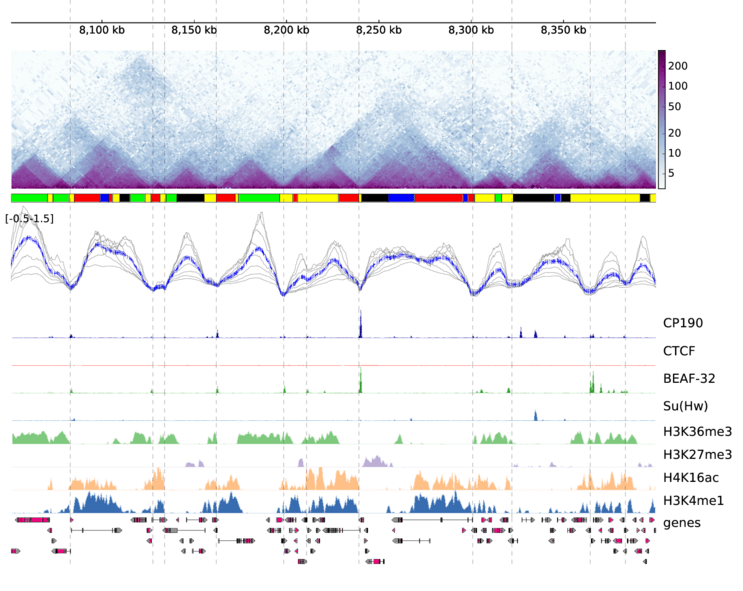

- chromoMap (img)
- chromPlot (img)
- chrov (See also usage in https://github.com/rraadd88/beditor) (img)
- CVit (img)
- Cvit.js (img)
- eweitz Ideogram (img)
- ezcharts (img)
- Flash Gviewer (img)
- genomegraphs (img)
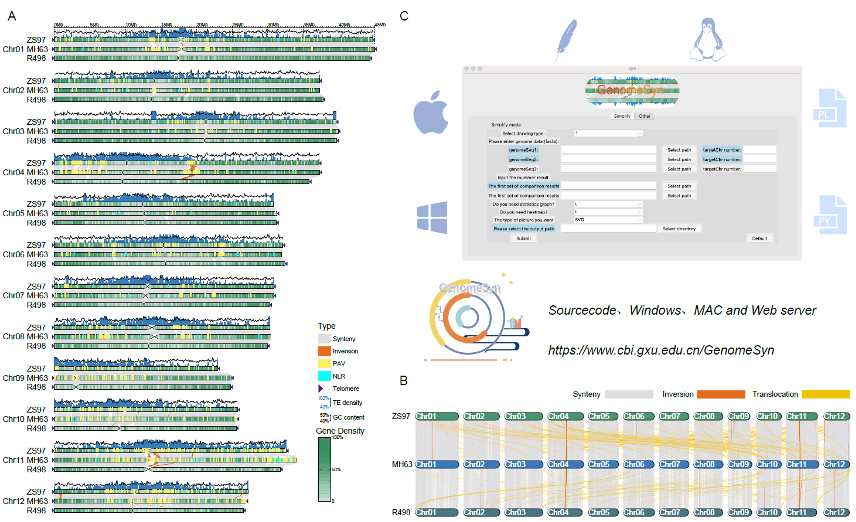
- GenomeSyn (img)
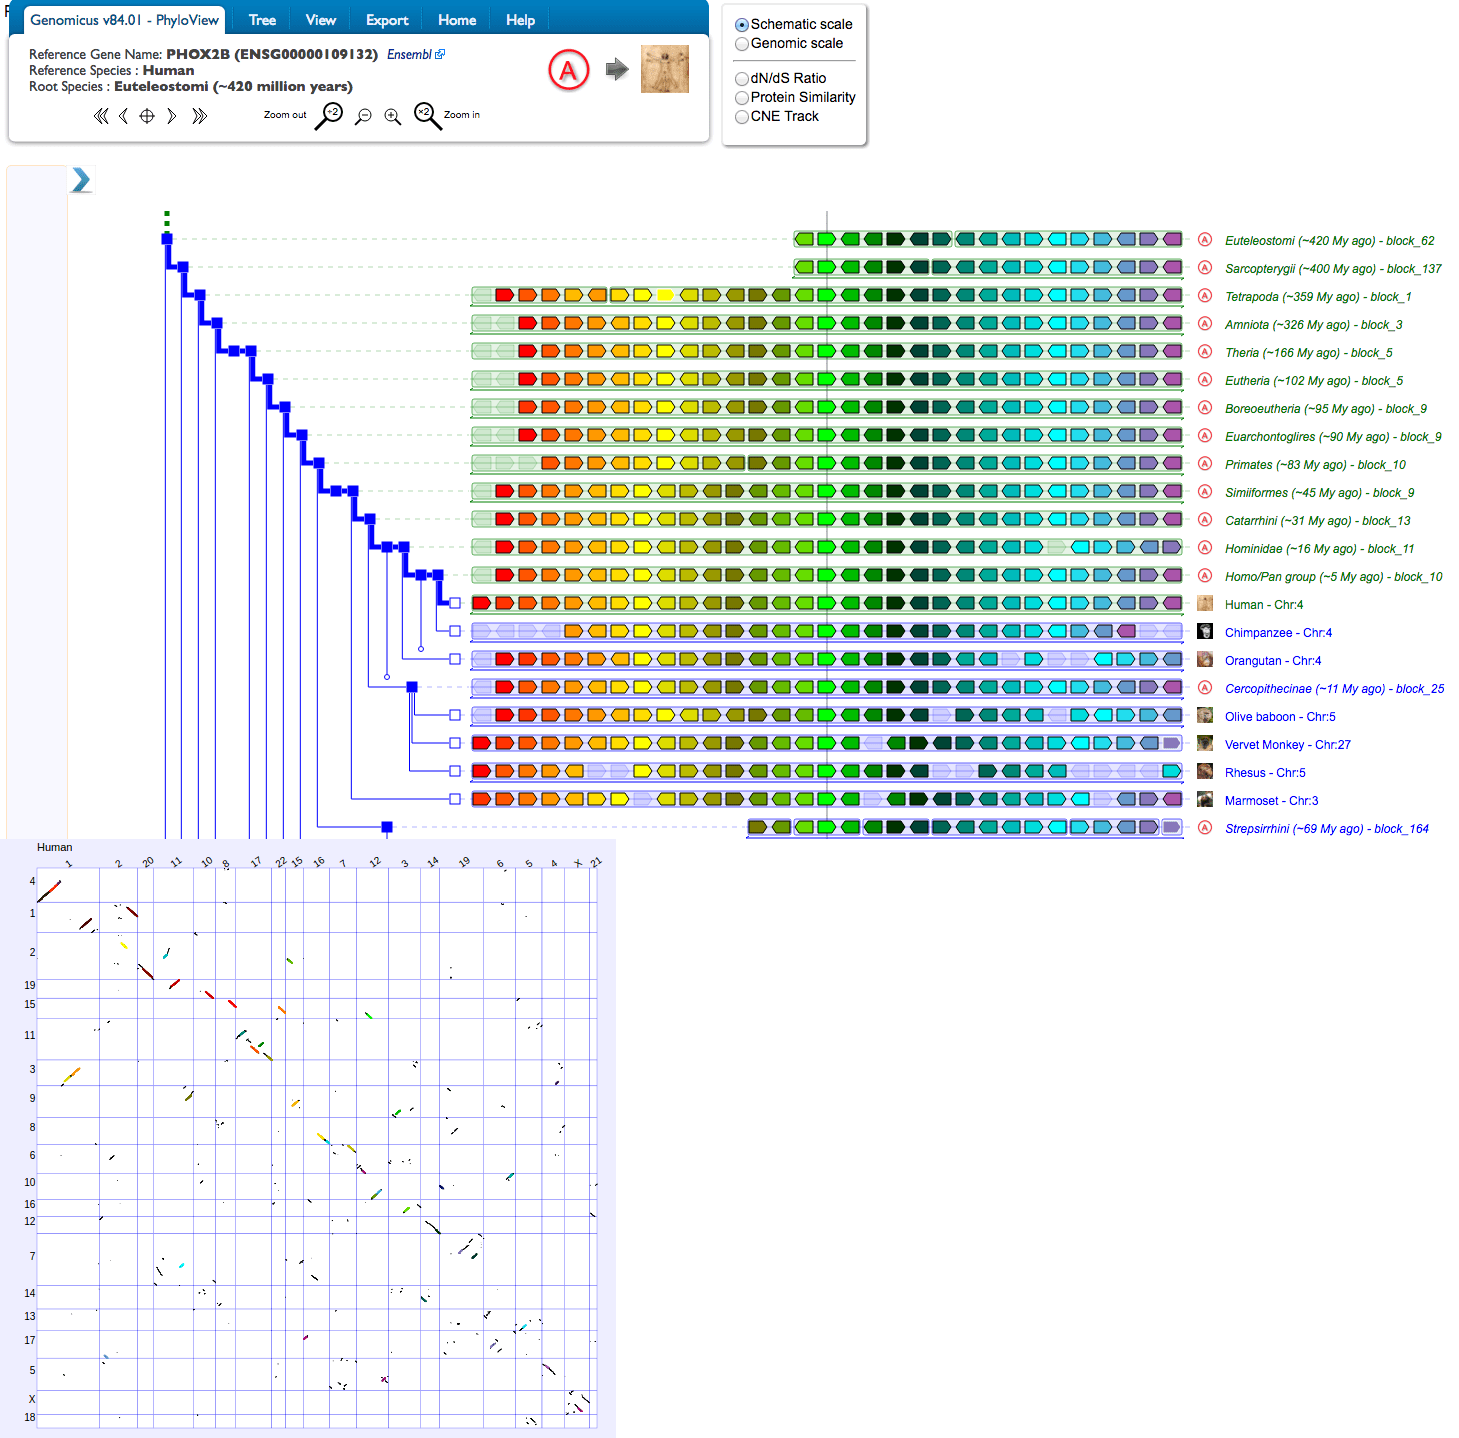
- Genomicus (img)
- ggbio (img)
- gtrellis (img)
- Ideogram (img)
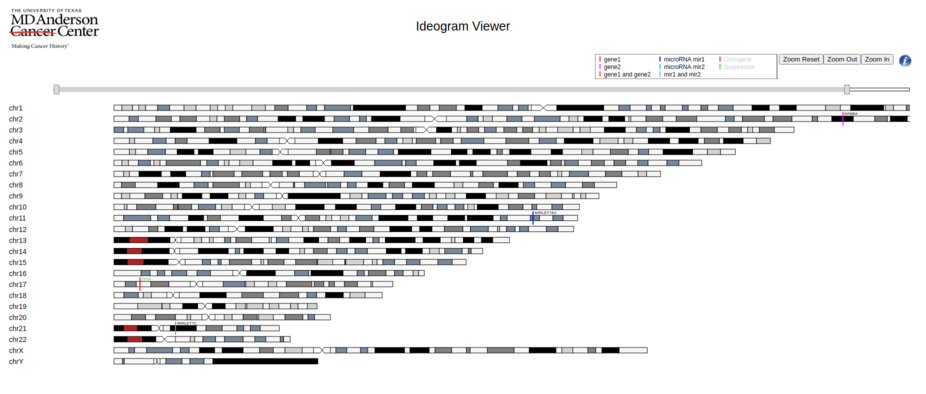
- Ideogram viewer (img)
- Ideoplot
- IdeoViz (img)
- karyoploteR (img)
- KaryotypeSVG (img)
- NCBI Genome Decoration (Was located at https://www.ncbi.nlm.nih.gov/genome/tools/gdp/, sunsetted in 2023) (img)
- PhenoGram (Can be web server or download) (img)
- pyideogram (img)
- RectChr (img)
- RIdeogram (img)
- tagore (img)
- Tripal MapViewer (img)
- UCSC Genome Graphs (img)
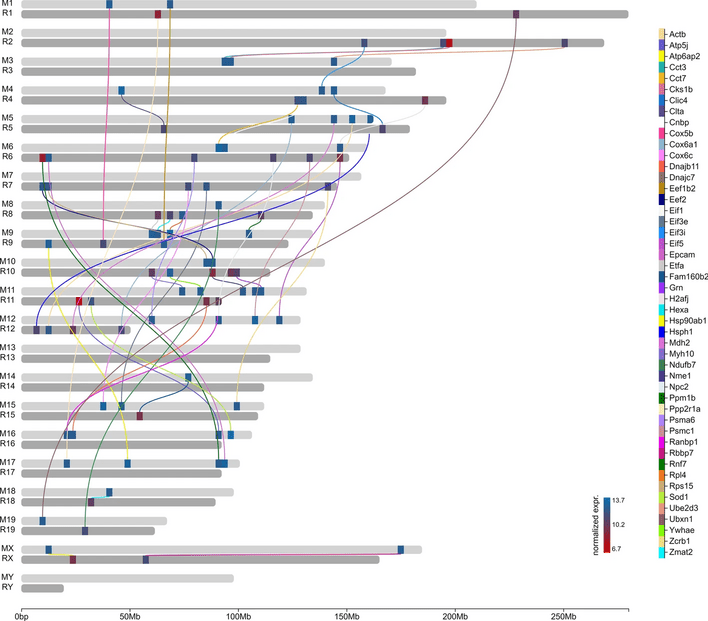
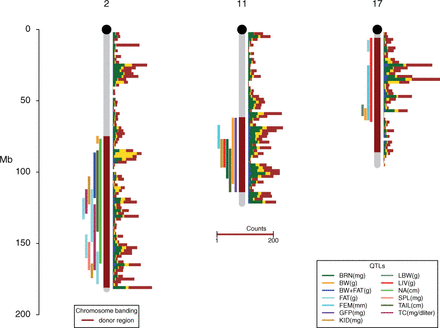
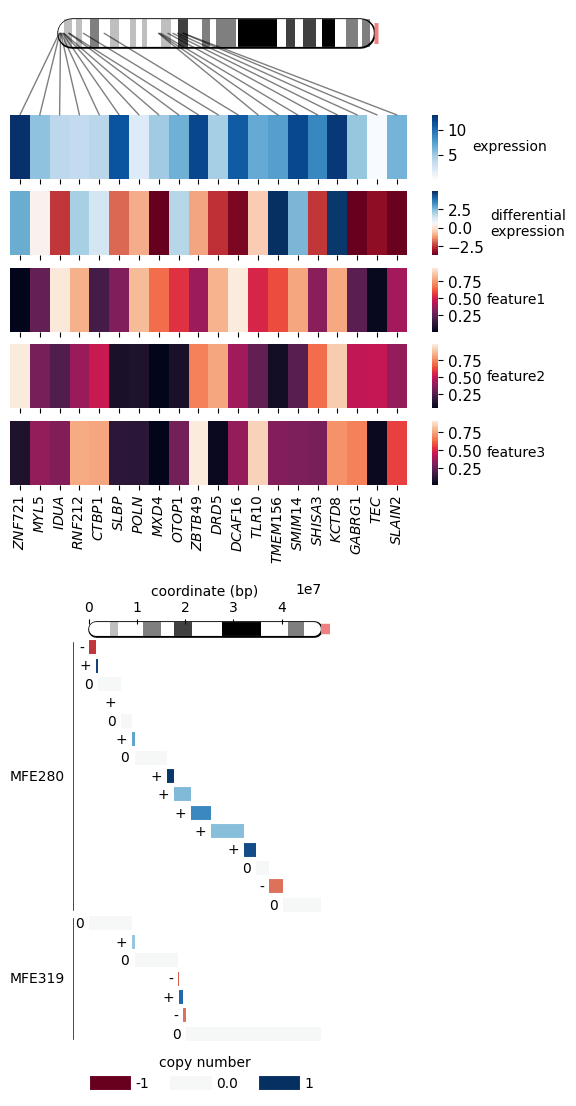
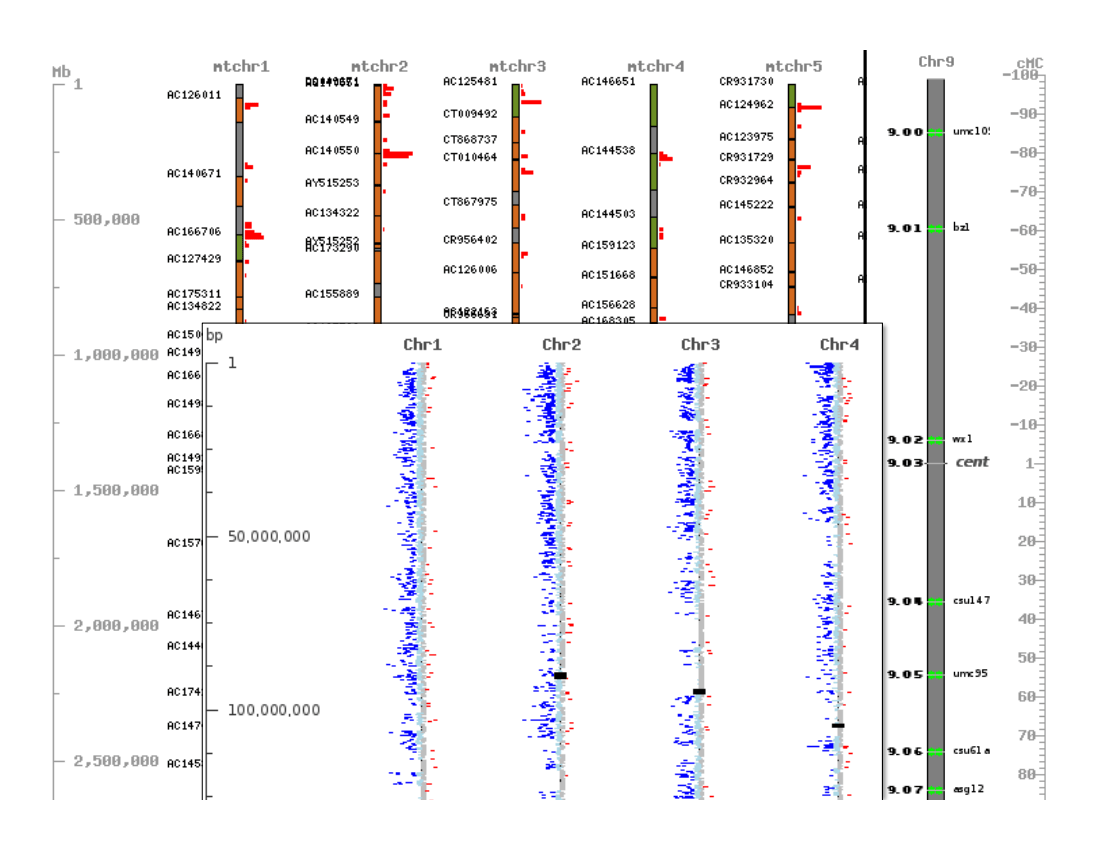

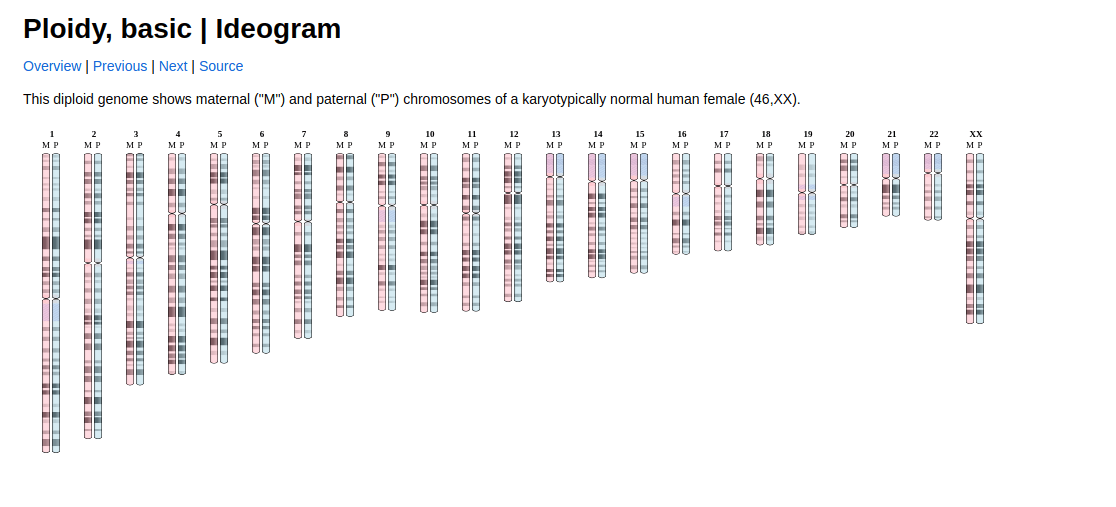
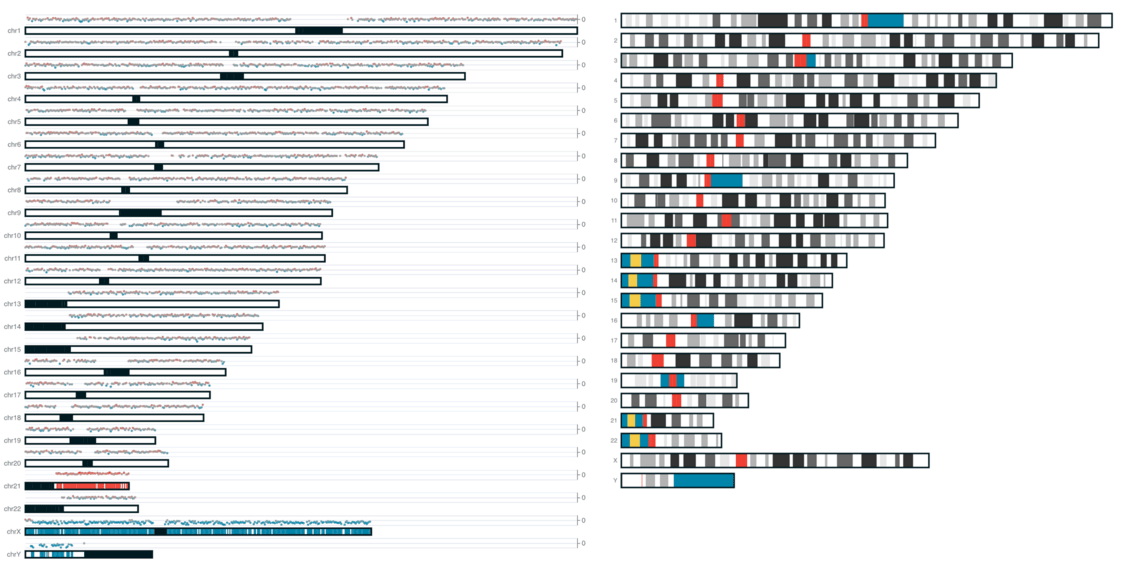
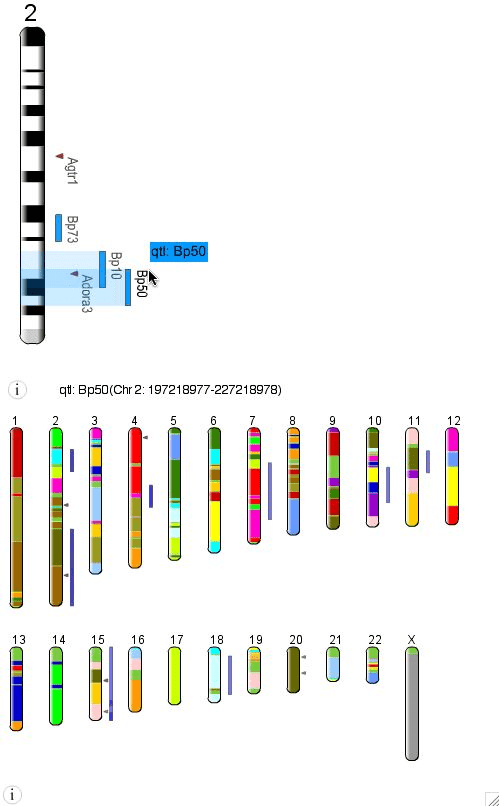
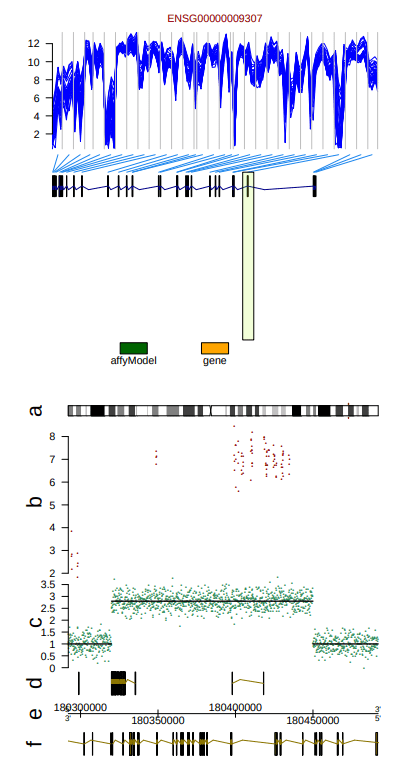
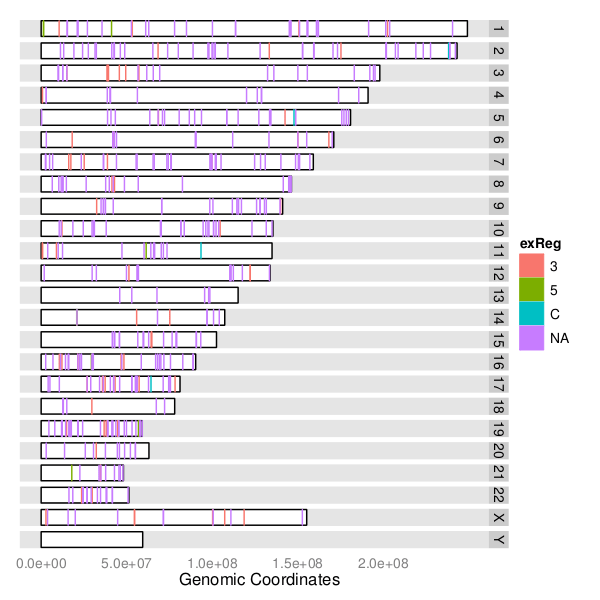
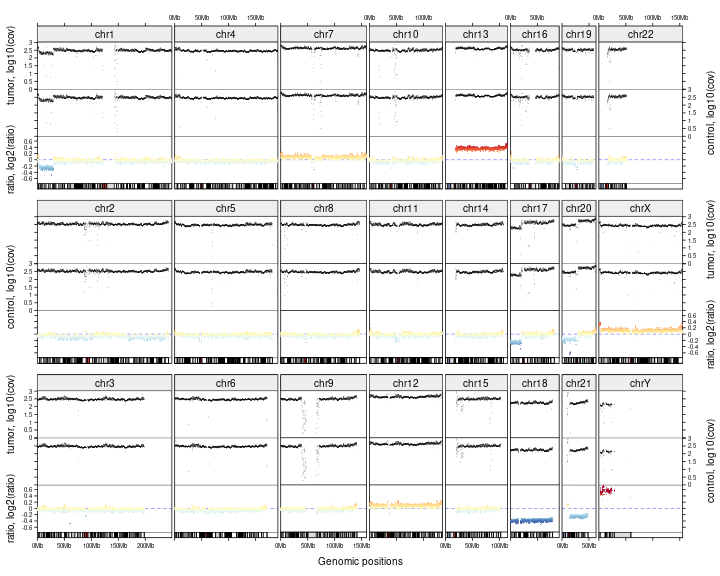
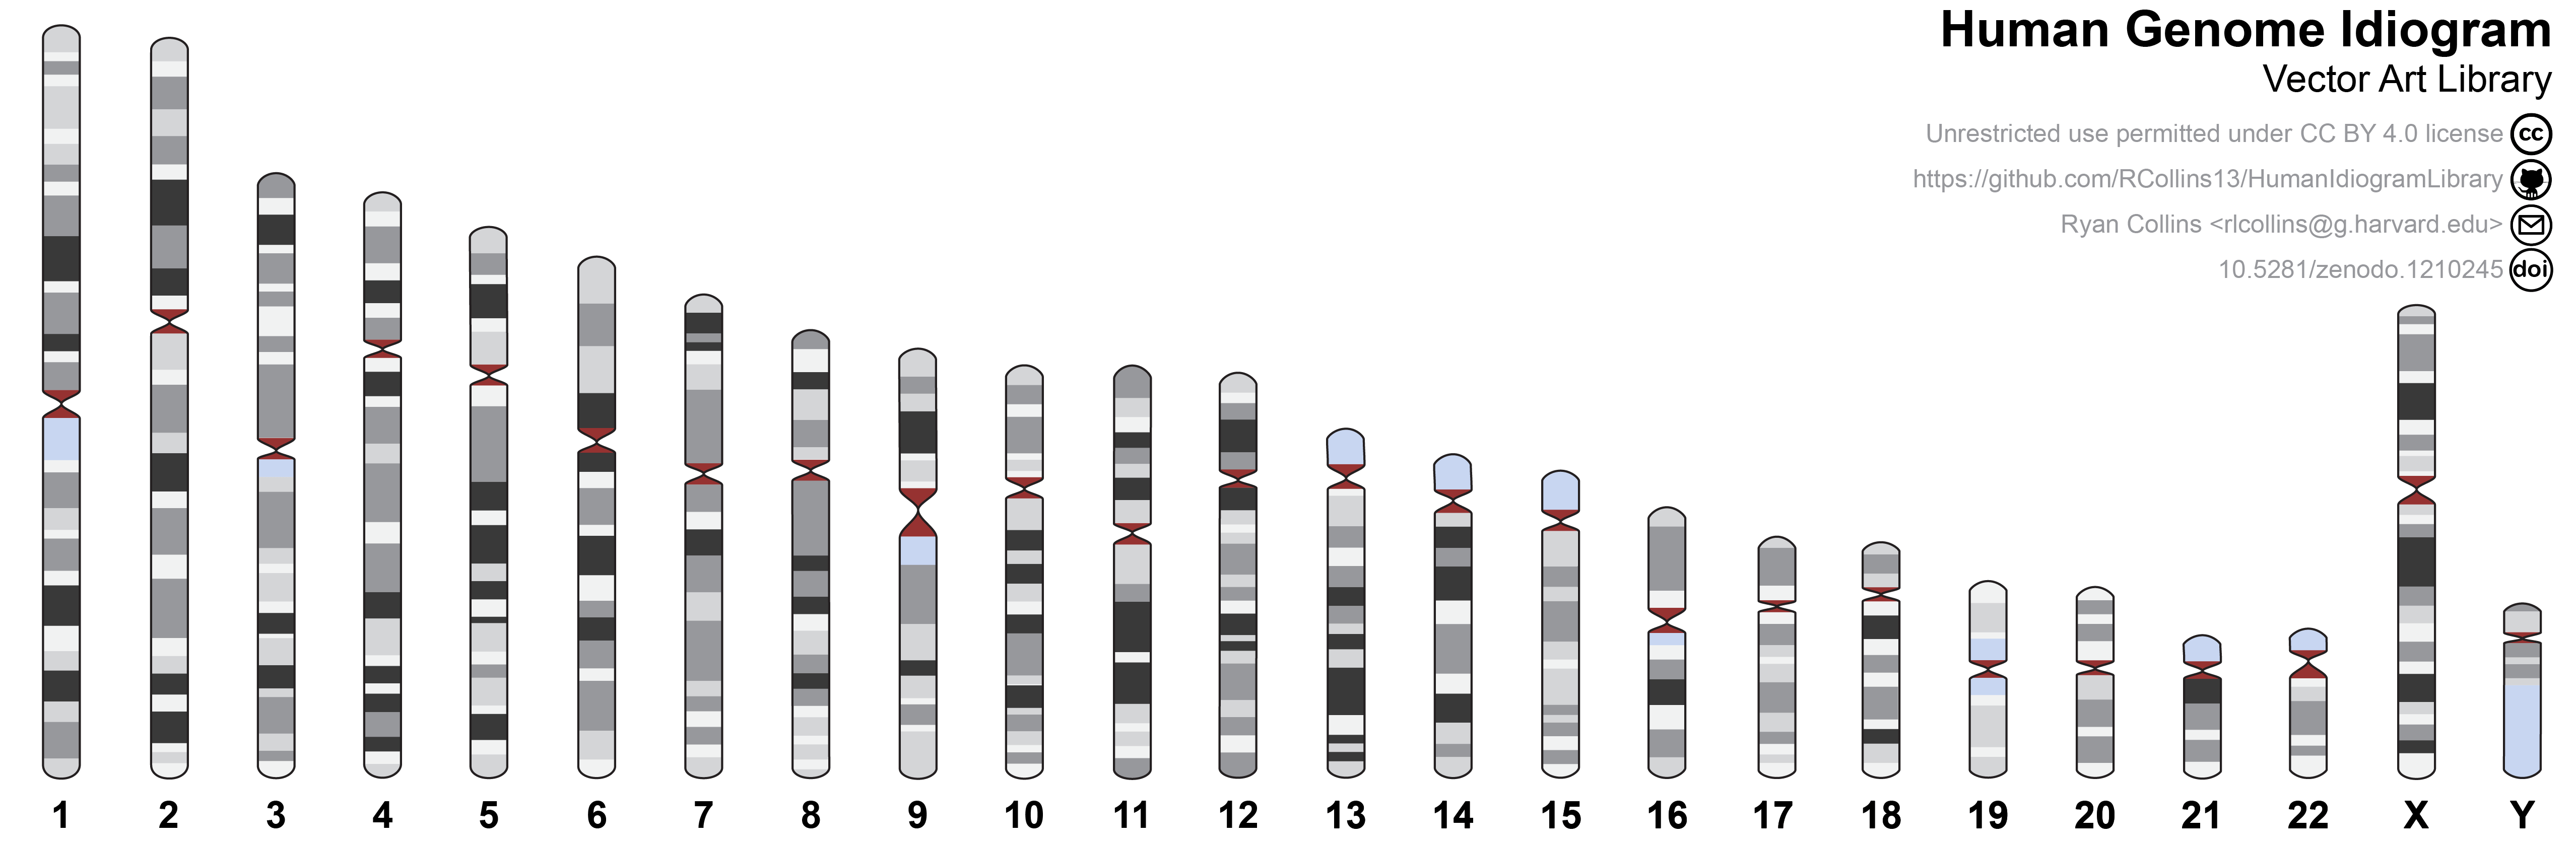
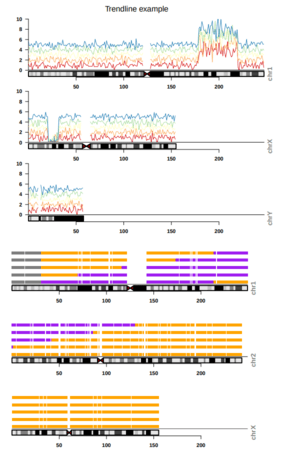
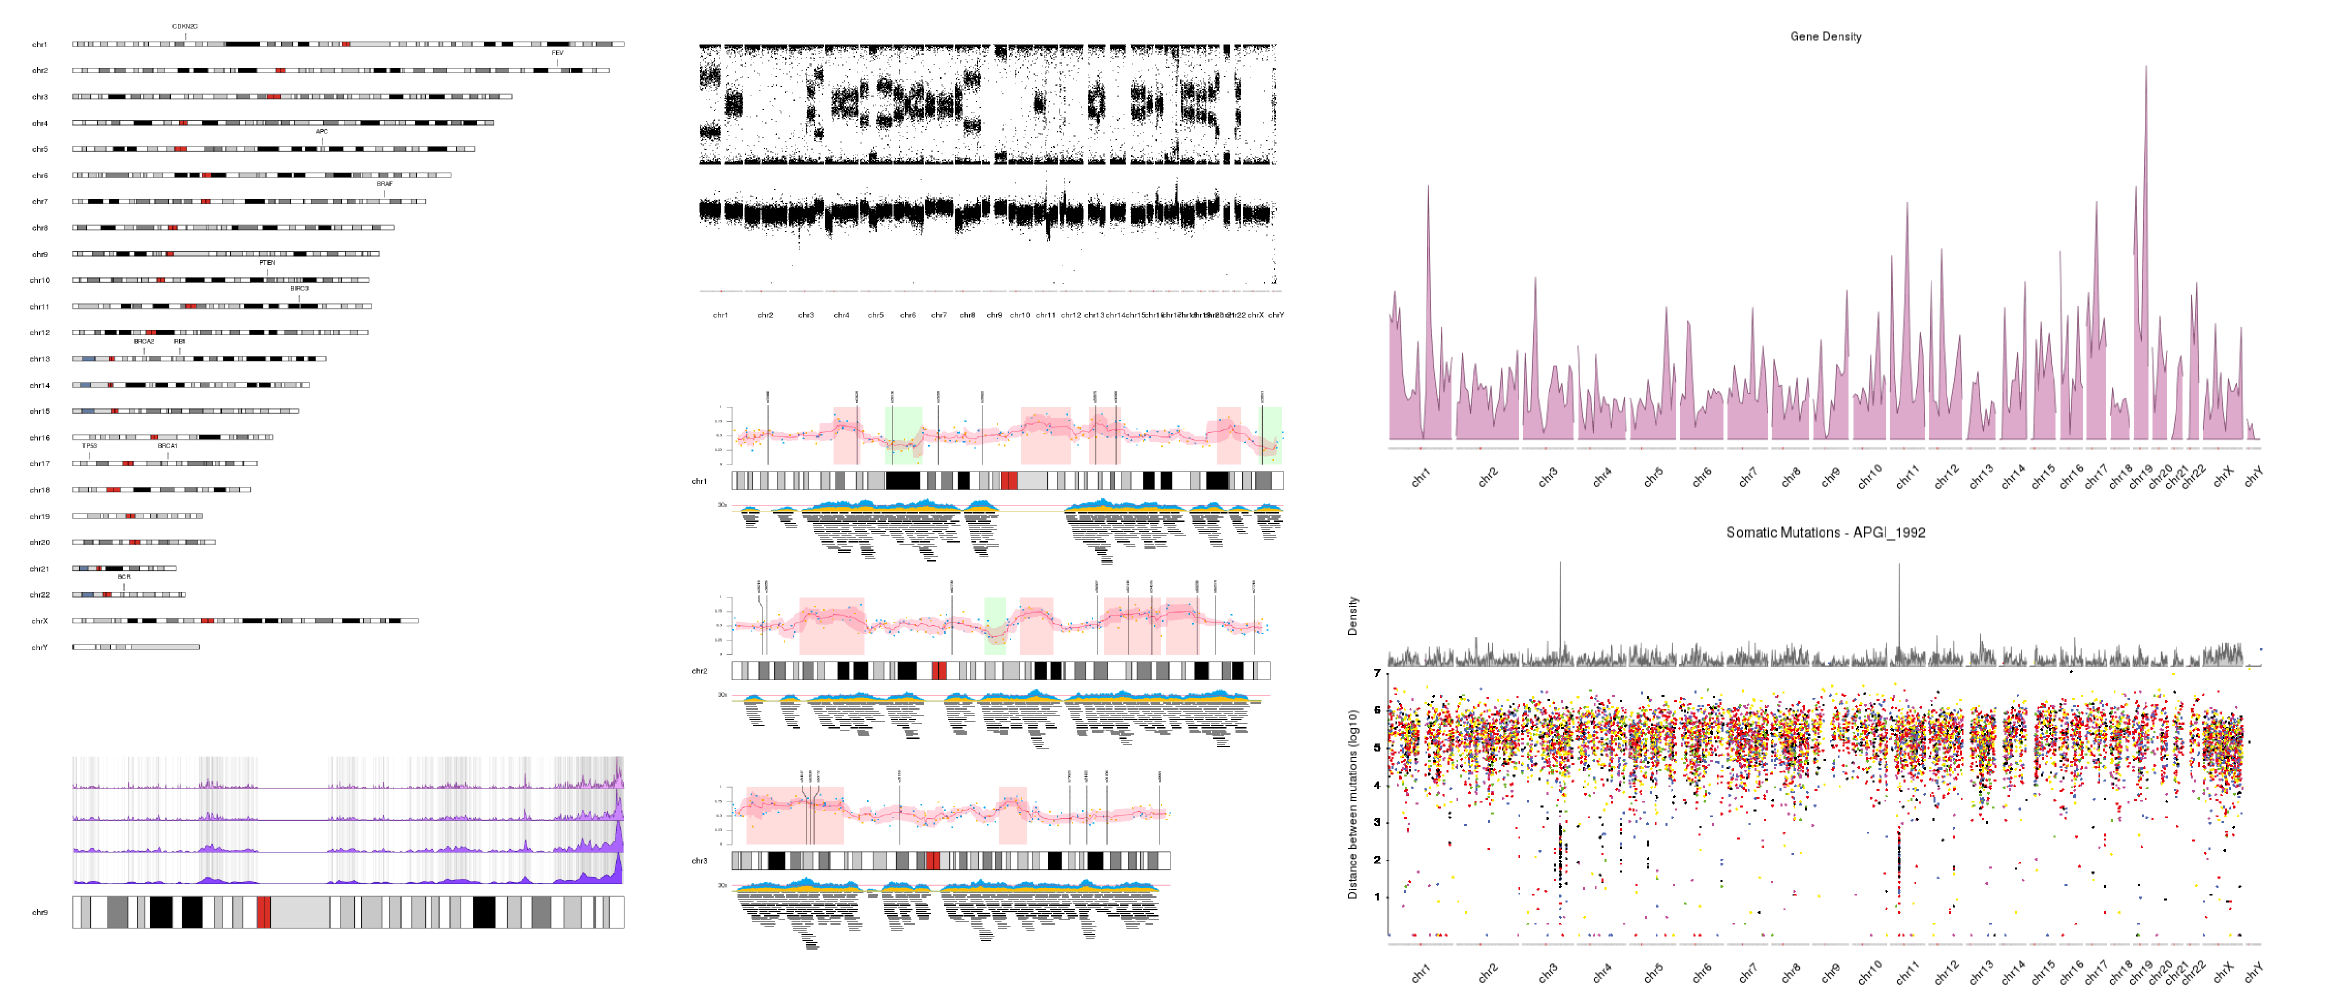

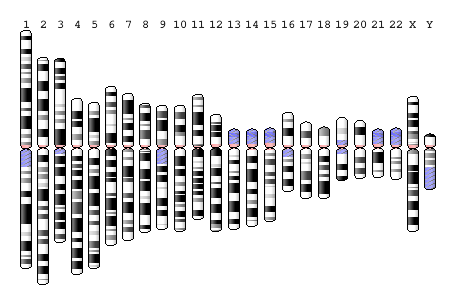
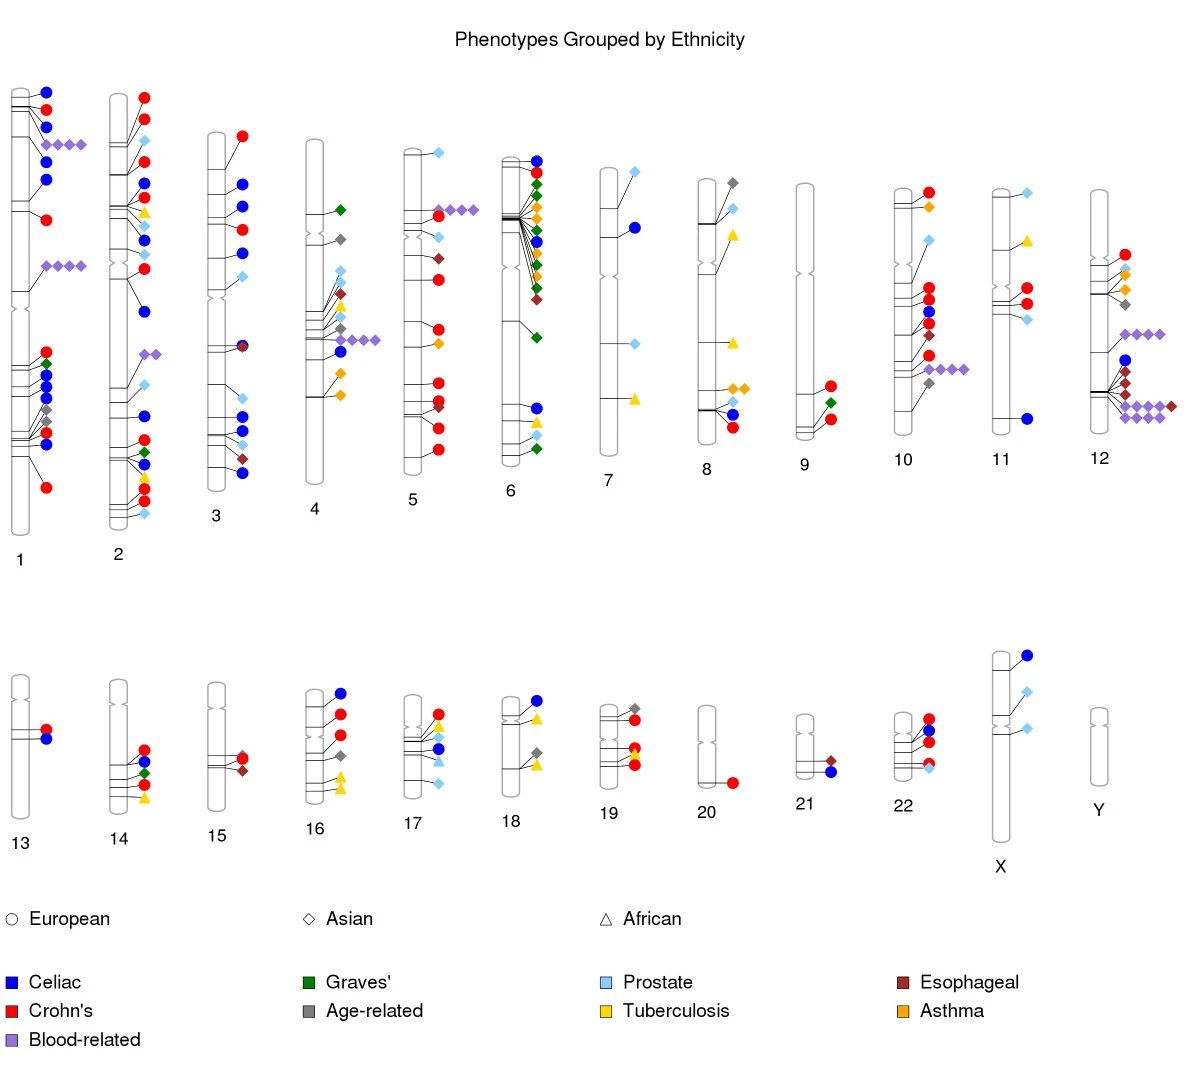
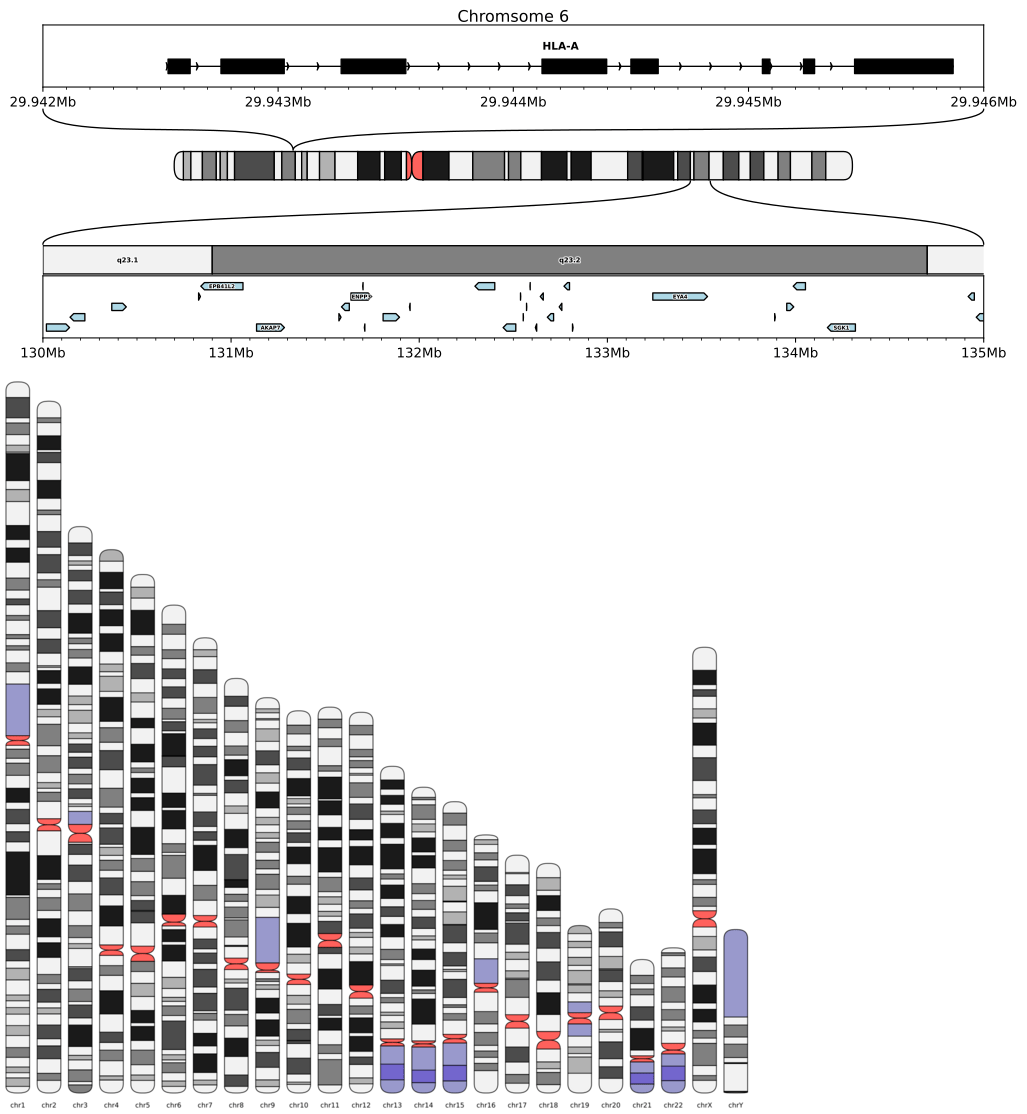
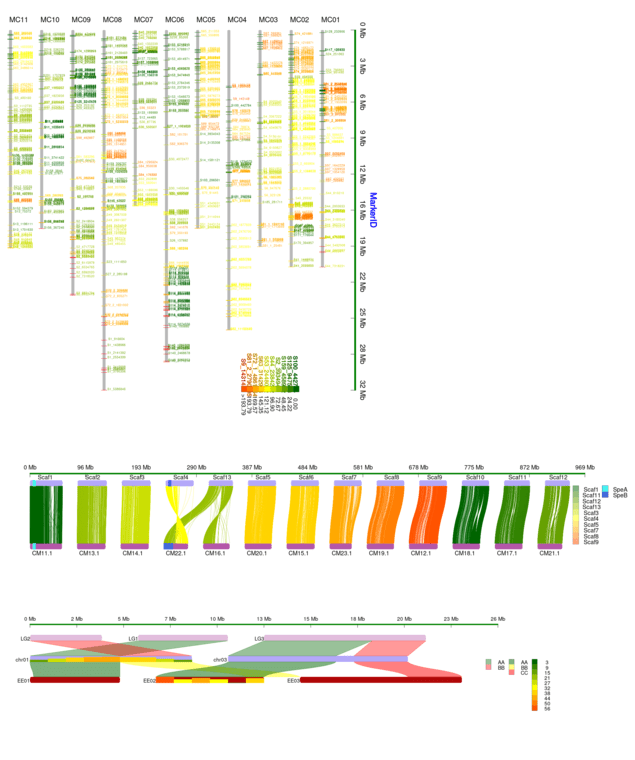
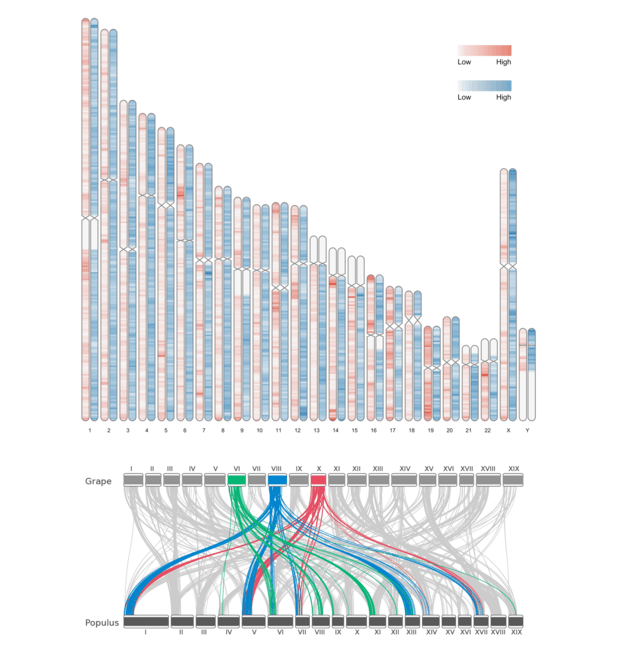
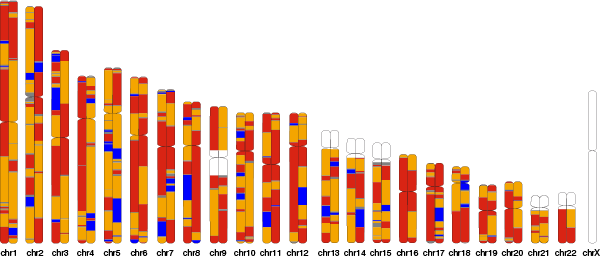
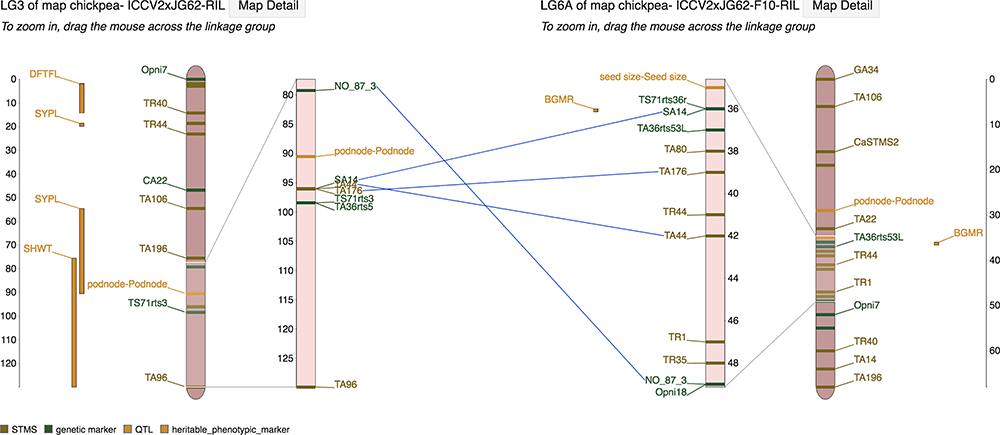
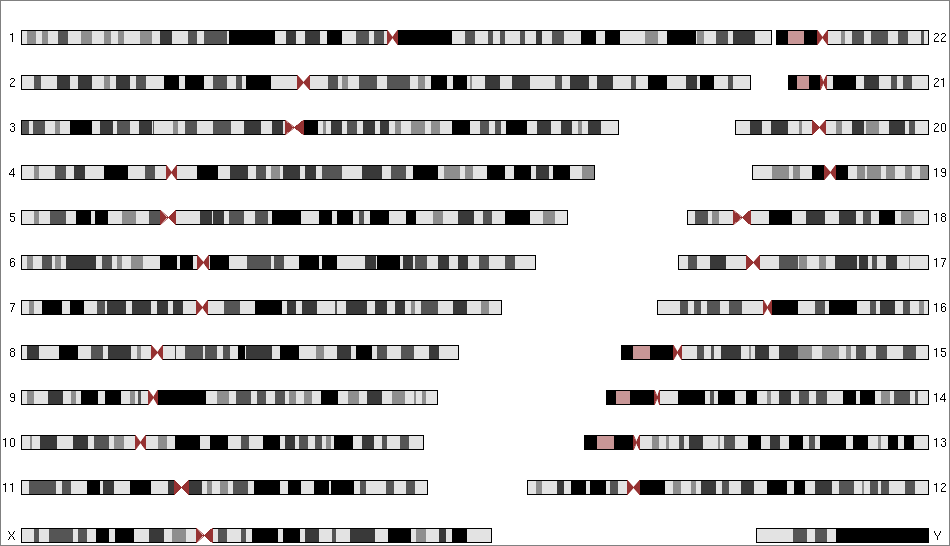
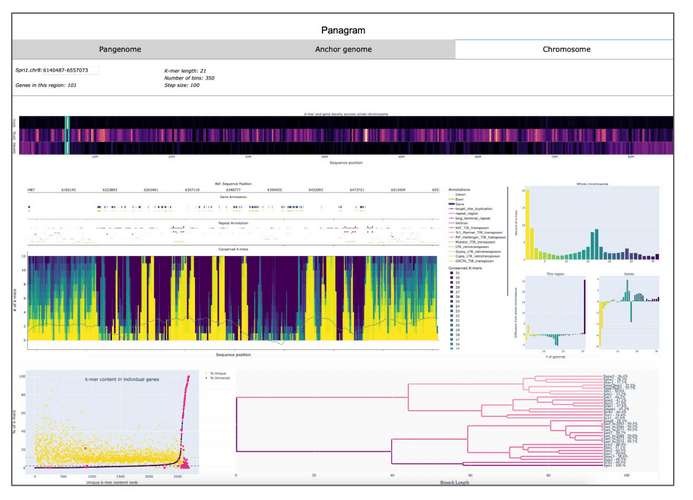
- DnaFeaturesViewer (See also https://github.com/Edinburgh-Genome-Foundry/Caravagene) (img)
- DNAPlotLib (img)
- EasyFig (img)
- GECO (img)
- GIVE (img)
- Gnomad browser (img)
- LinearDisplay.pl (readme says to cite this paper) (img)
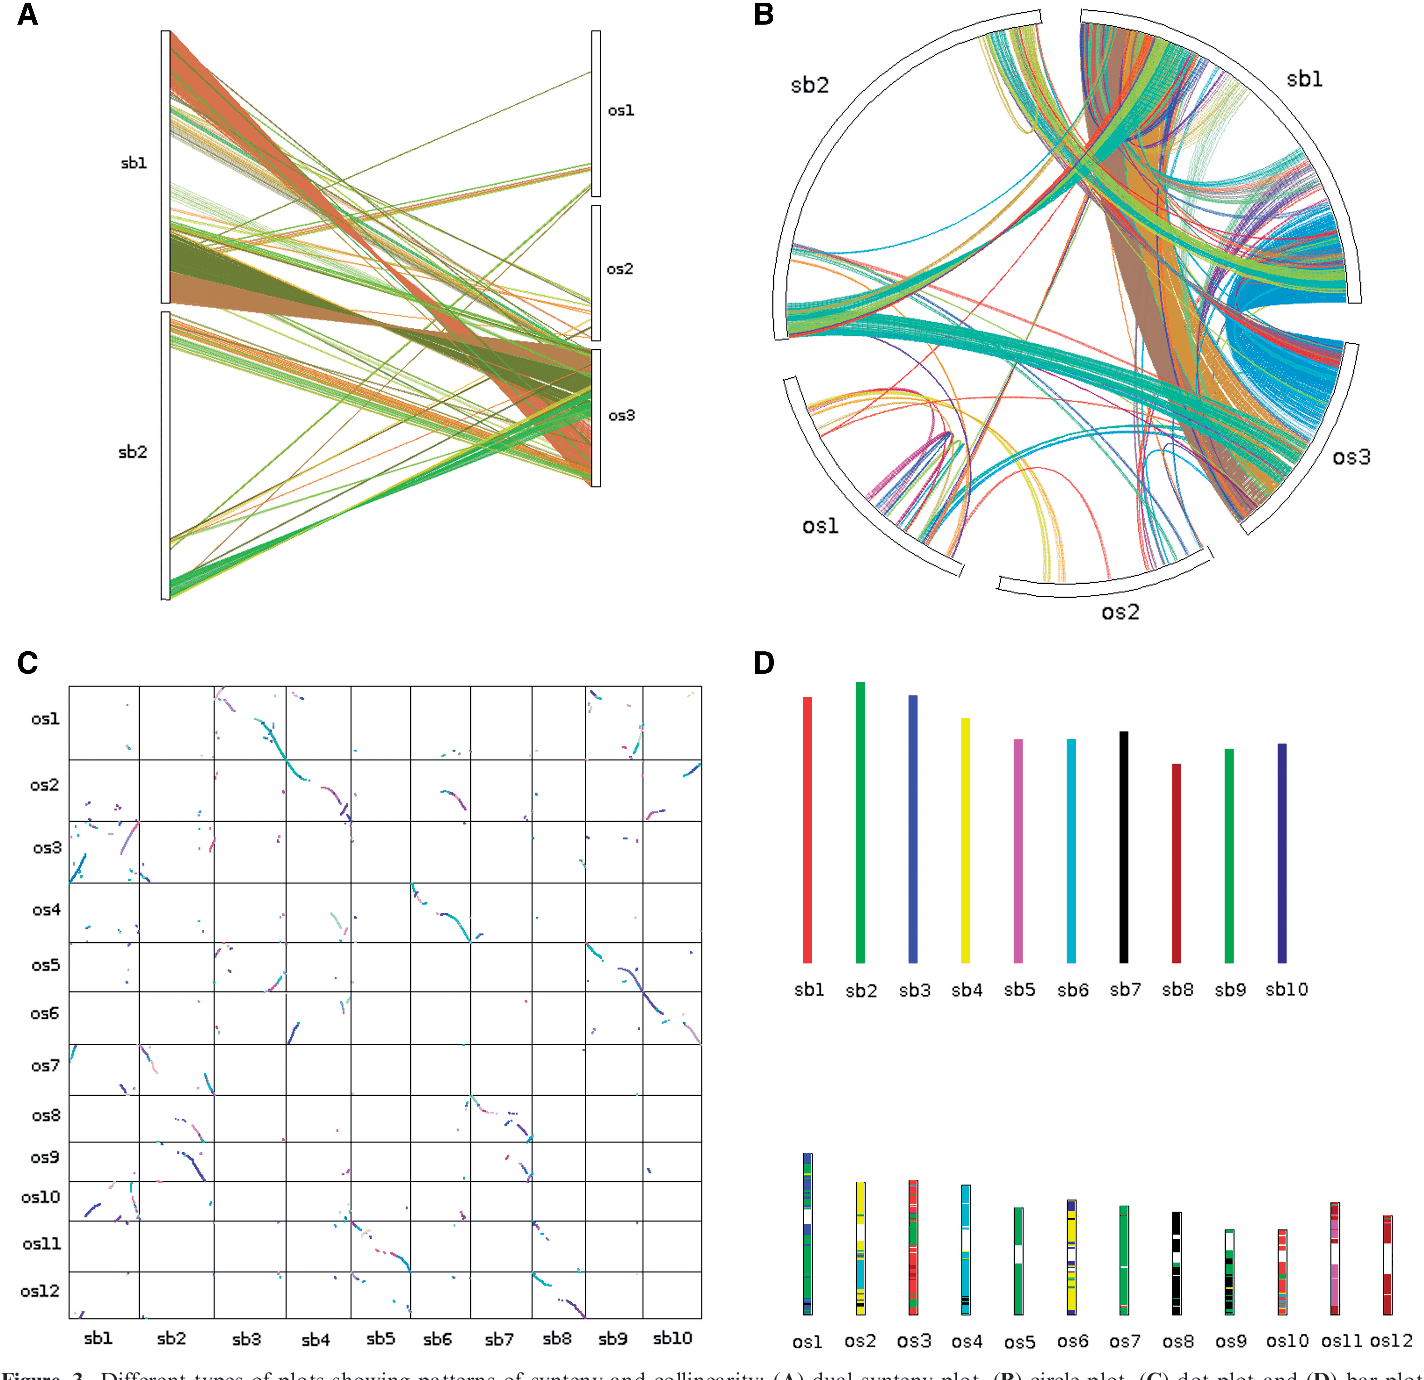
- SynVisio (img)
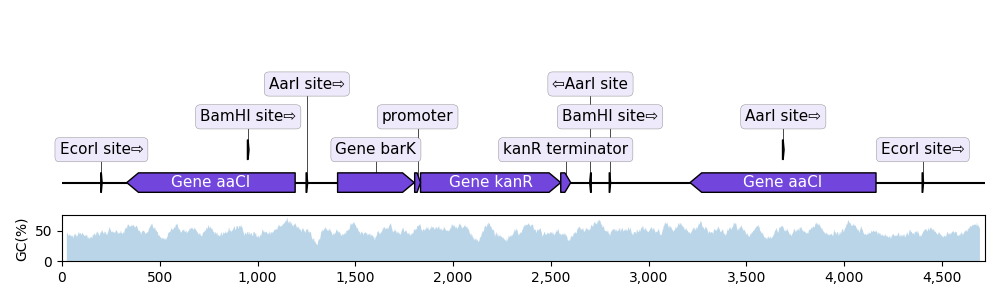
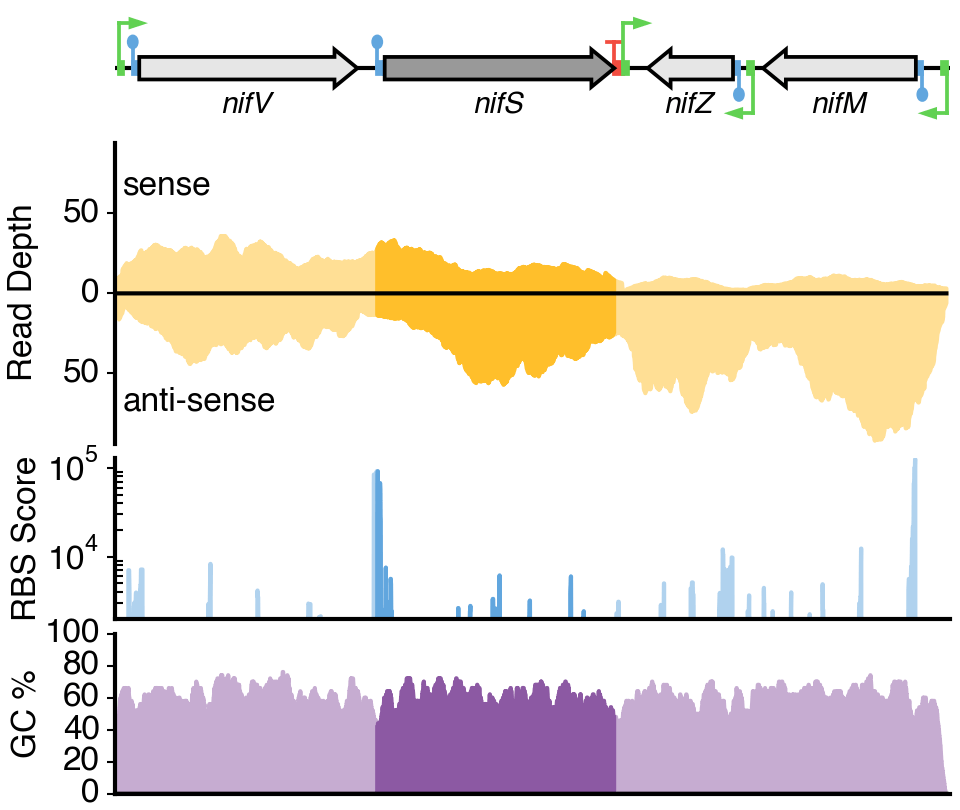
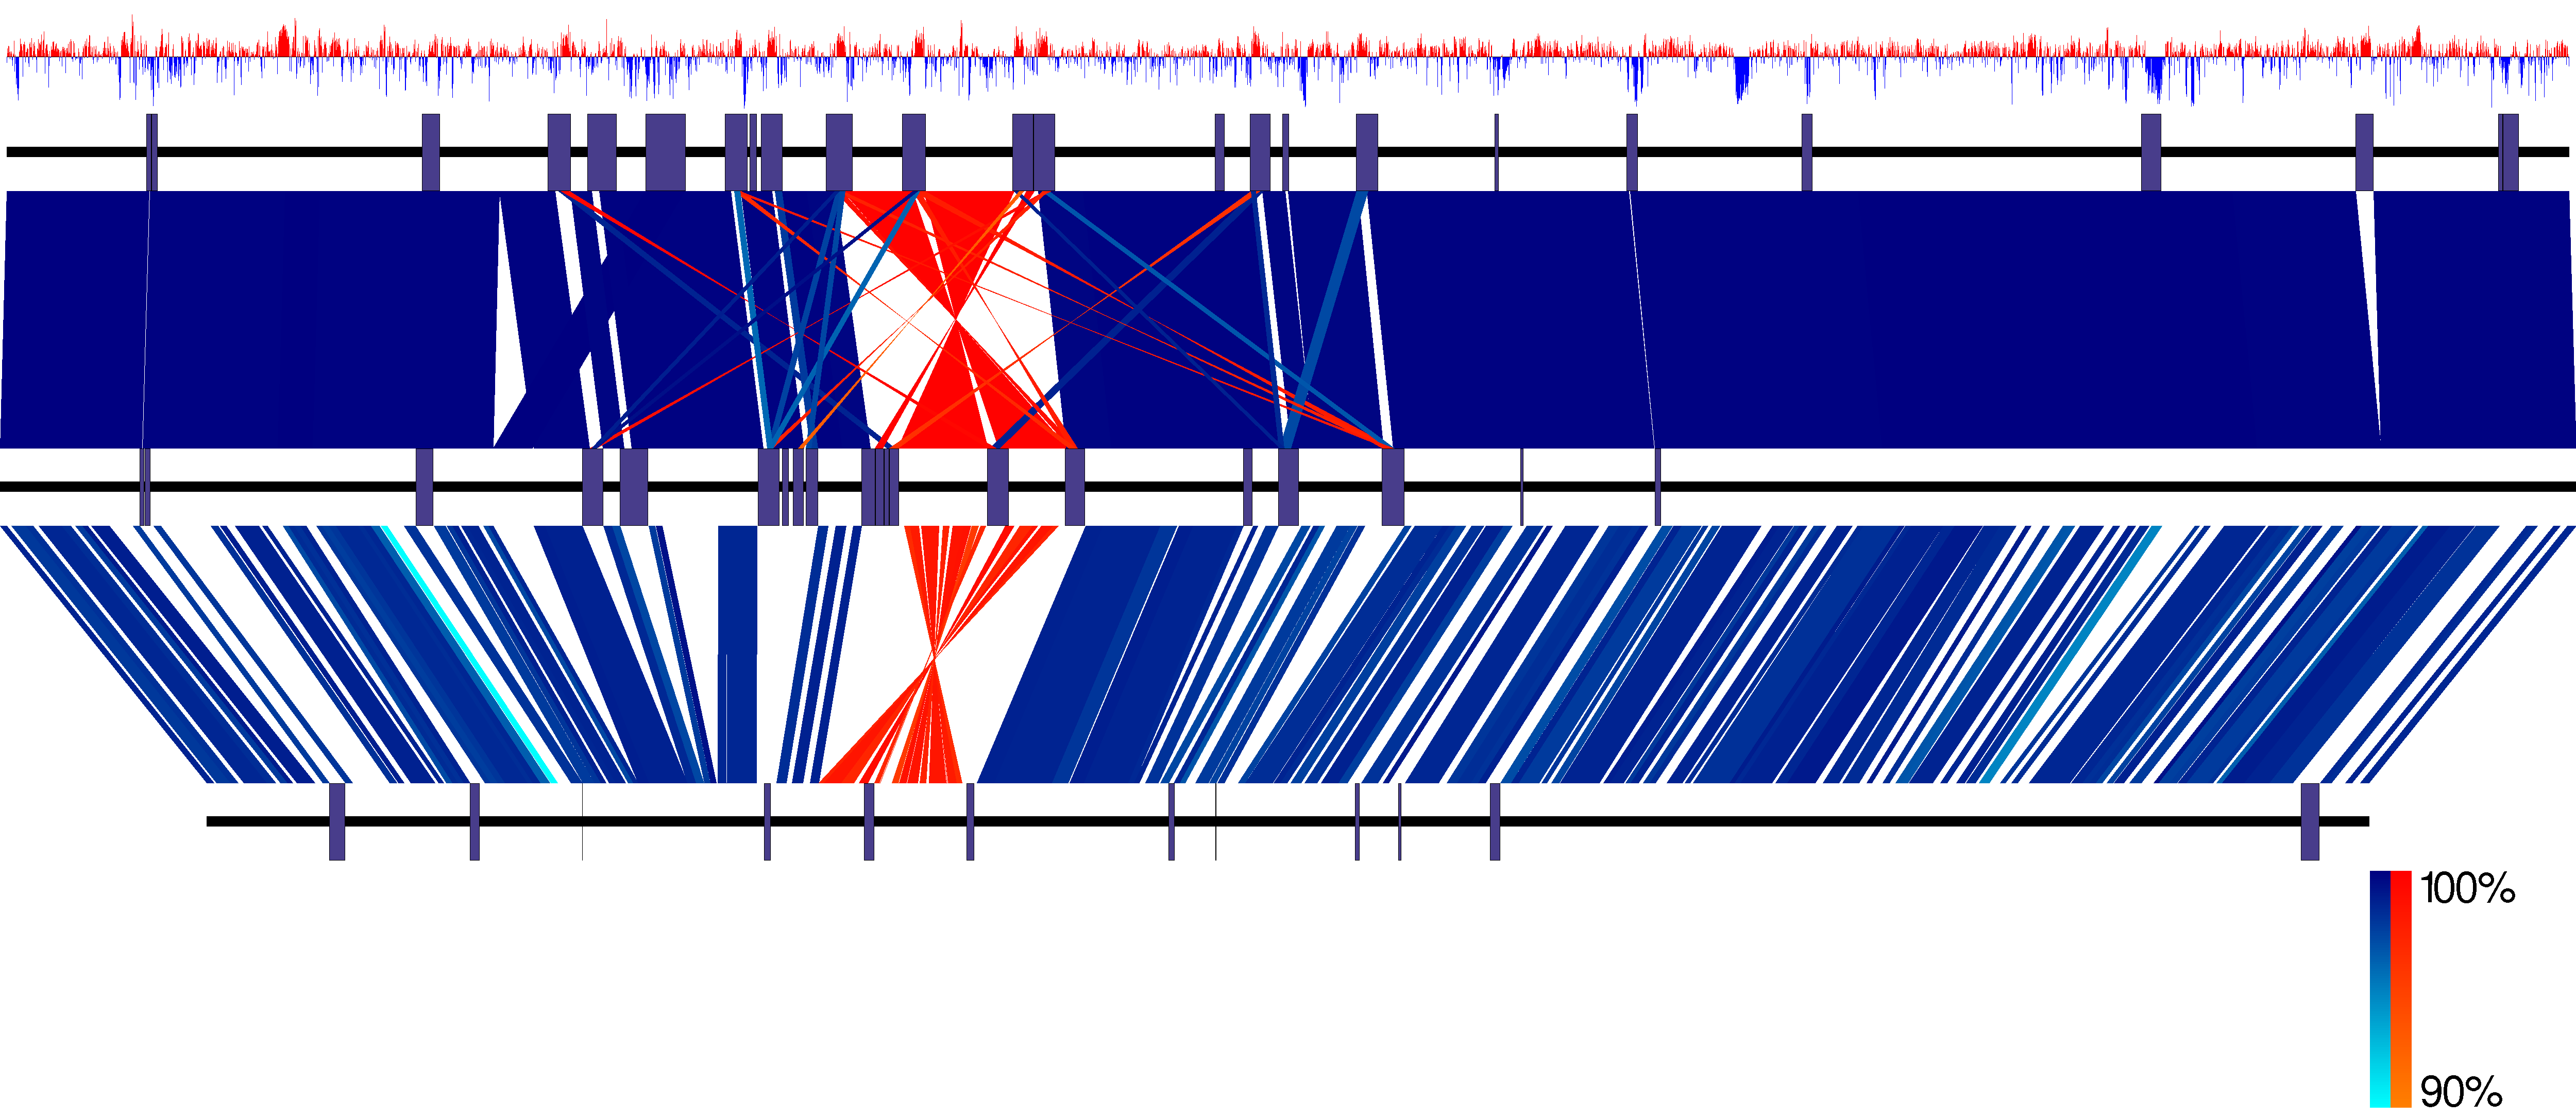
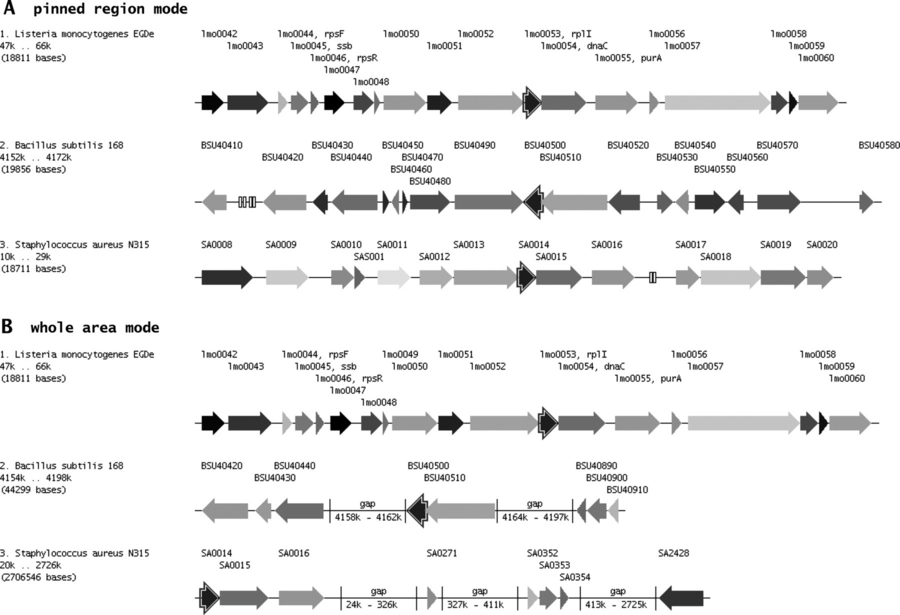
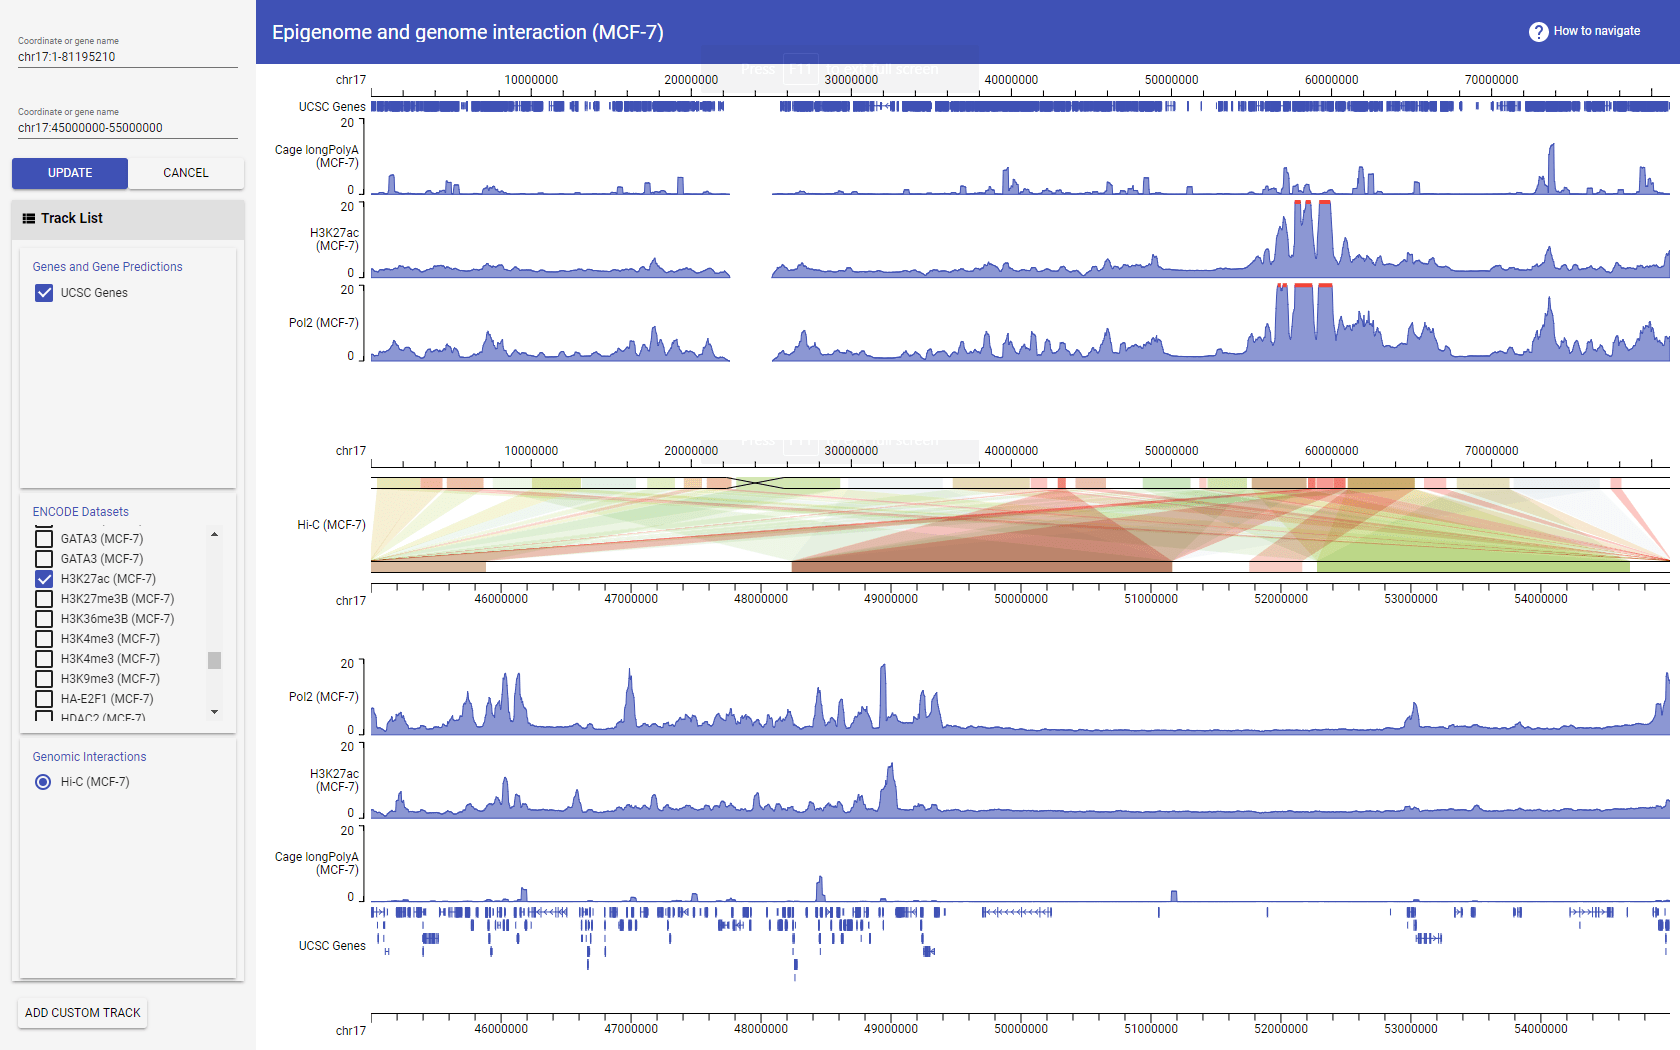
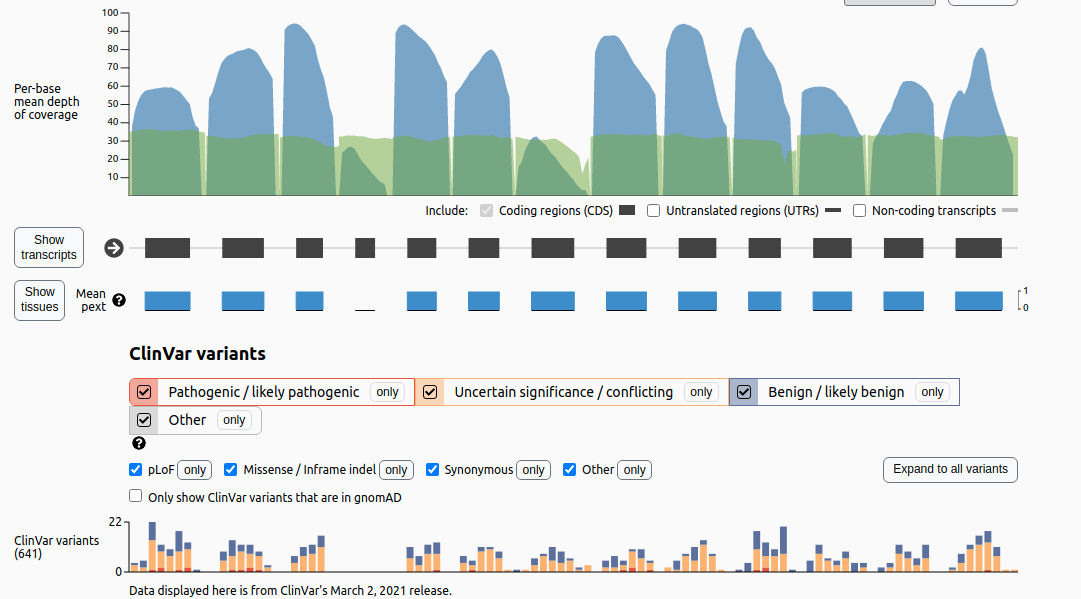
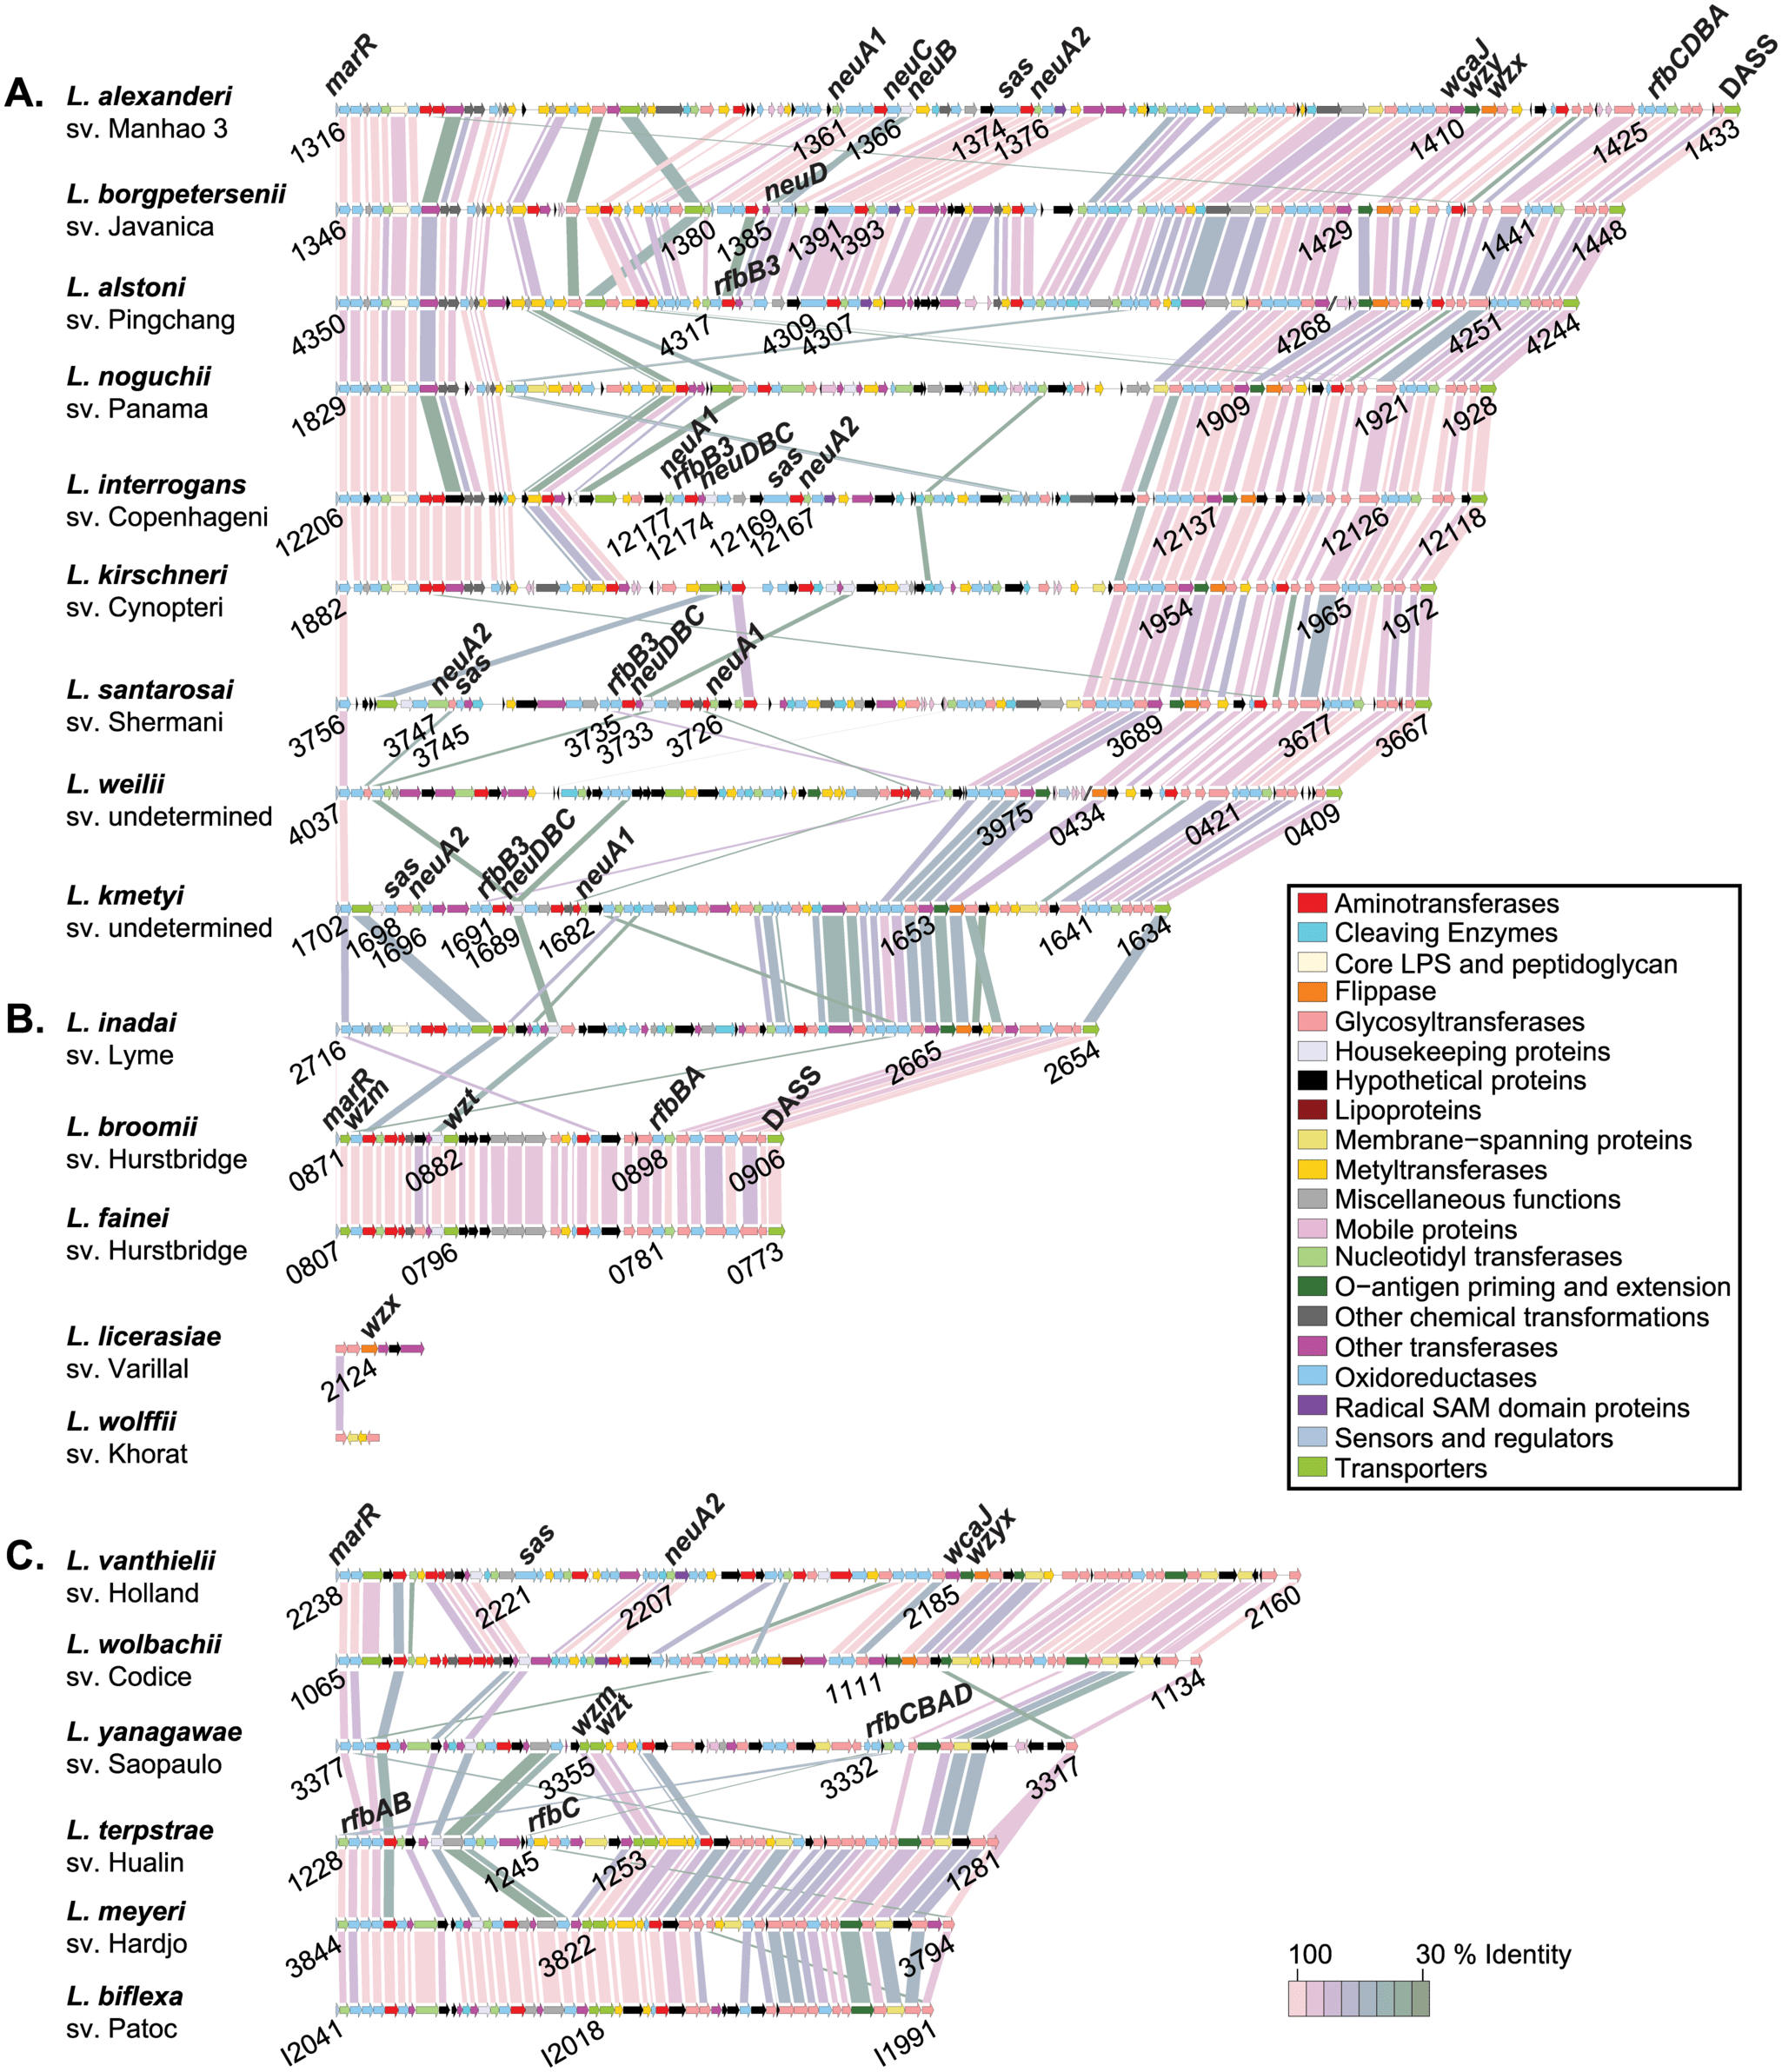
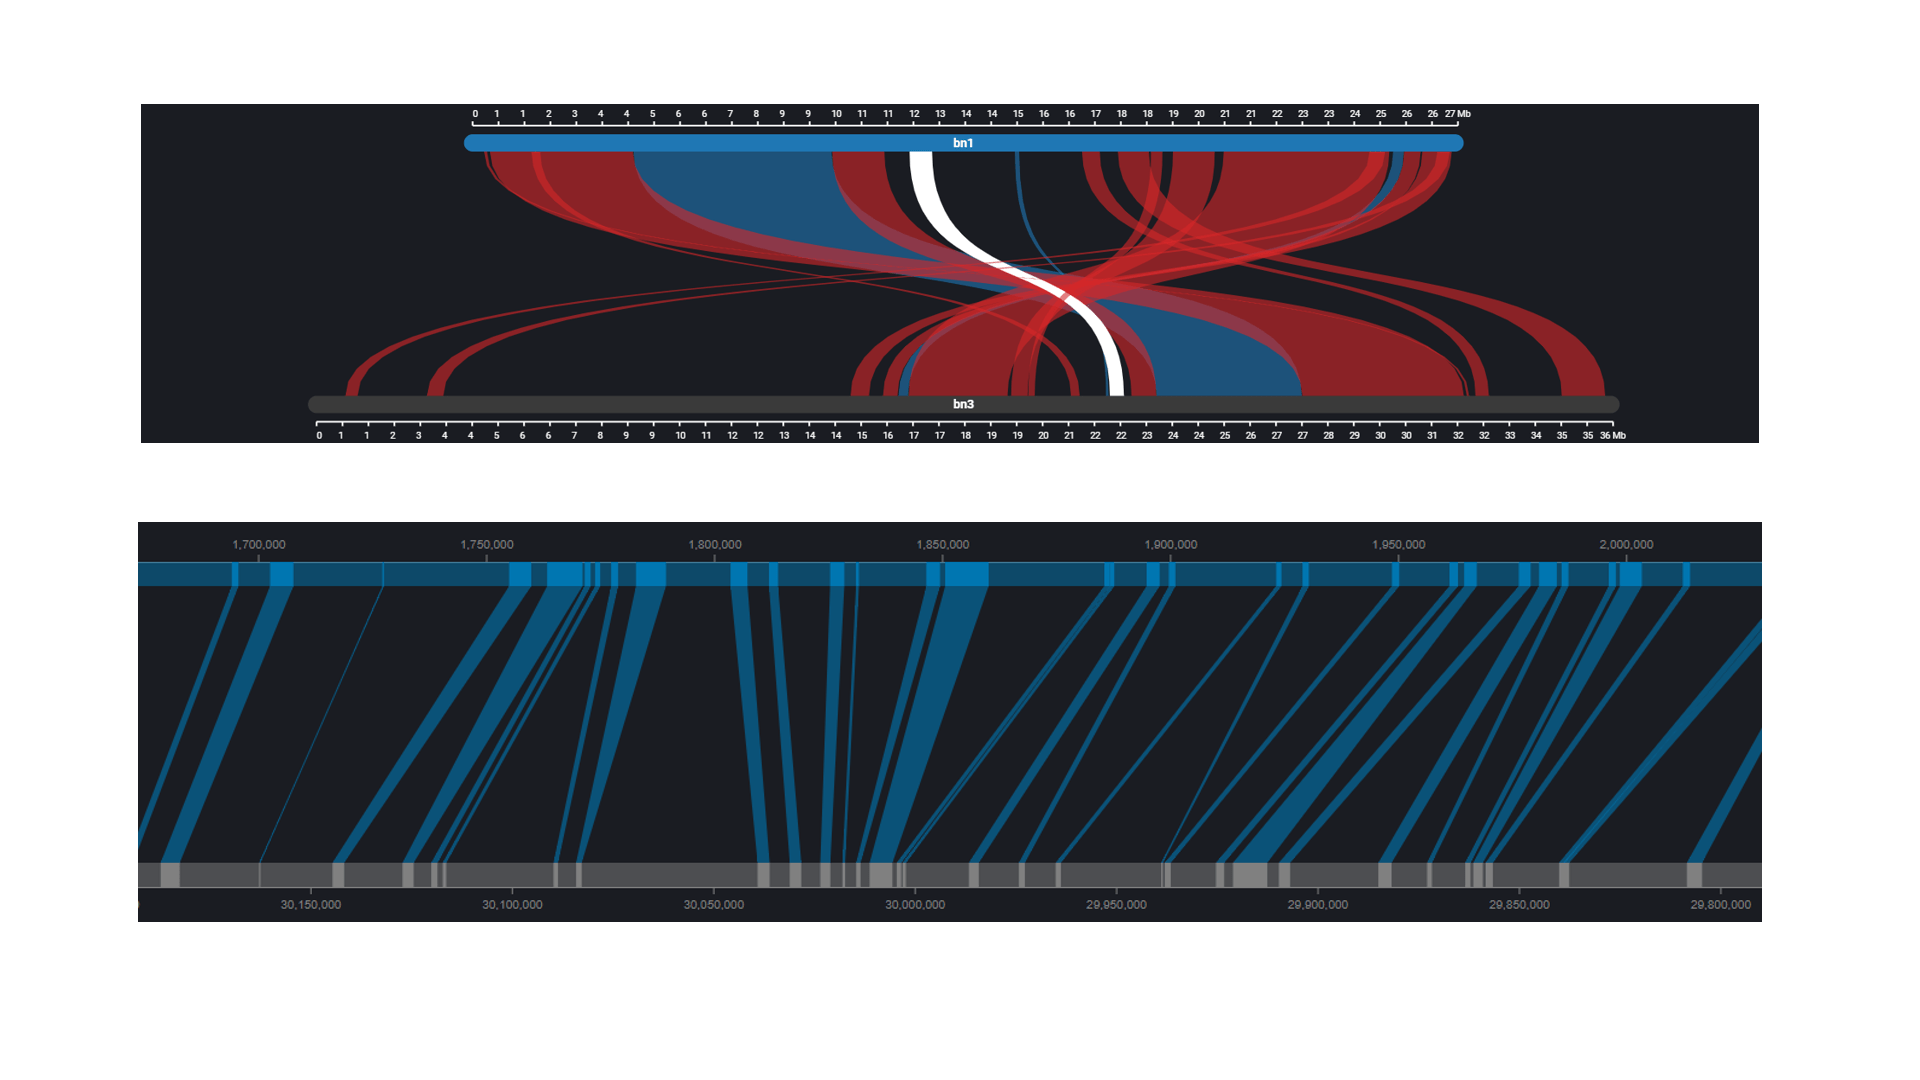
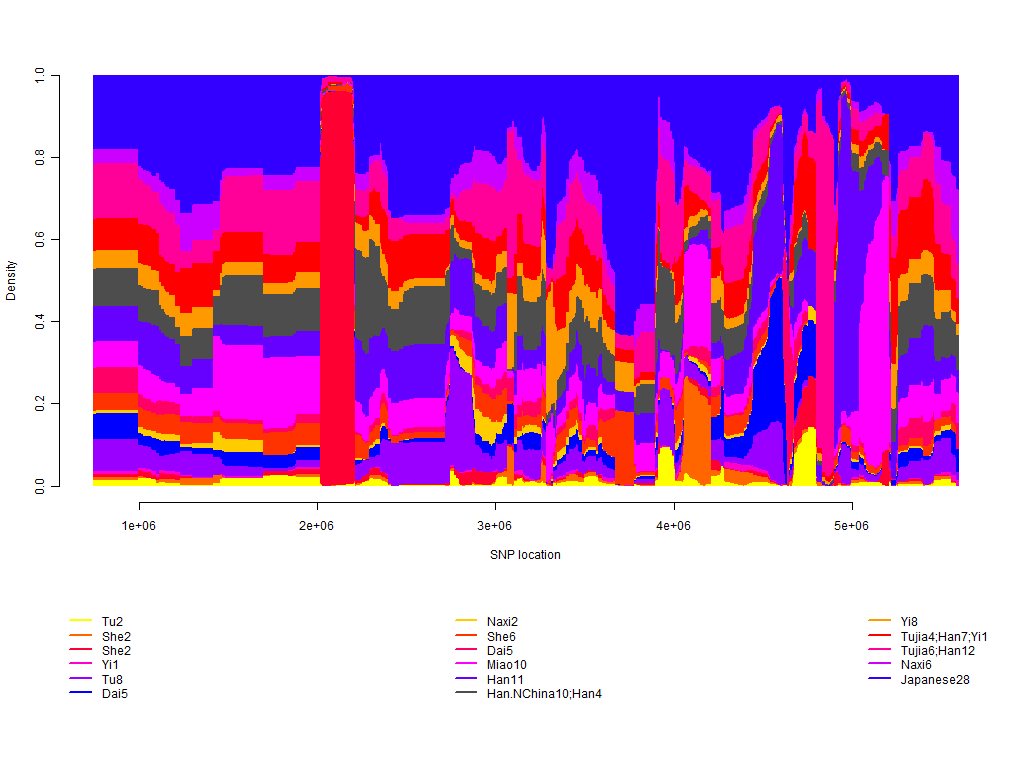
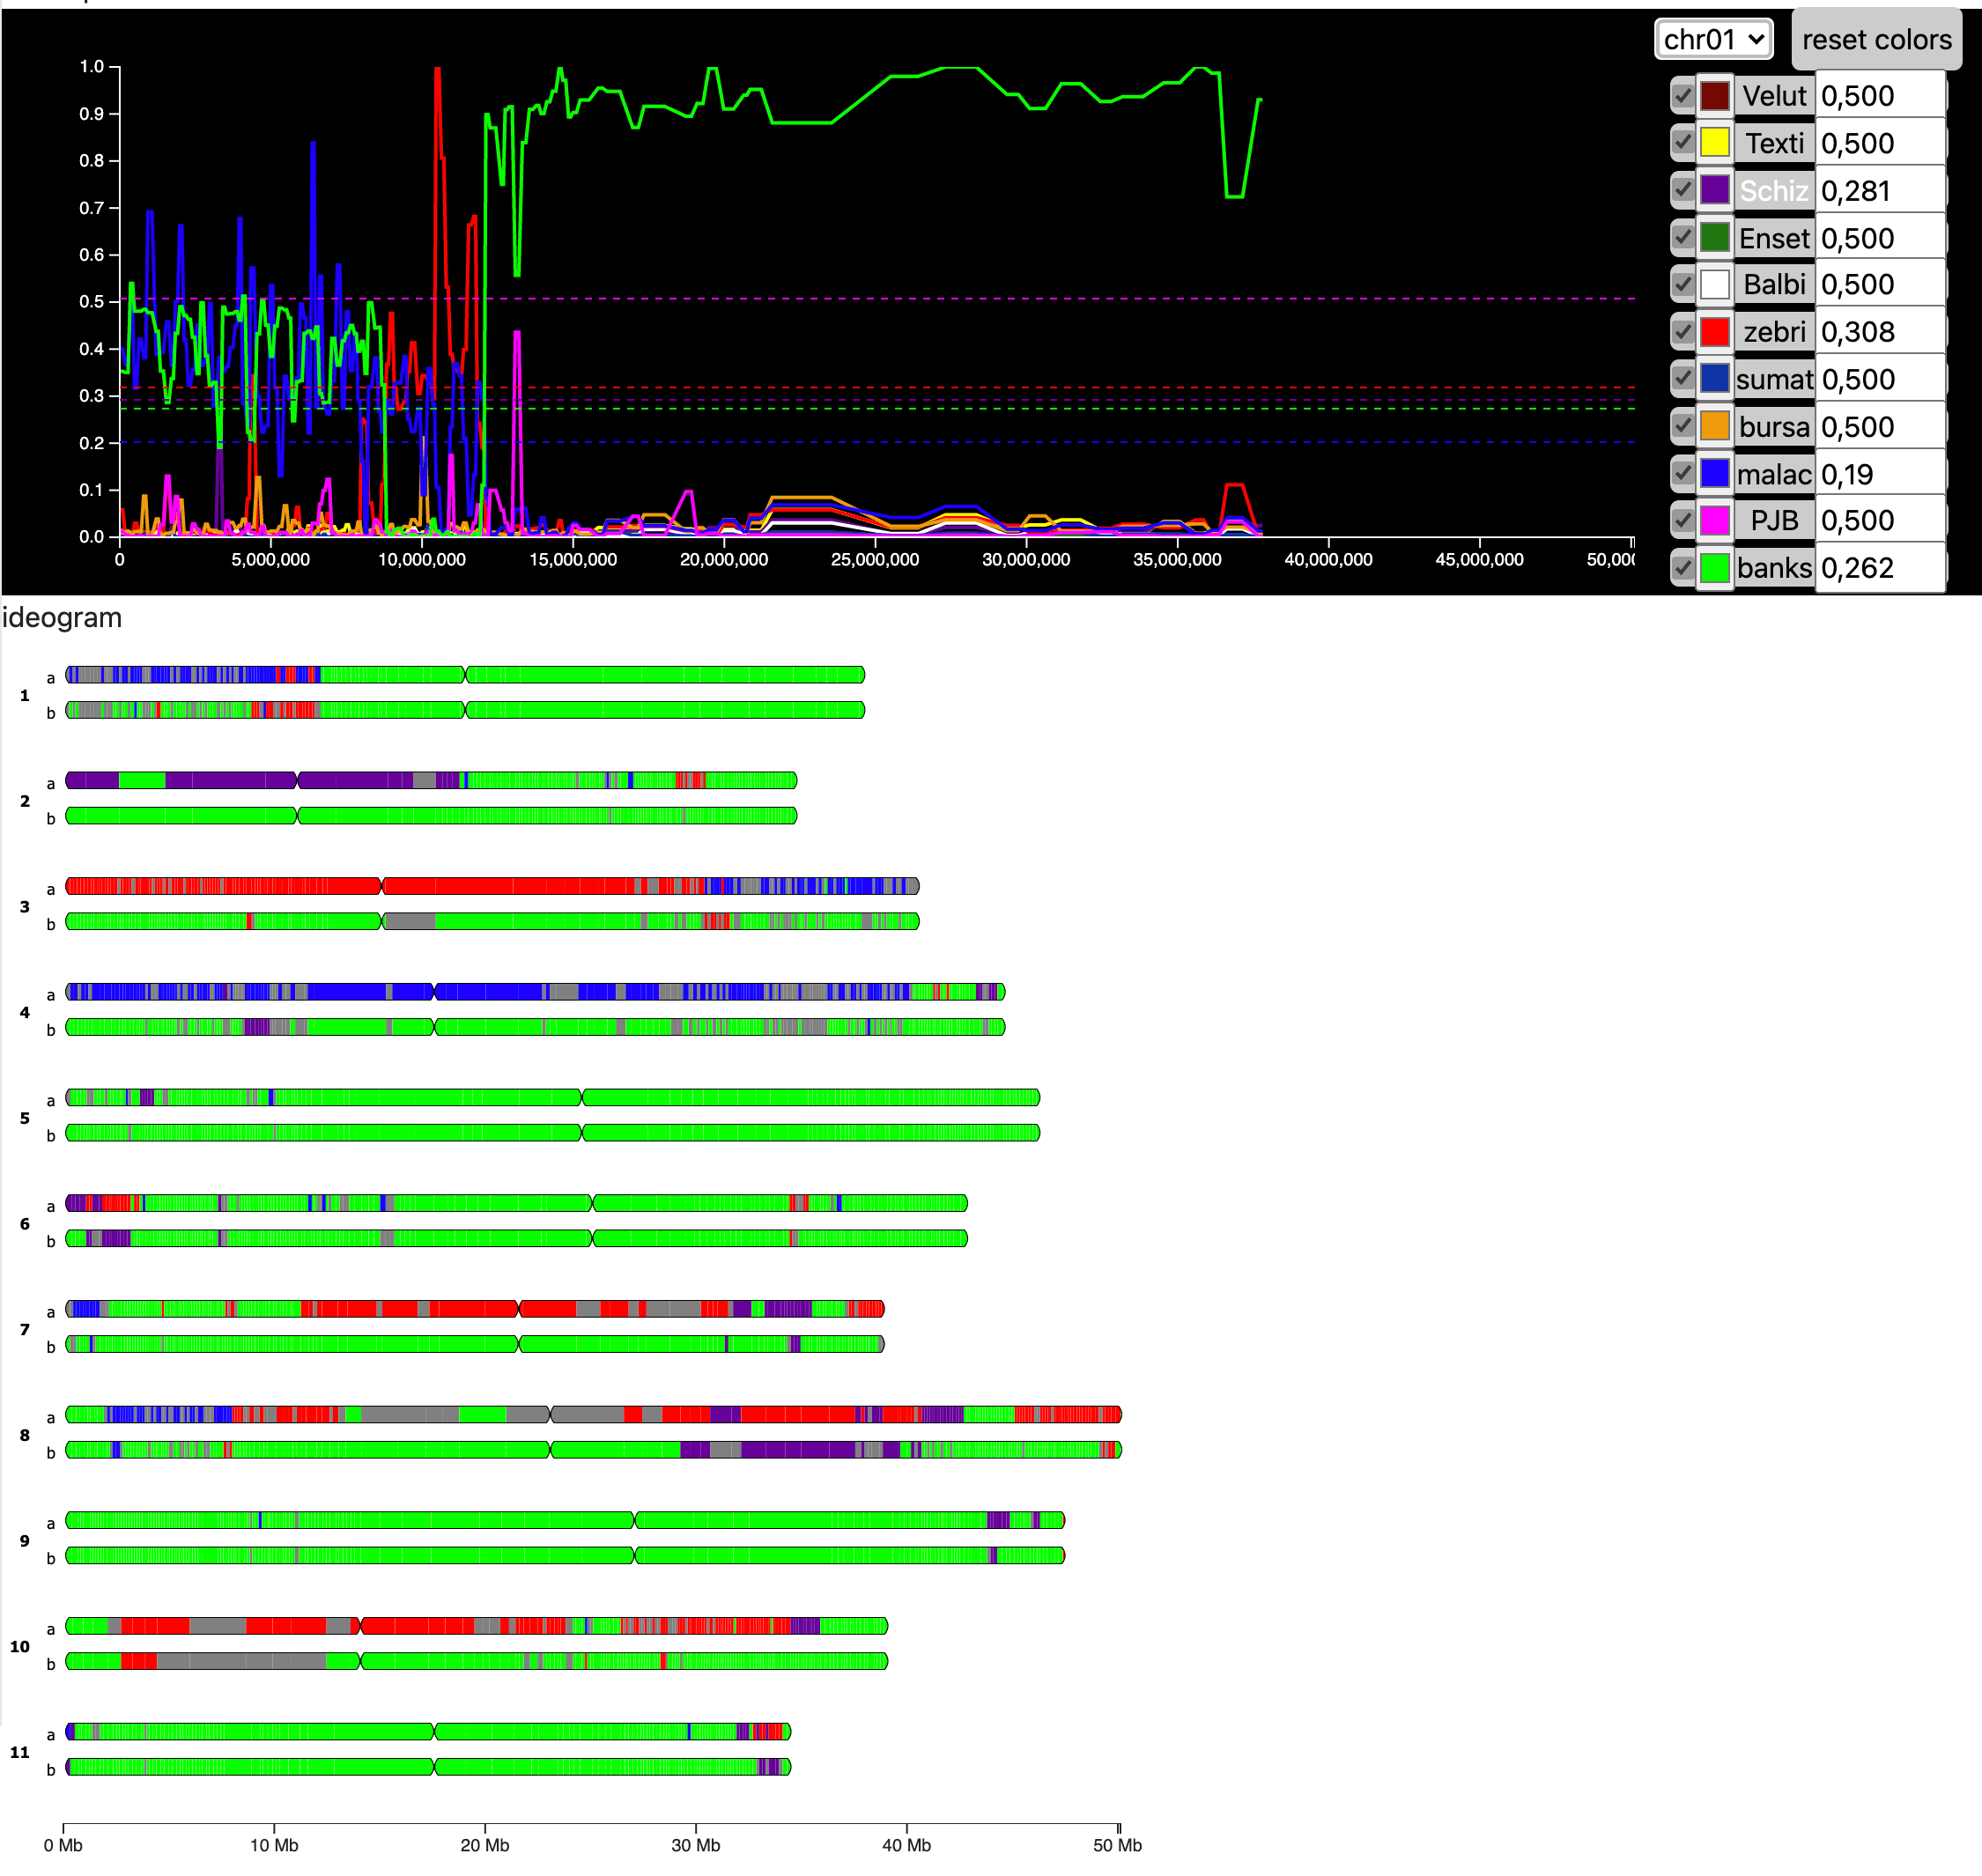
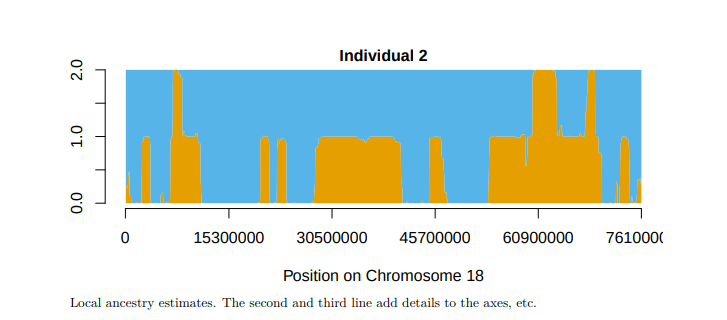
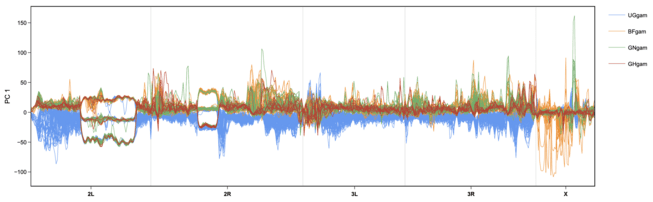
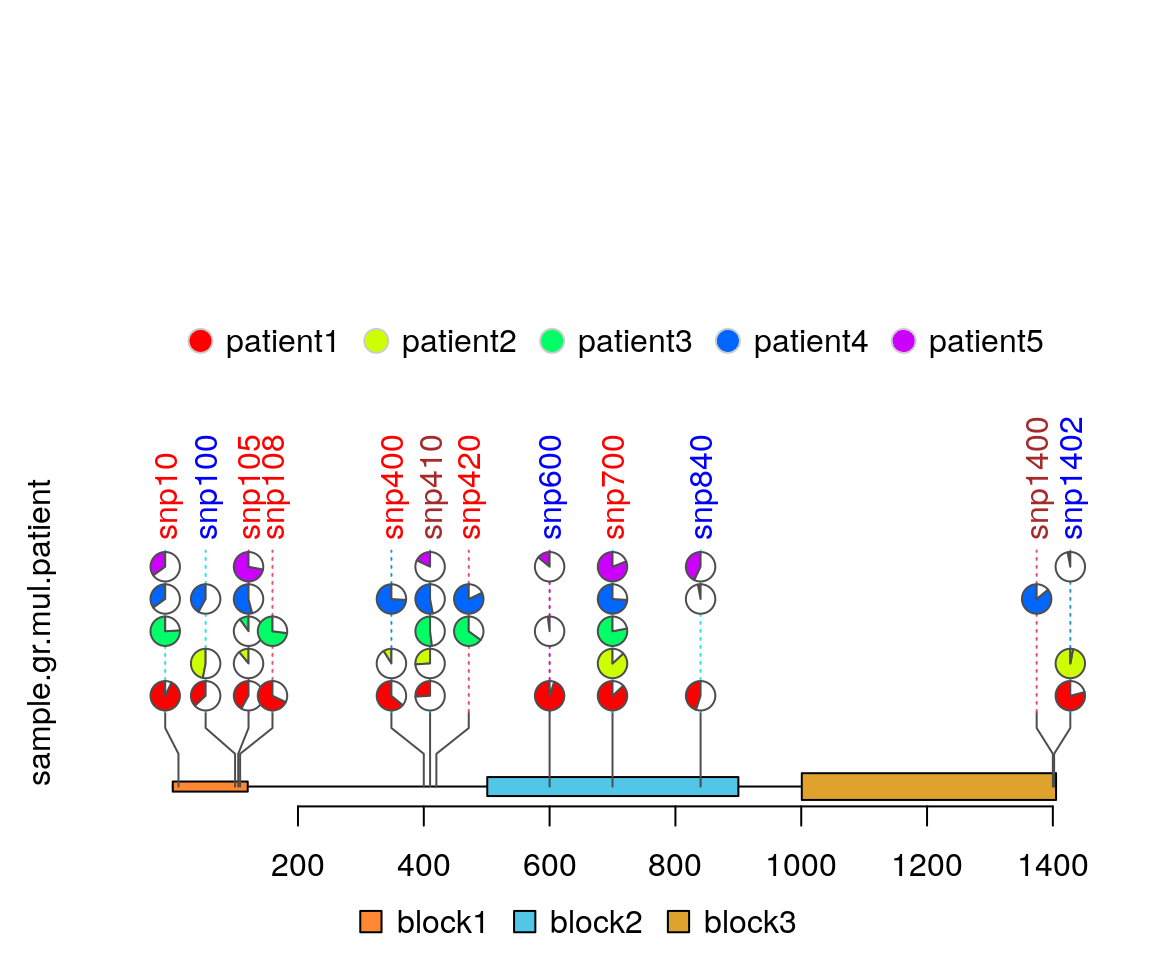
- CurrentView (Visualize and compare nanopore ionic current signals from POD5 files aligned to a reference via BAM. Overlay conditions, run statistics, GMM fitting, and UMAP, with an optional Dash web app.) (img)
- methylartist (img)
- SeqSizzle (img)
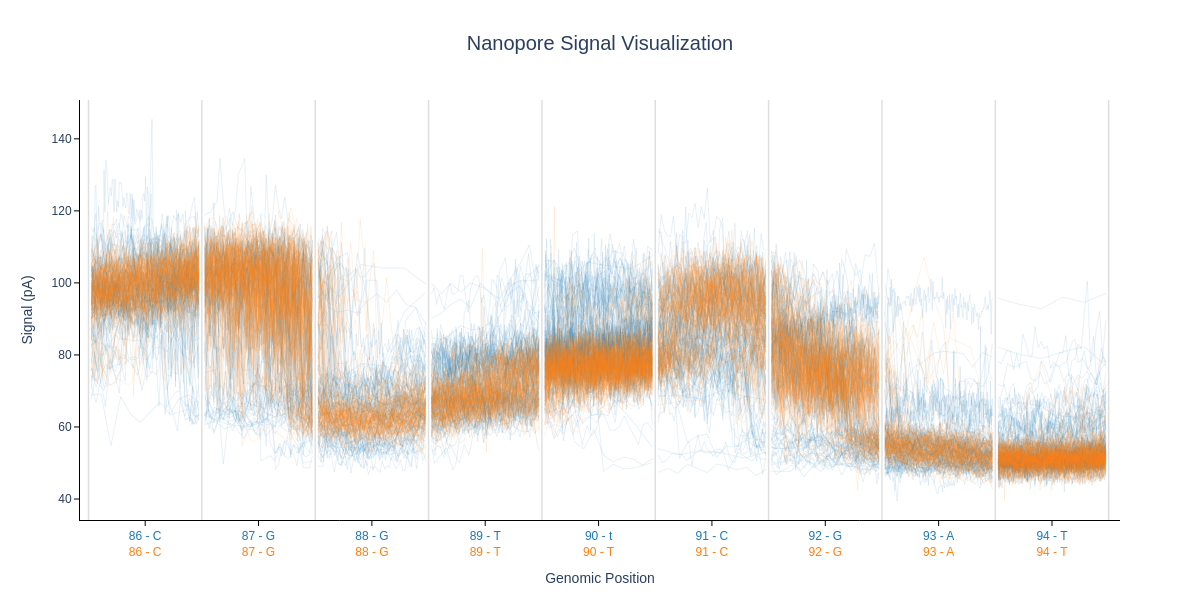
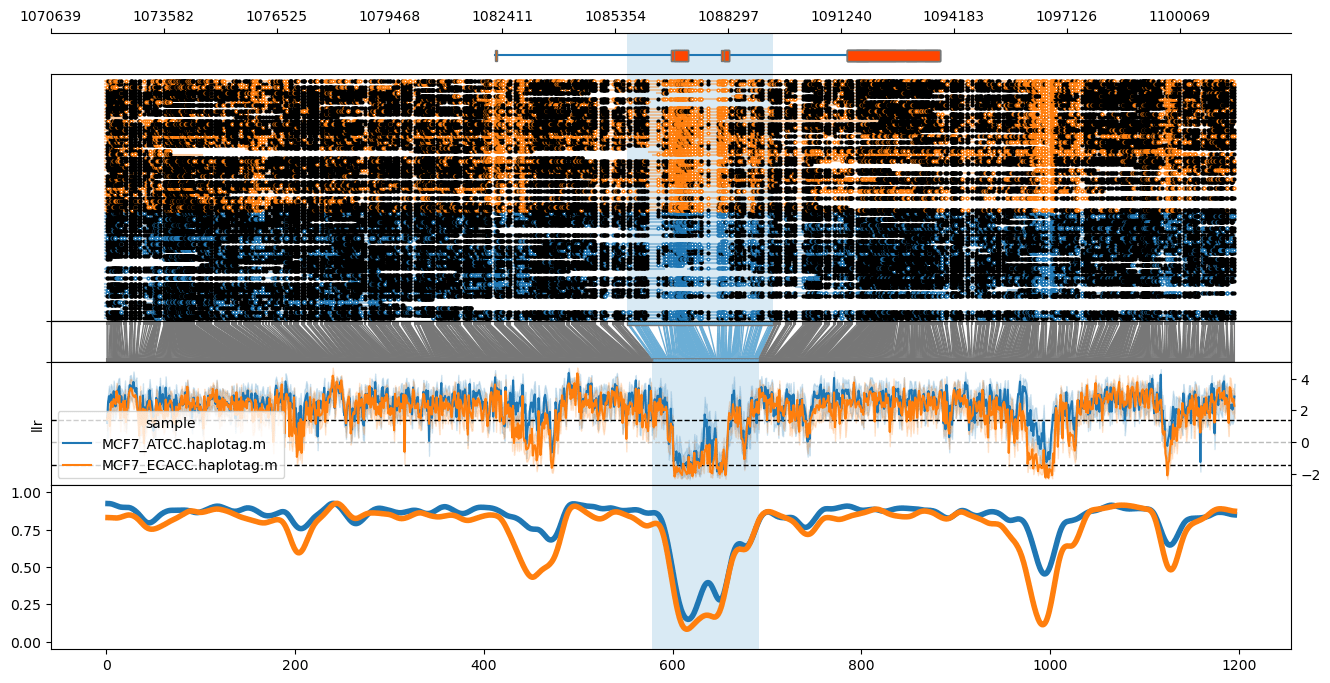

- ggwas (img)
- locuszoomr (See also easylabel for manhattan plots https://cran.r-project.org/web/packages/easylabel/vignettes/easylabel.html) (img)
- topr (Includes locuszoom style plot) (img)

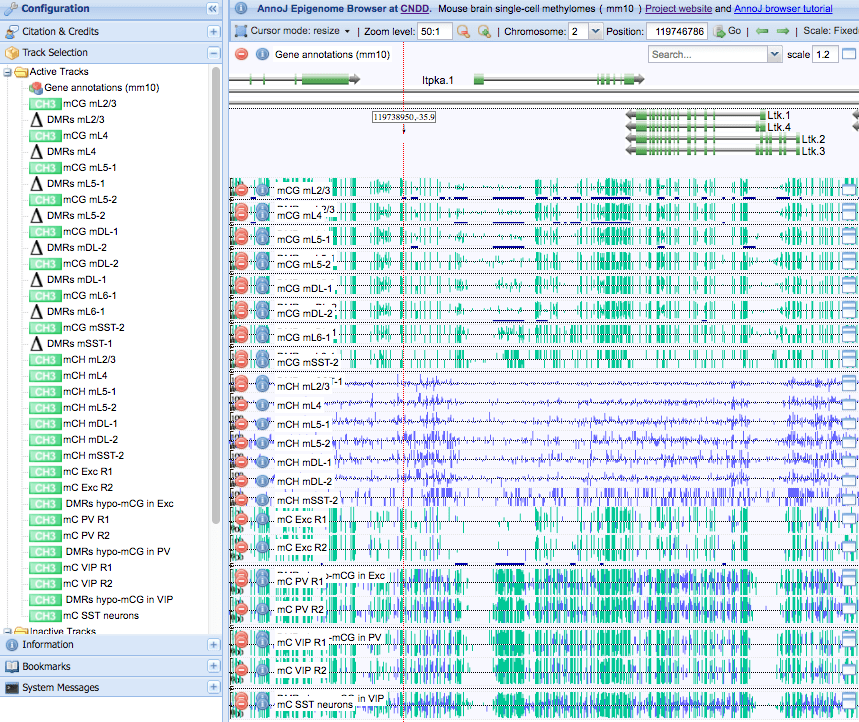
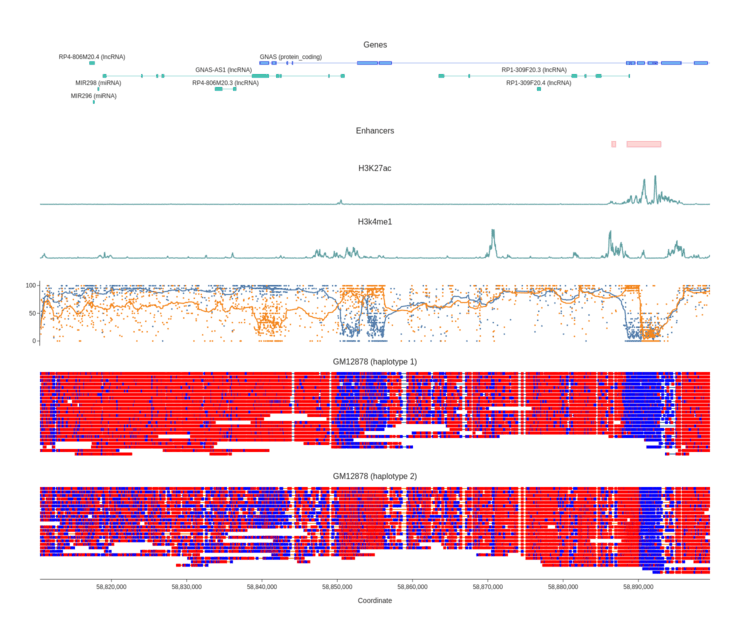
- AnnoJ (See list of instances of the browser here https://ecker.salk.edu/genome-browser/) (img)
- modbamtools (img)
- NanoMethViz (img)
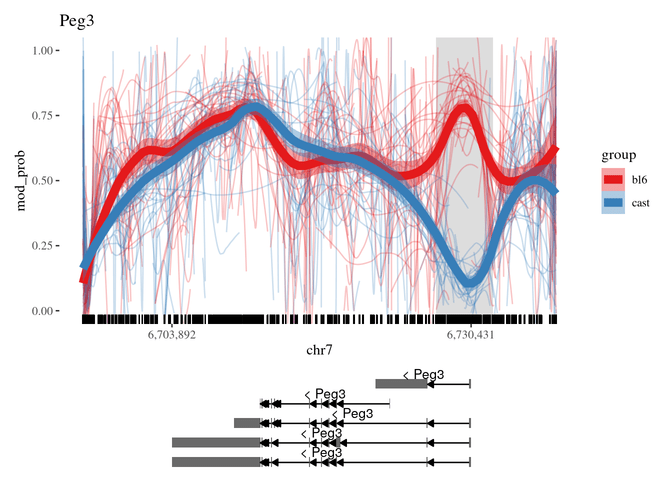
- FastANI (img)
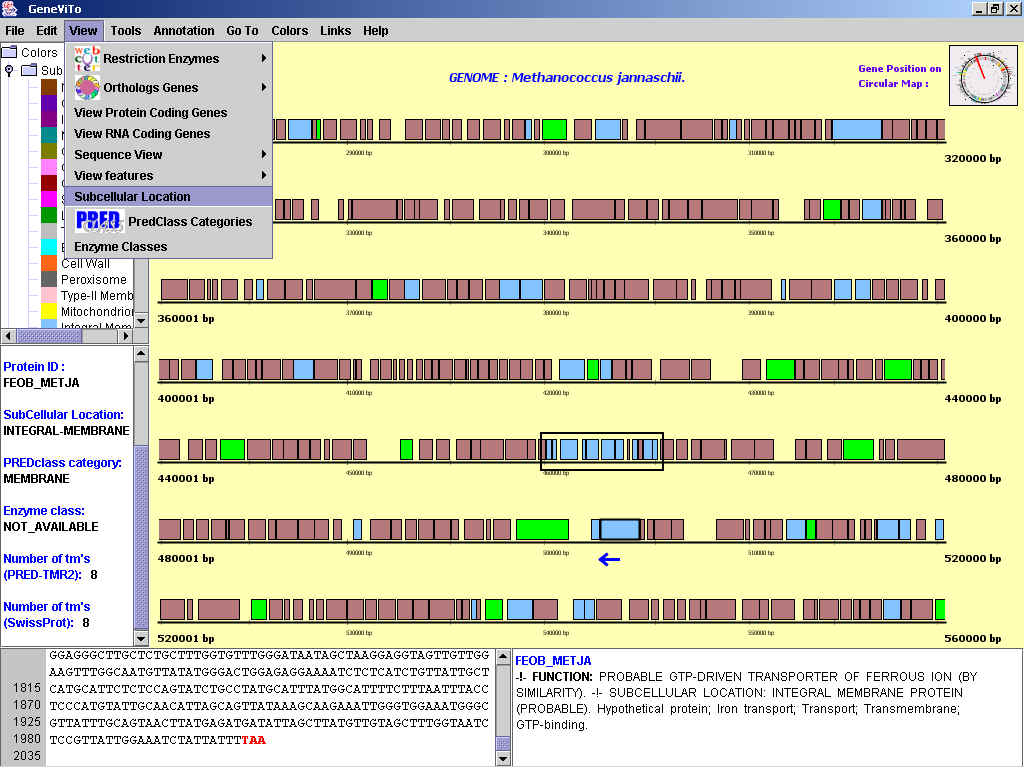
- GeneViTo (img)
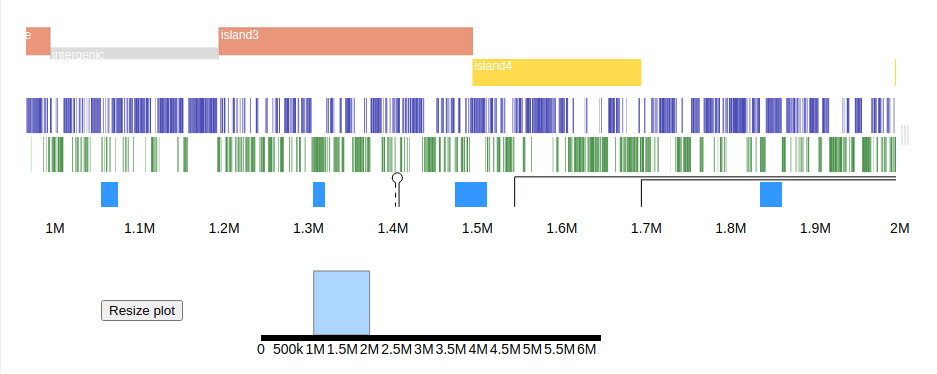
- IslandViewer and IslandPlot (web app using it here https://pathogenomics.sfu.ca/islandviewer uses D3, SVG) (img)
- lovis4u (img)
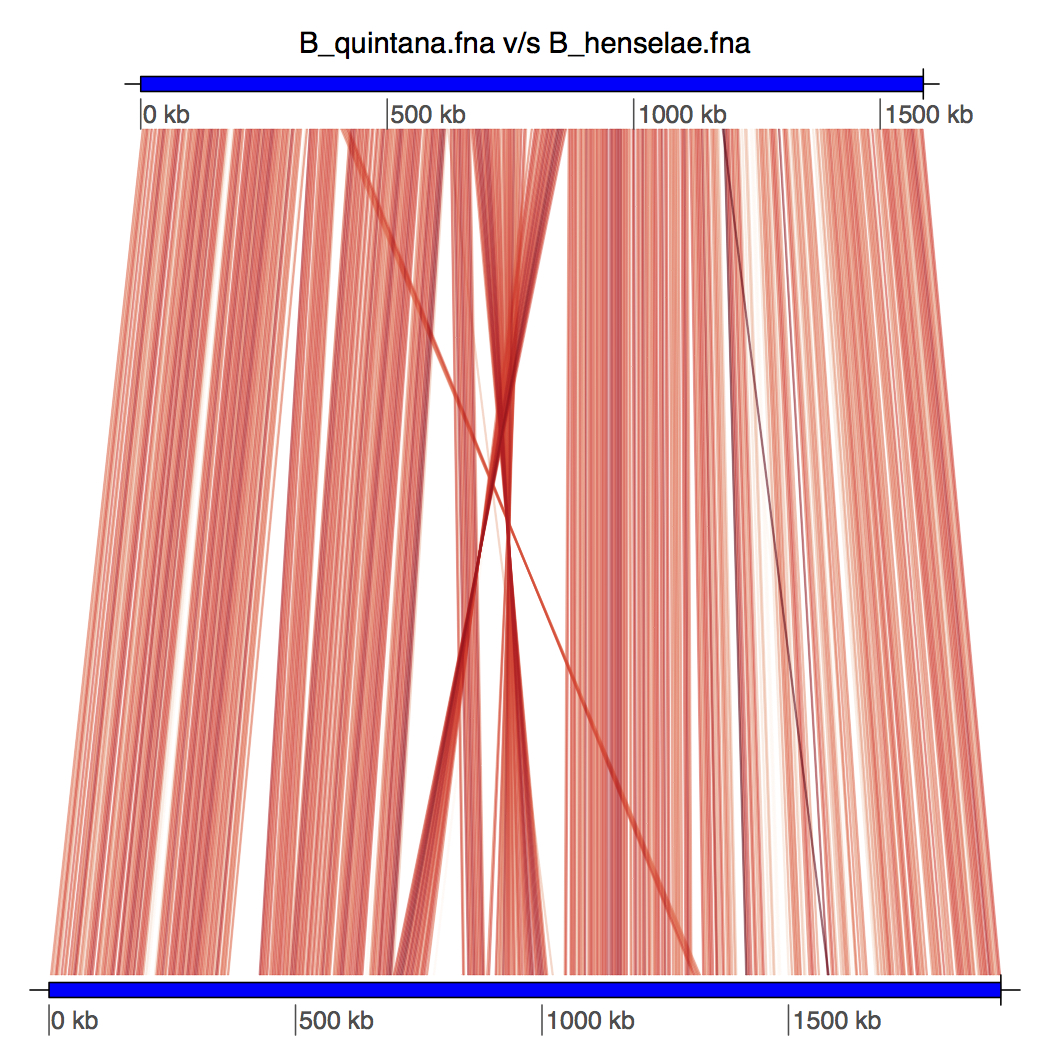
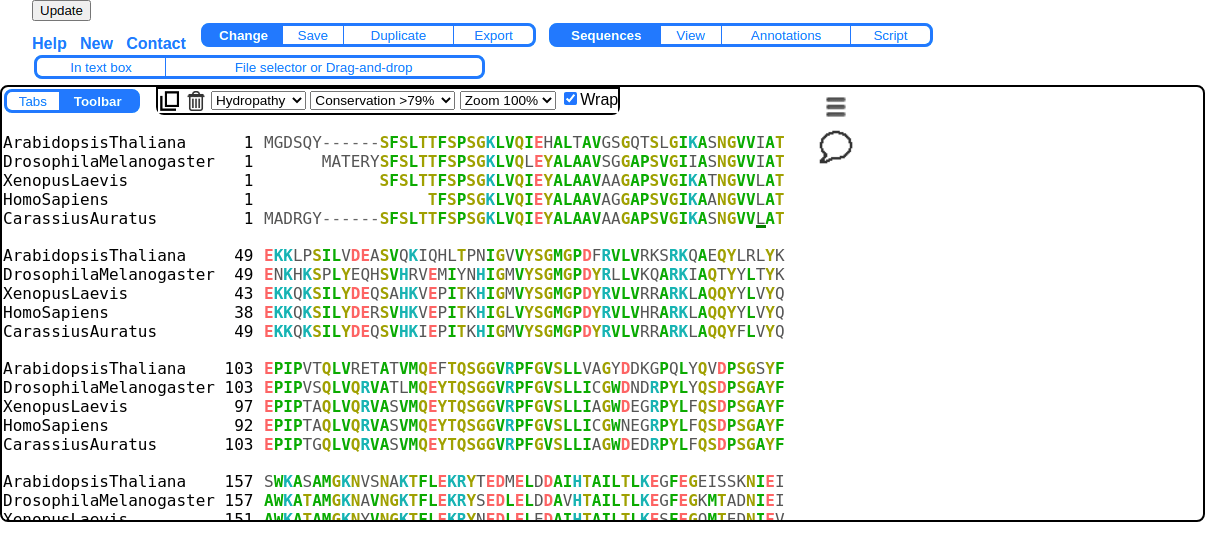
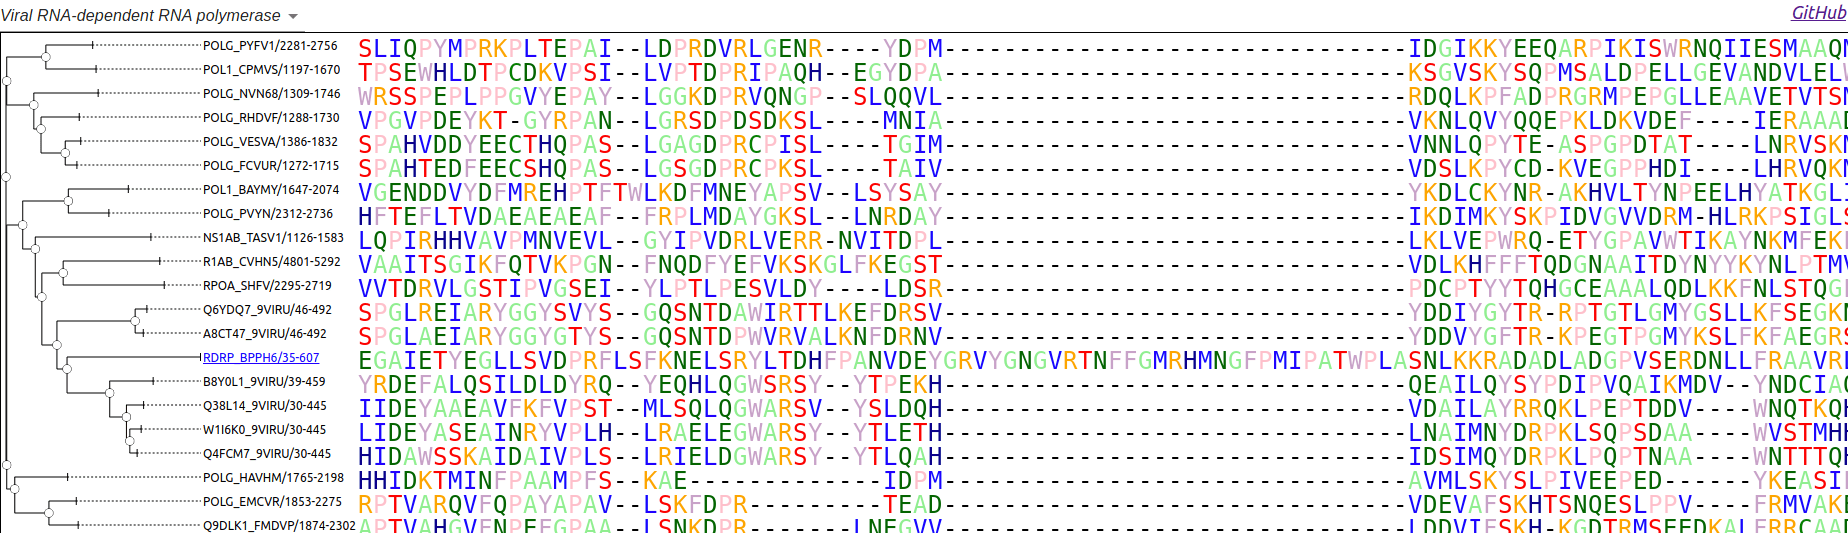
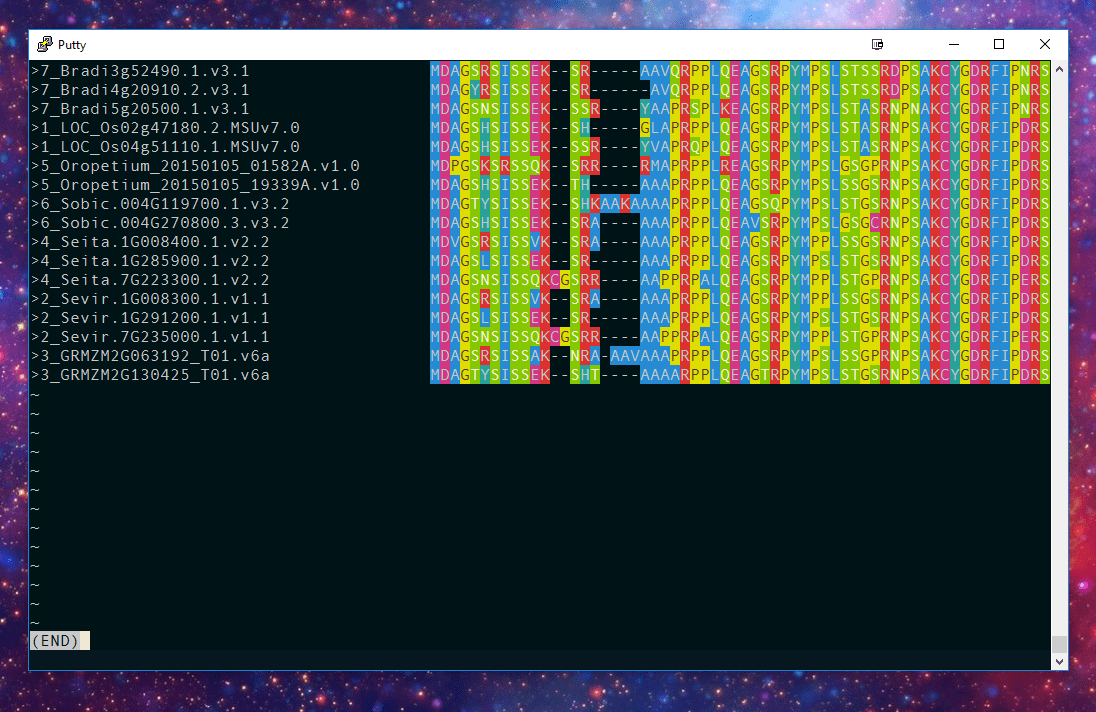
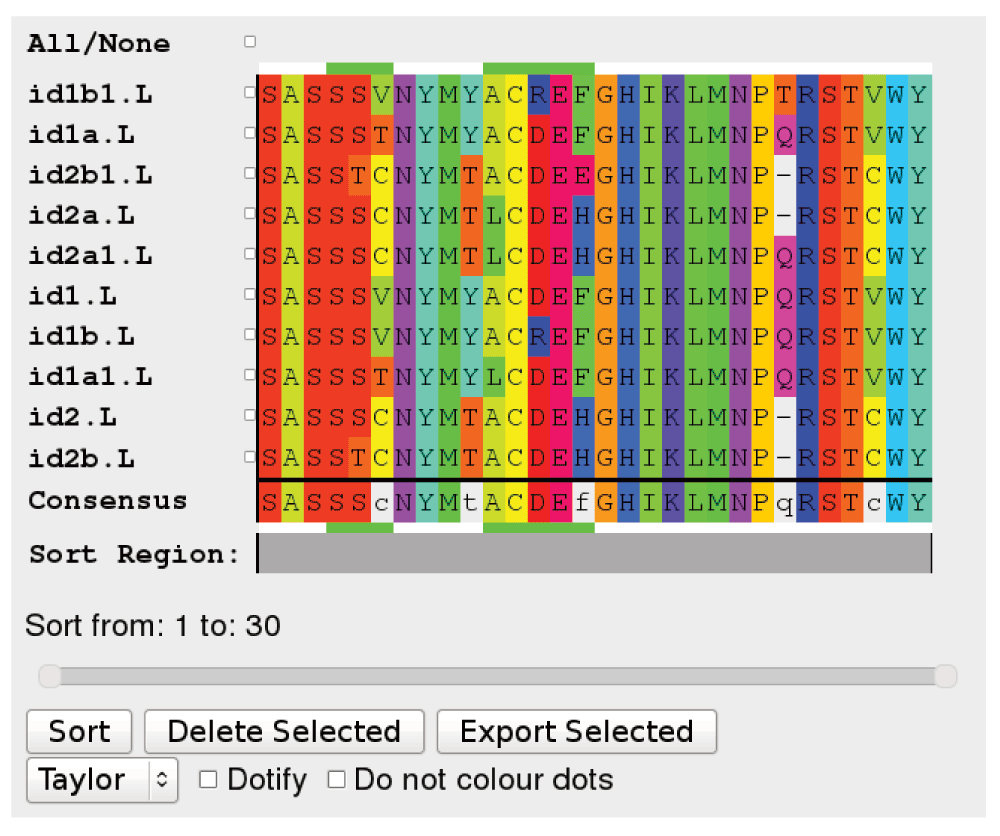
- AA (alignment annotator) (also see STRAP) (img)
- abrowse (MSA viewer) (img)
- Alan (img)
- alen (img)
- alignfigR (img)
- alignment.js (img)
- AlignmentComparator (Uses http://bioinfweb.info/LibrAlign/) (img)
- AlignmentViewer (img)
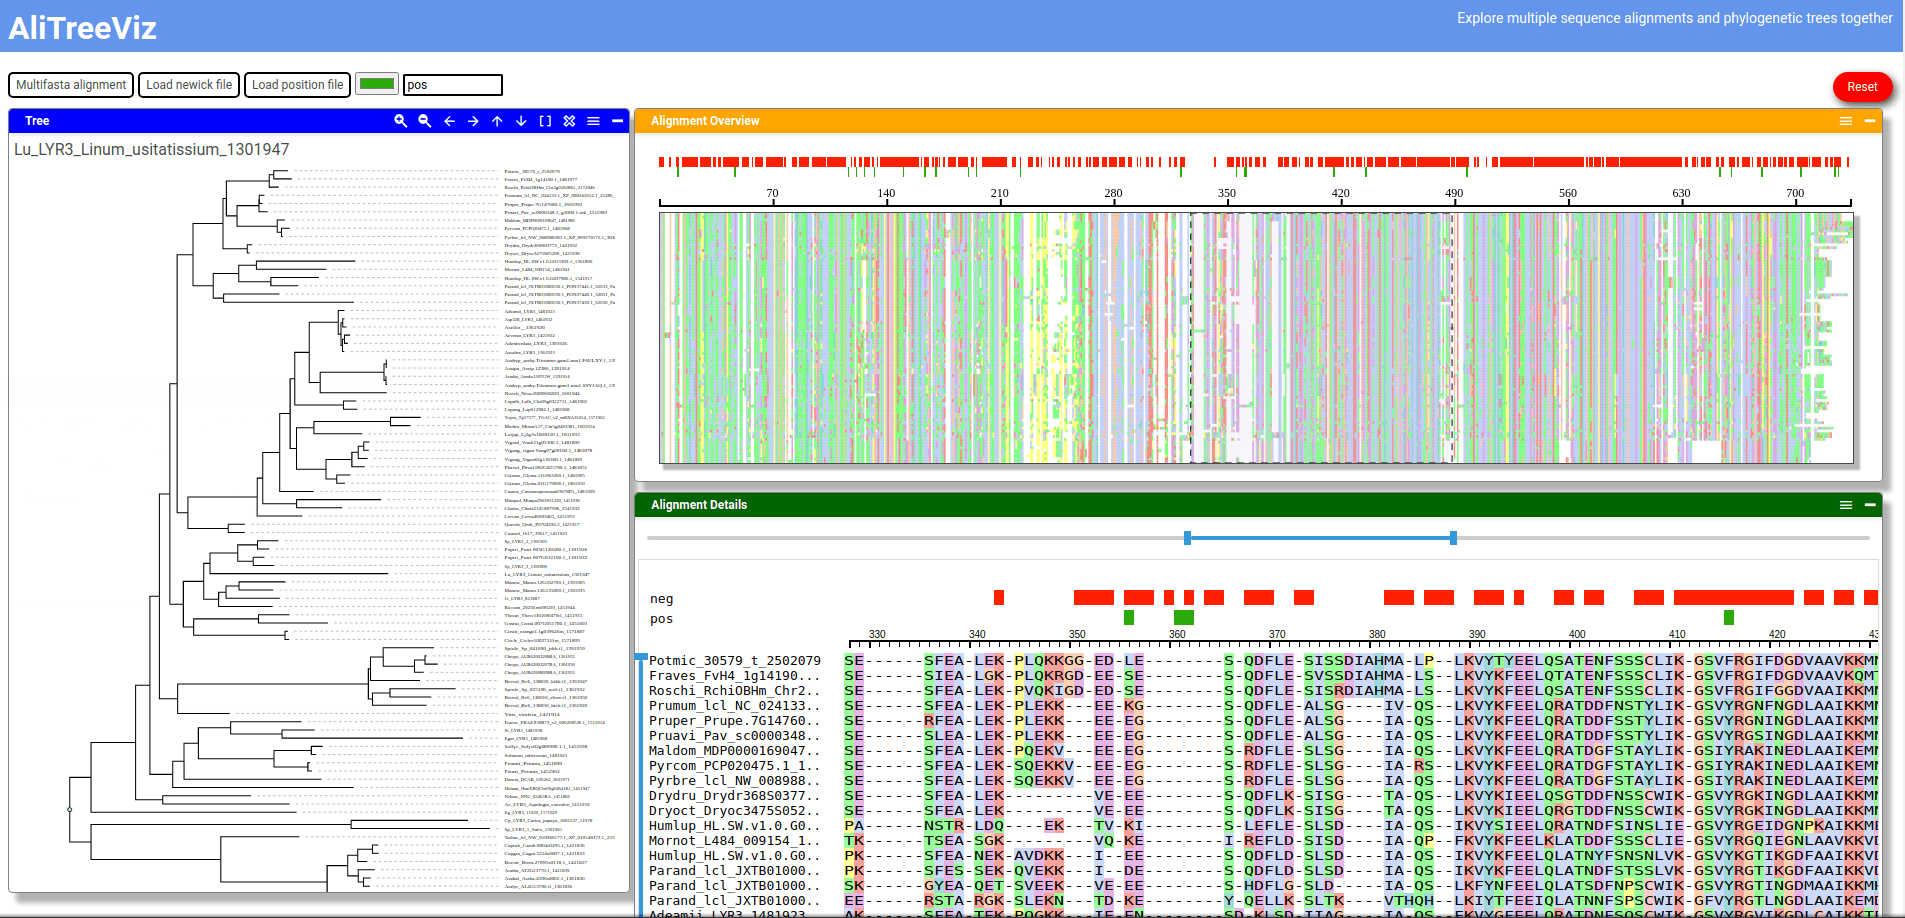
- AliTreeViz (img)
- AliView (img)
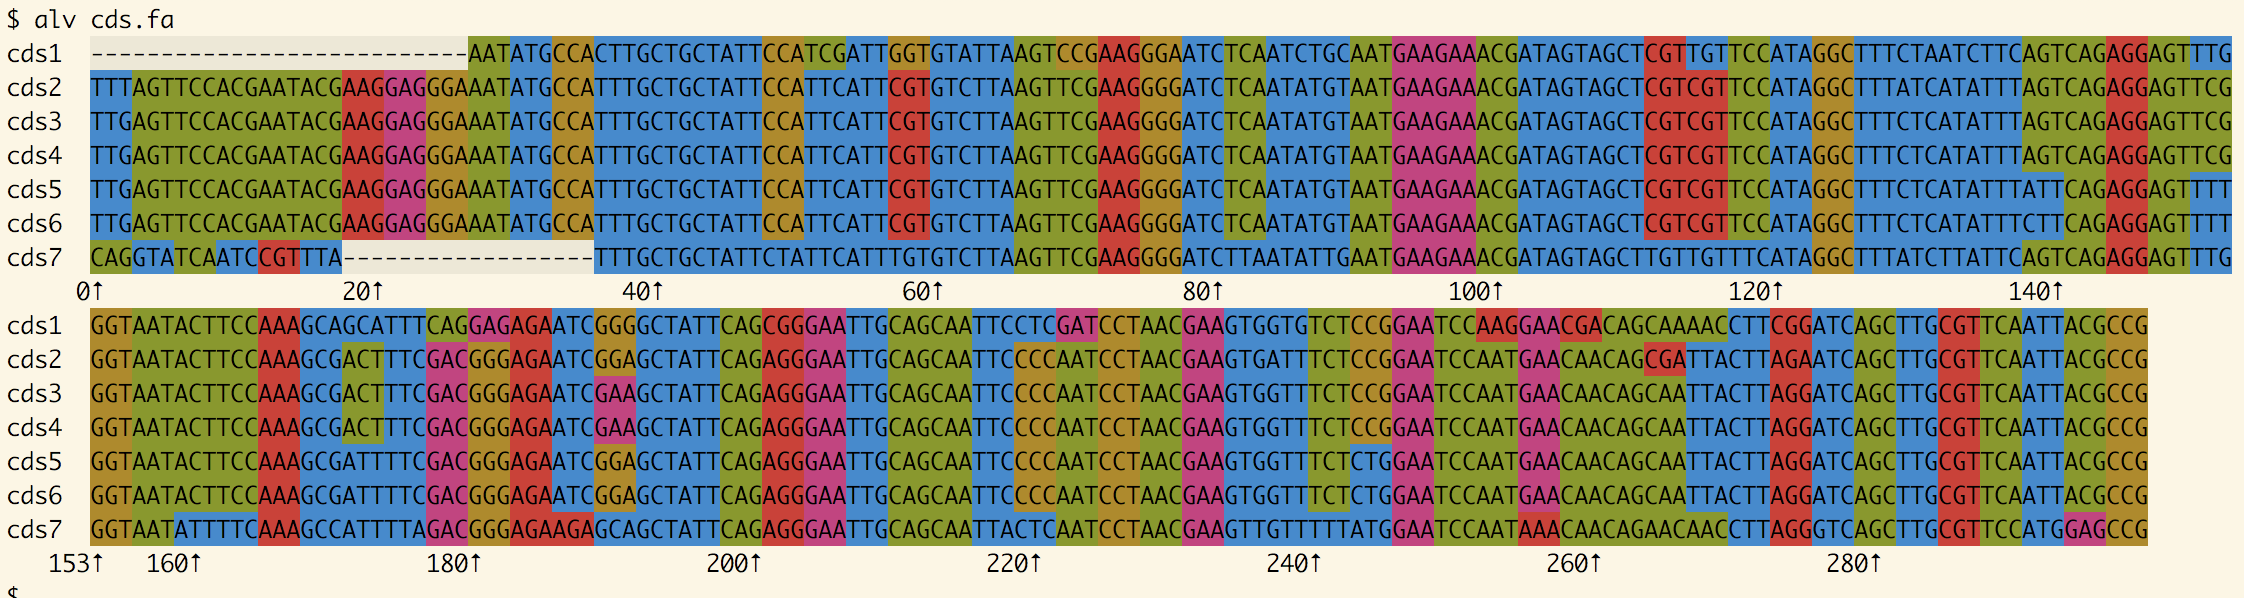
- Alv (img)
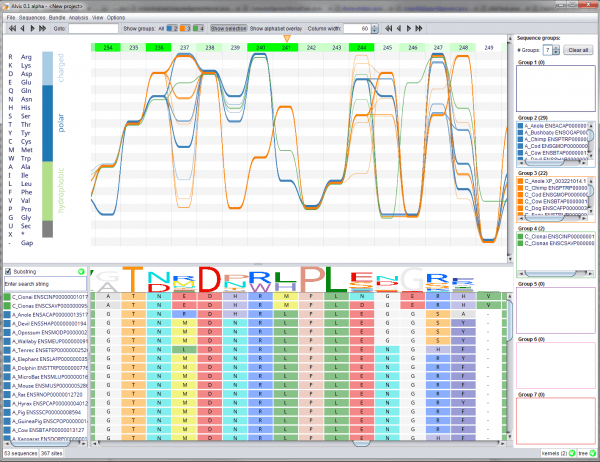
- ALVIS (MSA viewer) (Introduces sequence bundles concept, also see web app version https://www.ebi.ac.uk/goldman-srv/sequencebundles/ source code https://bitbucket.org/schwarzlab/alvis/src/master/) (img)
- BioJS MSA (img)
- Boxshade (Also available
as a command line tool with
apt install boxshade. See also rMSA which can automate running boxshade from within R) (img) - CIAlign (Has useful utility functions to clean gaps and trim MSAs) (img)
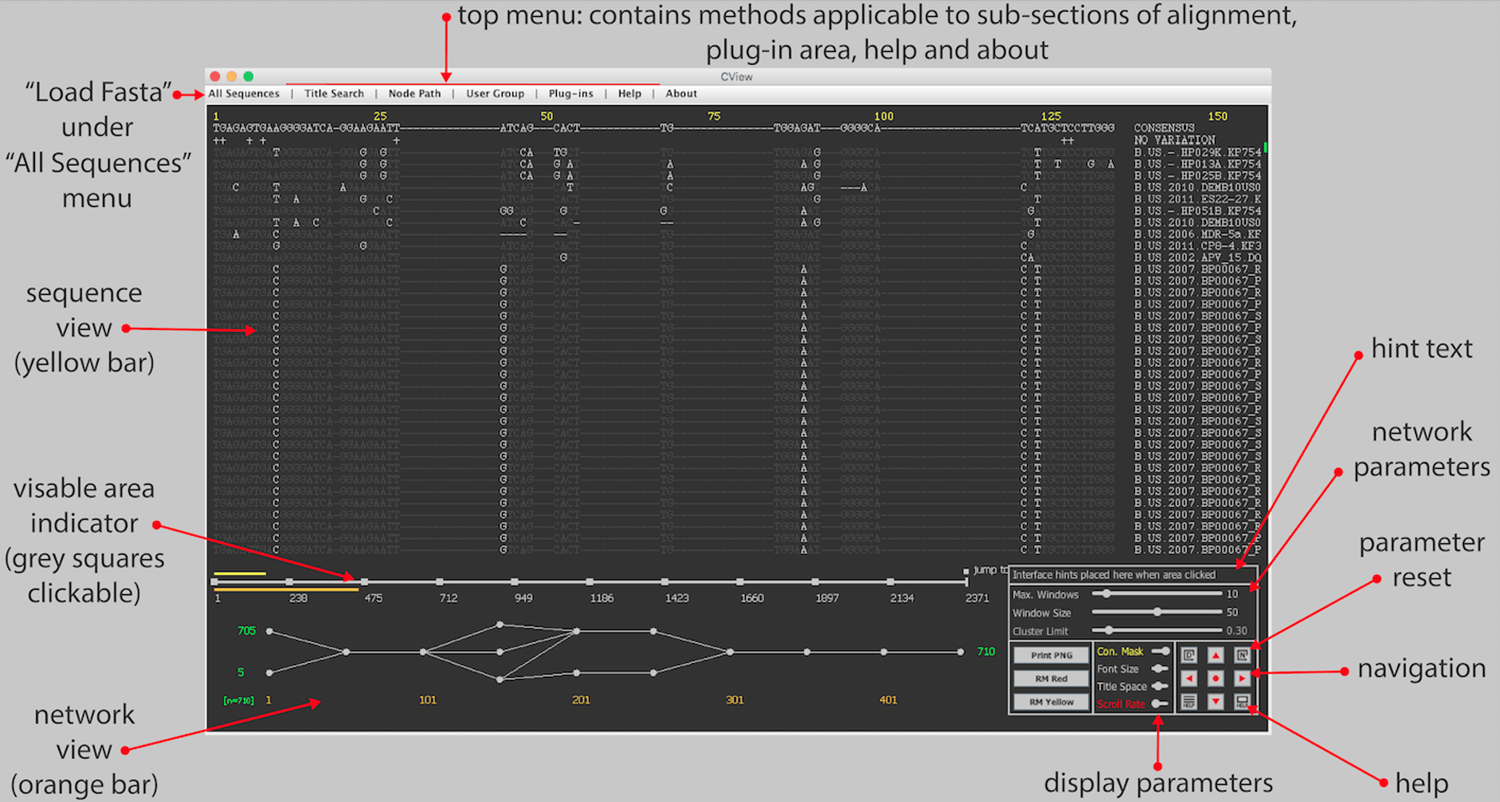
- CView (img)
- ESPript (Primarily a web interface but can download a binary for linux https://espript.ibcp.fr/ESPript/ESPript/esp_faq.php) (img)
- ete (img)
- ggmsa (See also ggtree) (img)
- ggtree (see https://yulab-smu.top/treedata-book/chapter7.html?q=msa#msaplot for MSA example) (img)
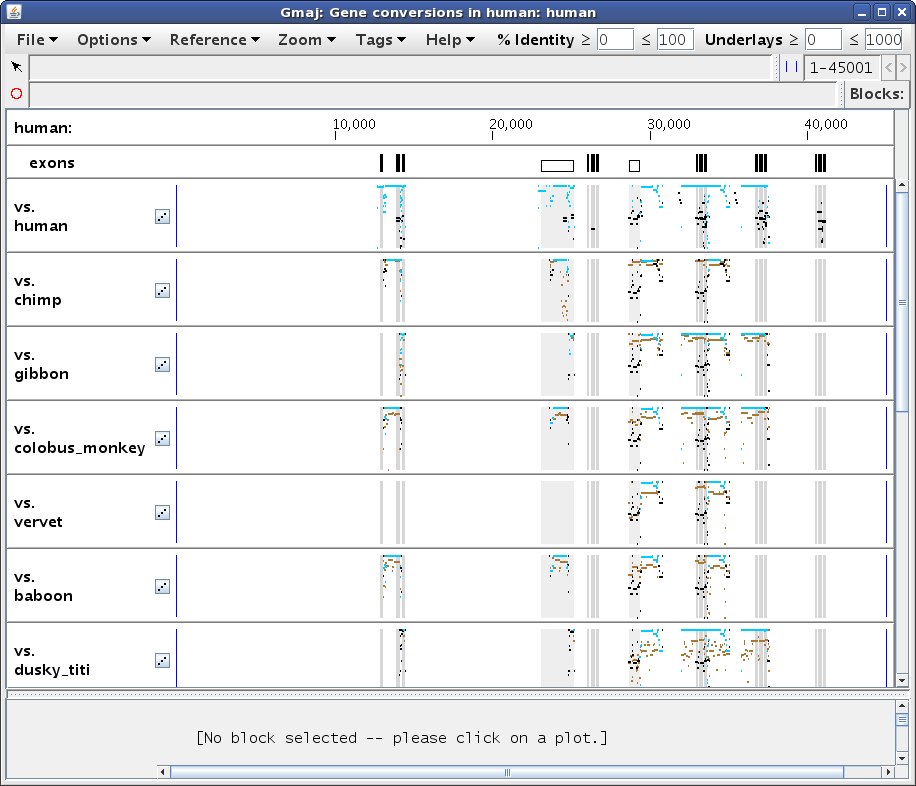
- Gmaj (img)
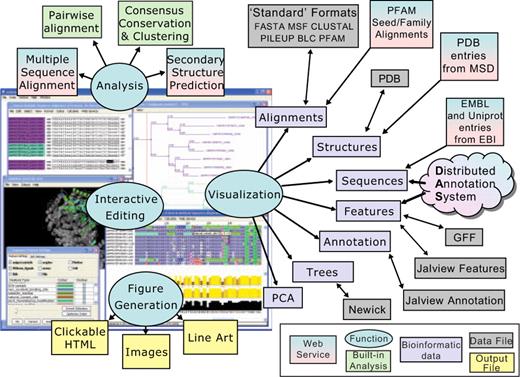
- Jalview (img)
- JSAV (img)
- MacVector (img)
- MEGA-X (original paper from 1994 but actively updated. requires EULA for download) (img)
- MSABrowser (img)
- msaR (uses BioJS/MSA) (img)
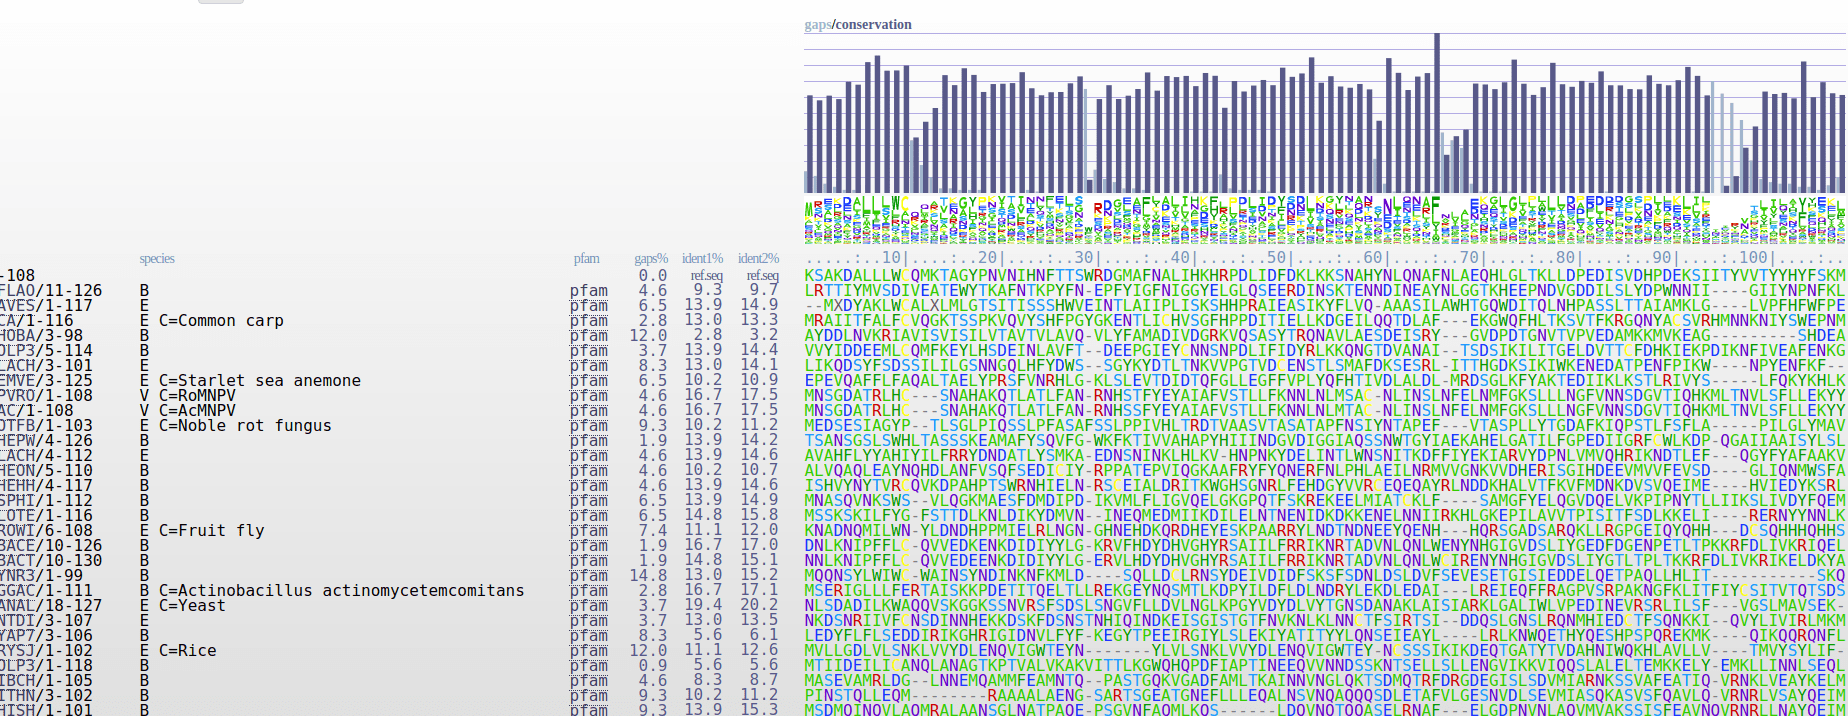
- MView (See also their web versions of clustal omega etc. which have similar outputs) (img)
- NCBI MSA Viewer (img)
- ProViz (See also alphafold visualization as tracks http://slim.icr.ac.uk/projects/alphafold?page=alphafold_proviz_homepage) (img)
- pyBoxshade (also see boxshade) (img)
- pymsaplotter (img)
- React MSAViewer (Plotly fully deleted the github unfortunately) (img)
- react-msaview (img)
- rich-msa (img)
- rMSA (Can automate boxshade) (img)
- Rna Alignment Viewers (Colorstock, SScolor, Ratón) (img)
- salti (img)
- Seaview (img)
- seqotron (img)
- SeqTUI (img)
- seqvisr (img)
- SNIPViz (img)
- STRAP (also see AA) (img)
- termal (img)
- TeXShade (img)
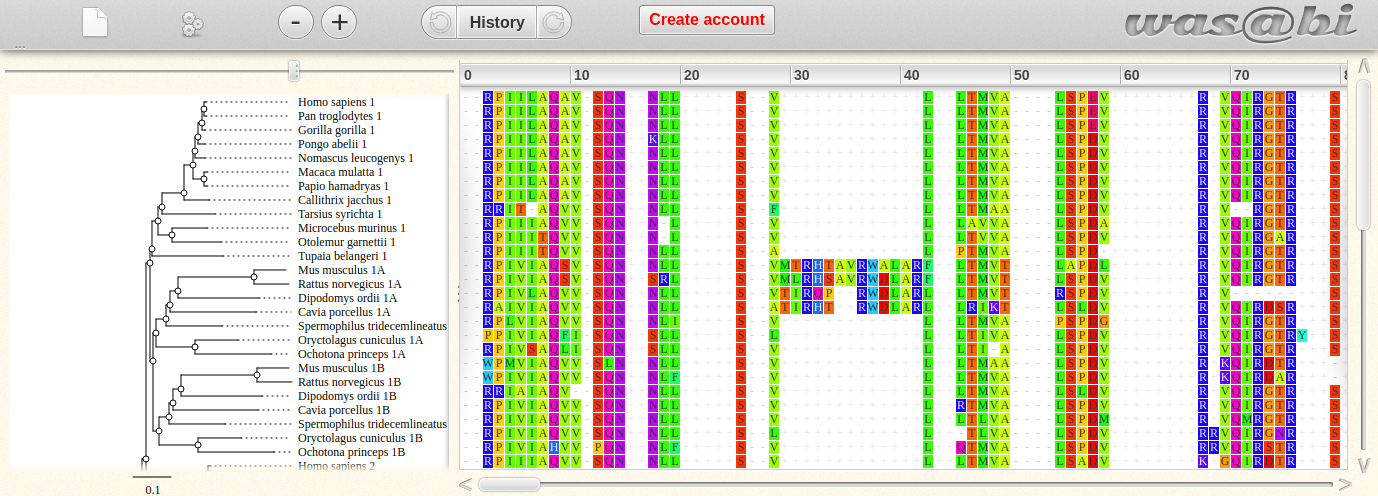
- Wasabi (img)
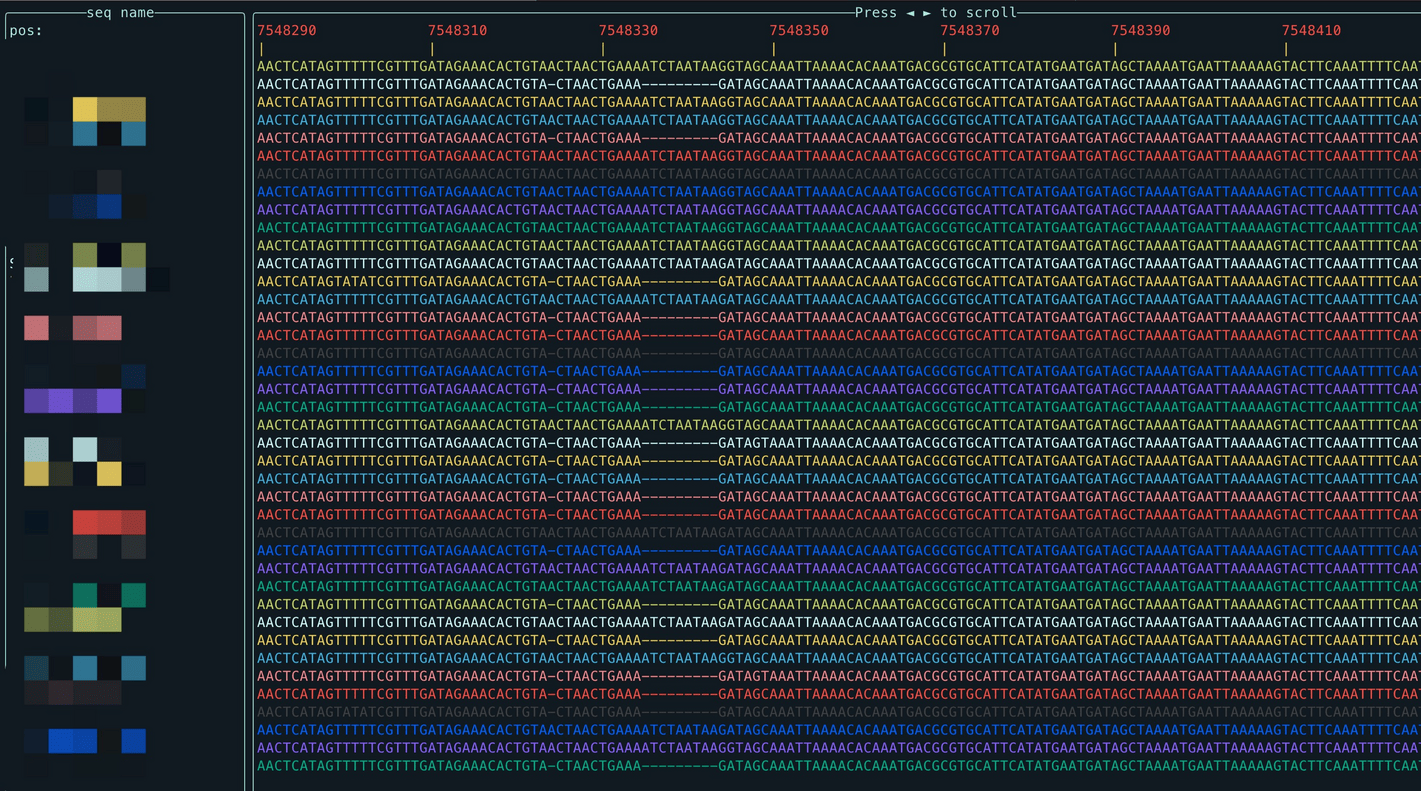
- wgatools (img)
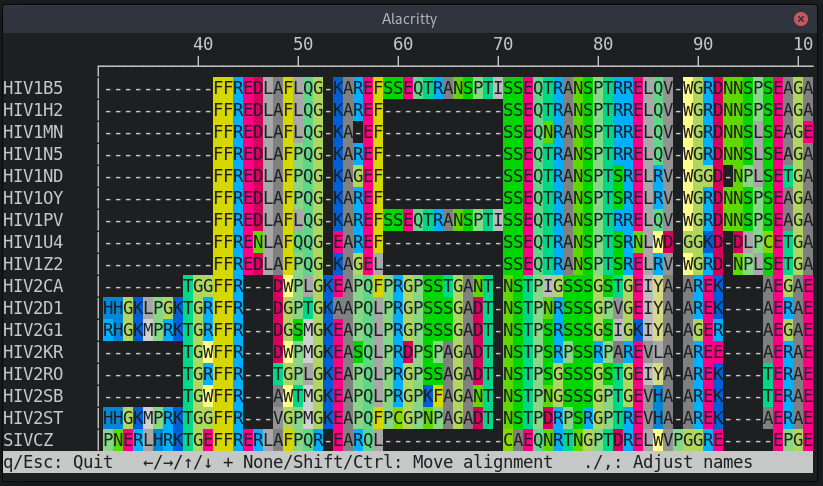
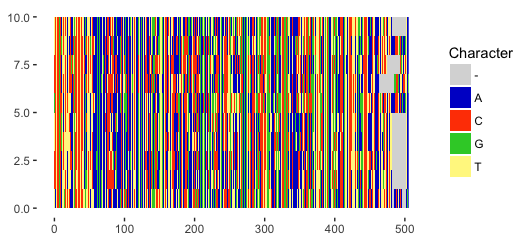
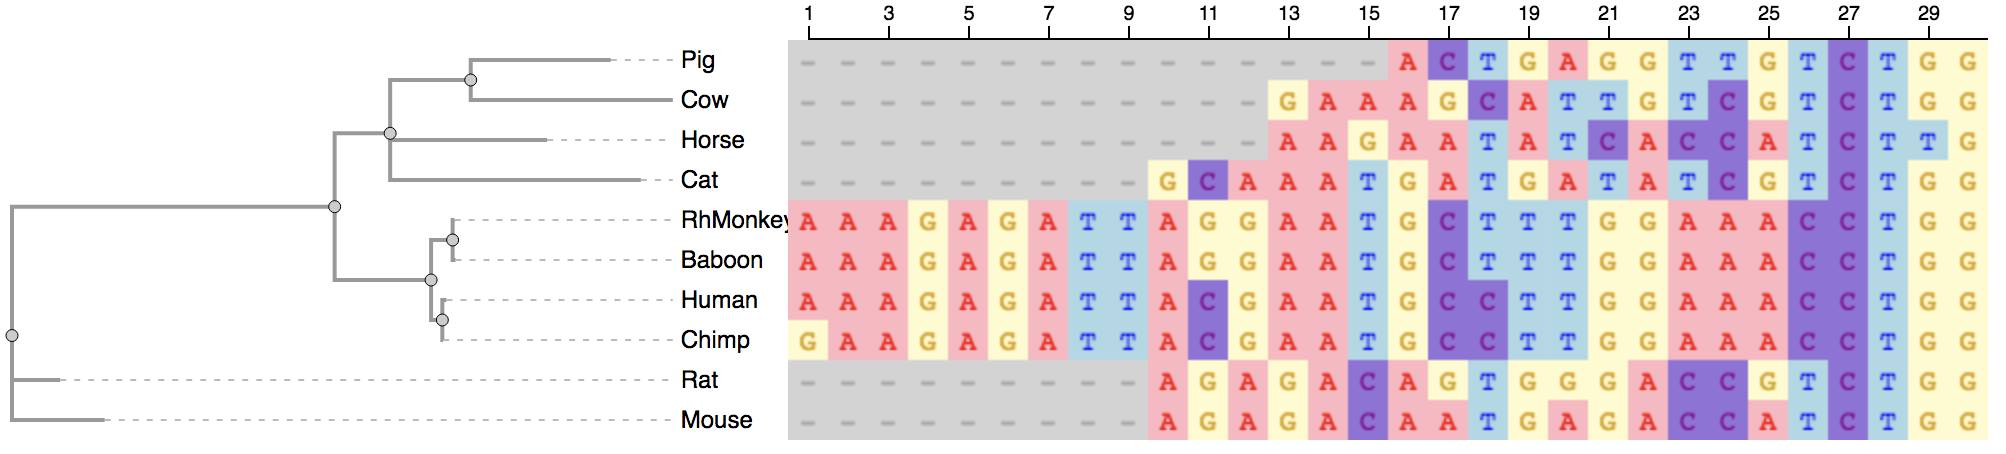
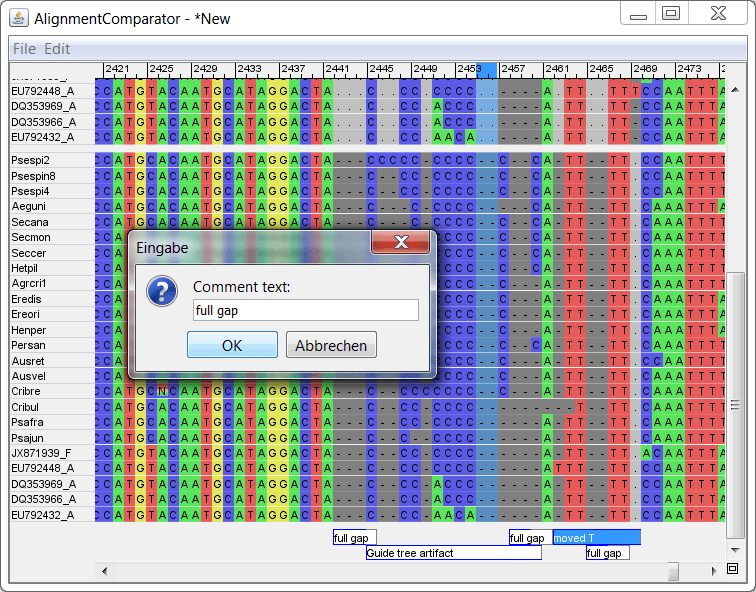
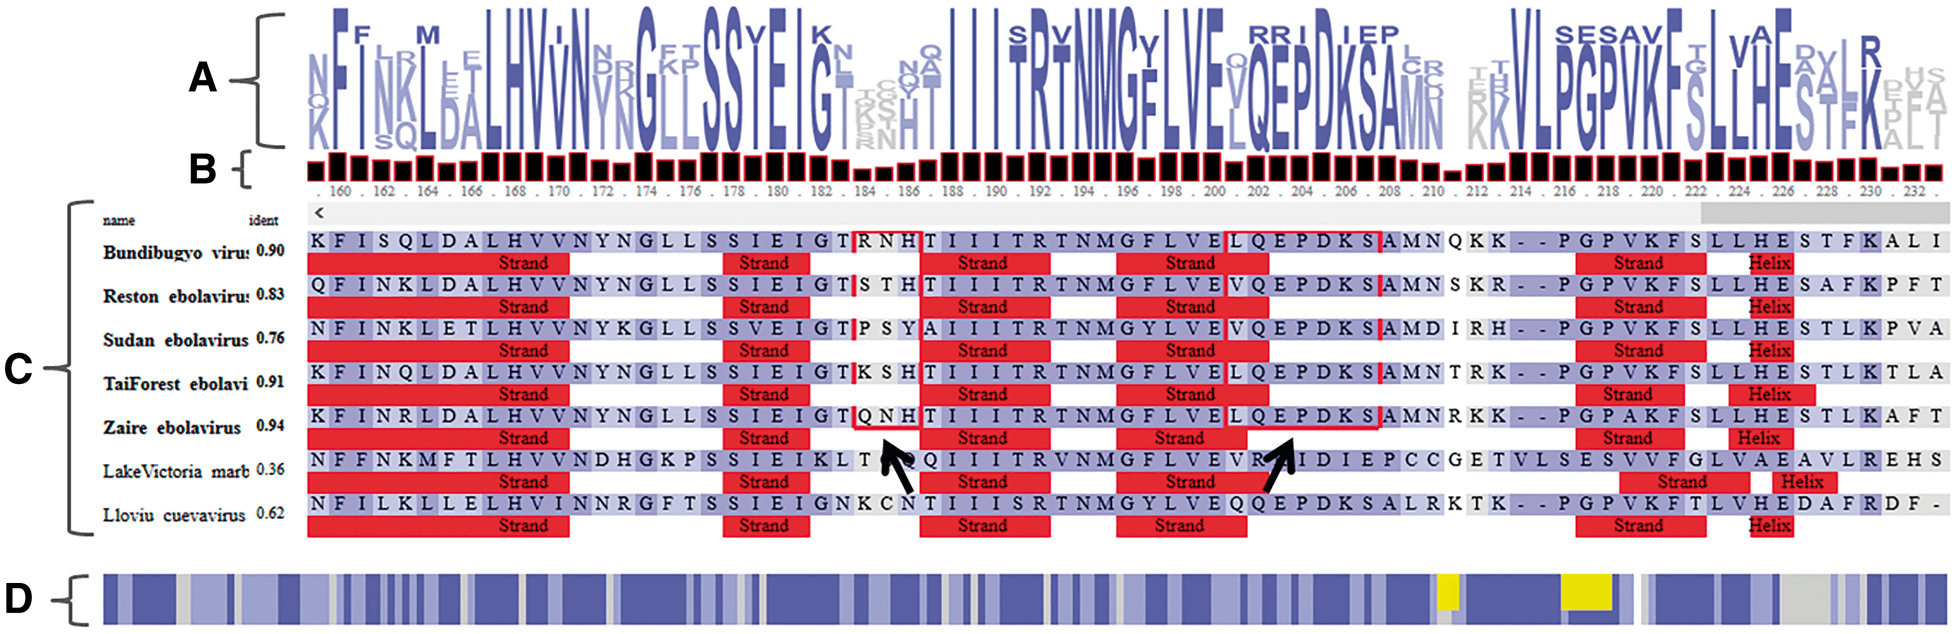
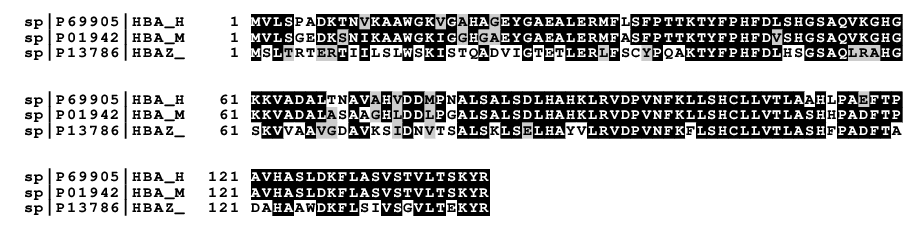

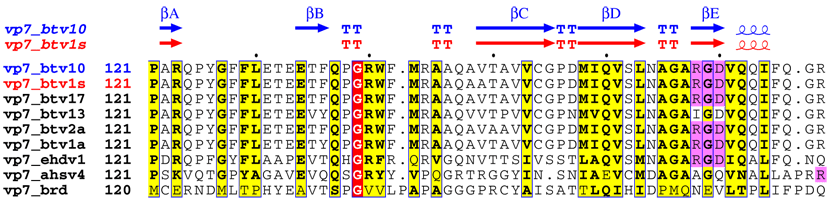
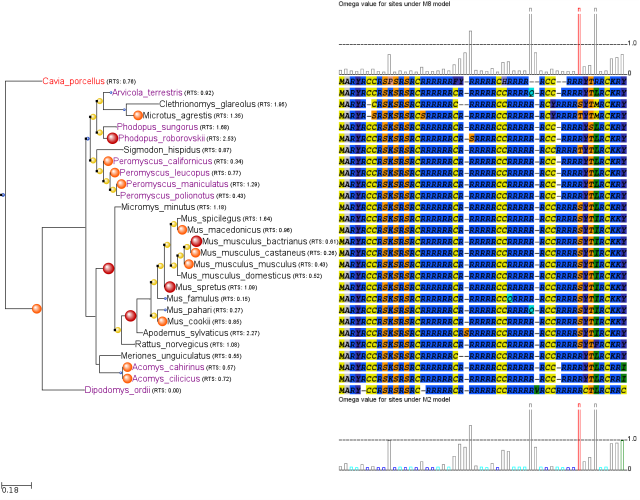
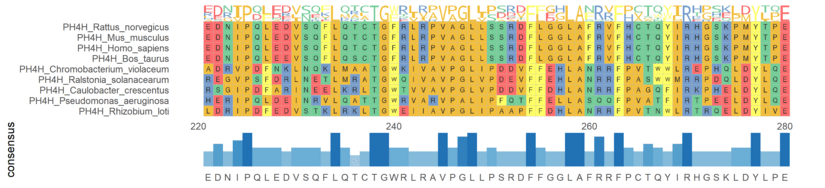
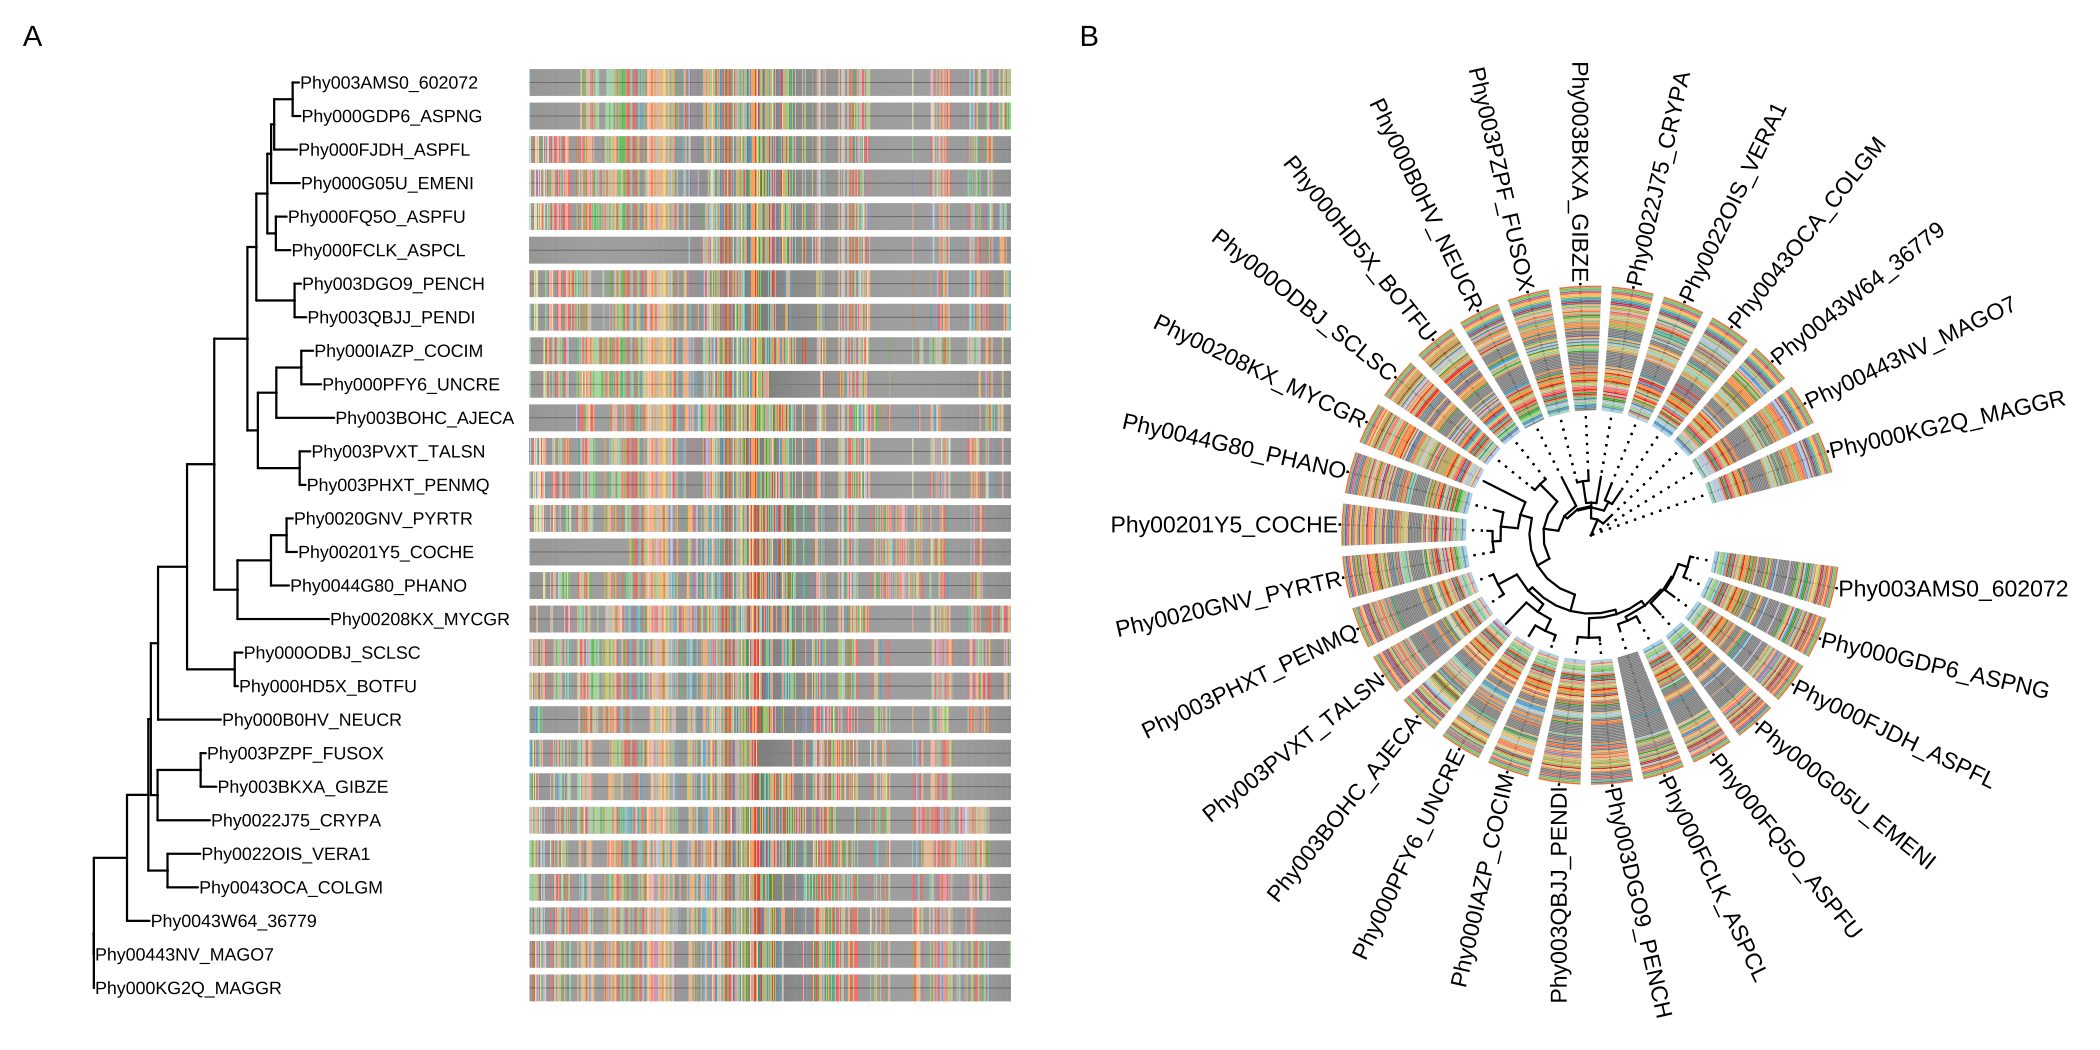
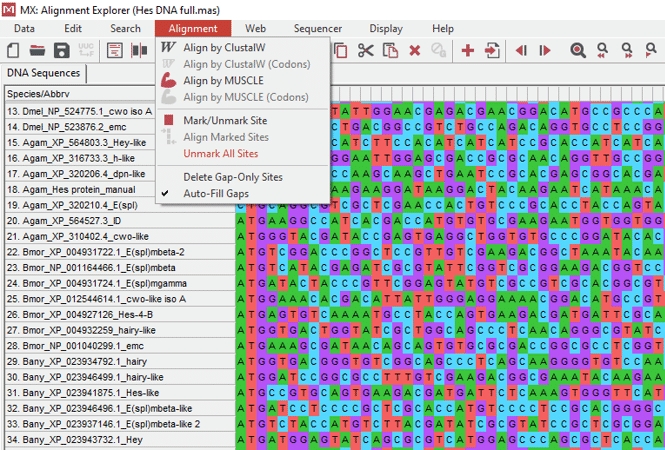

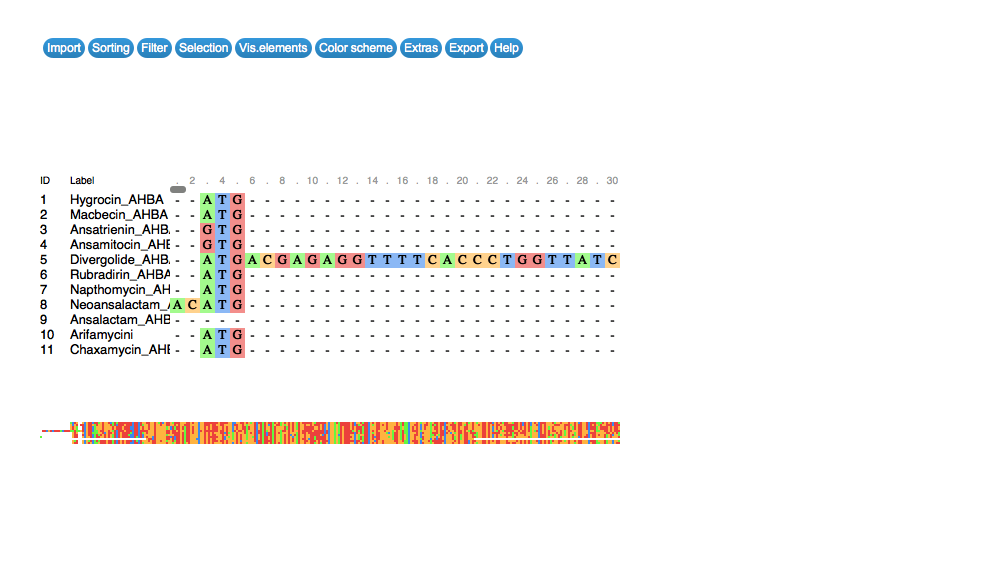
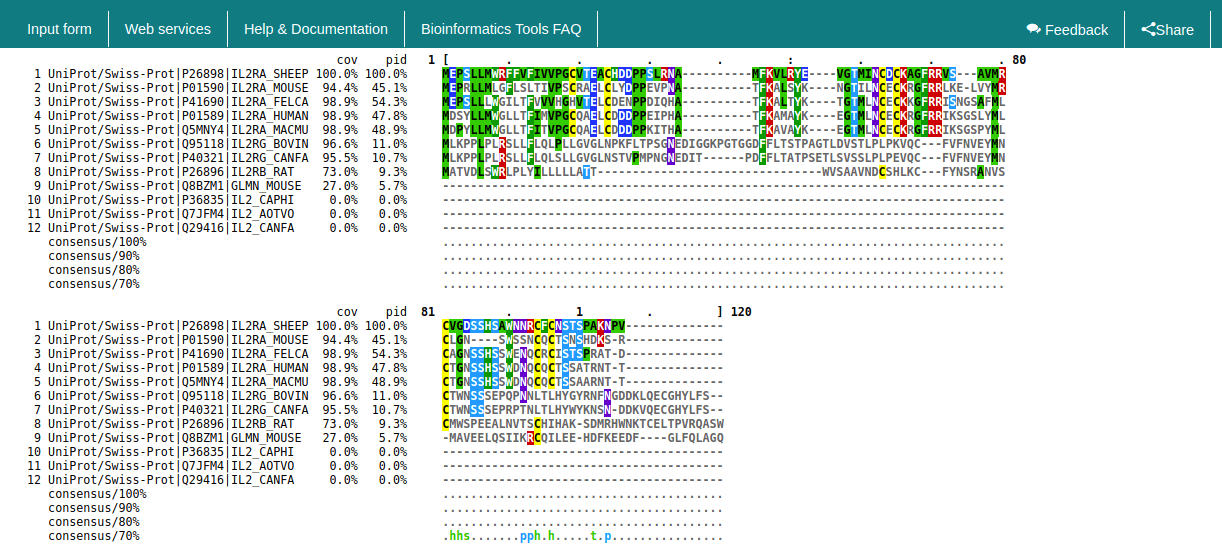
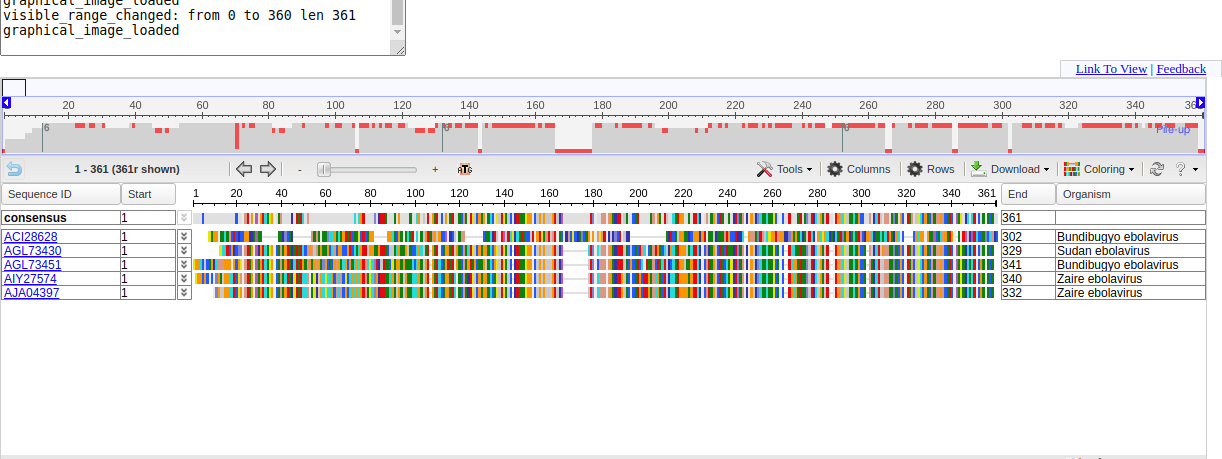
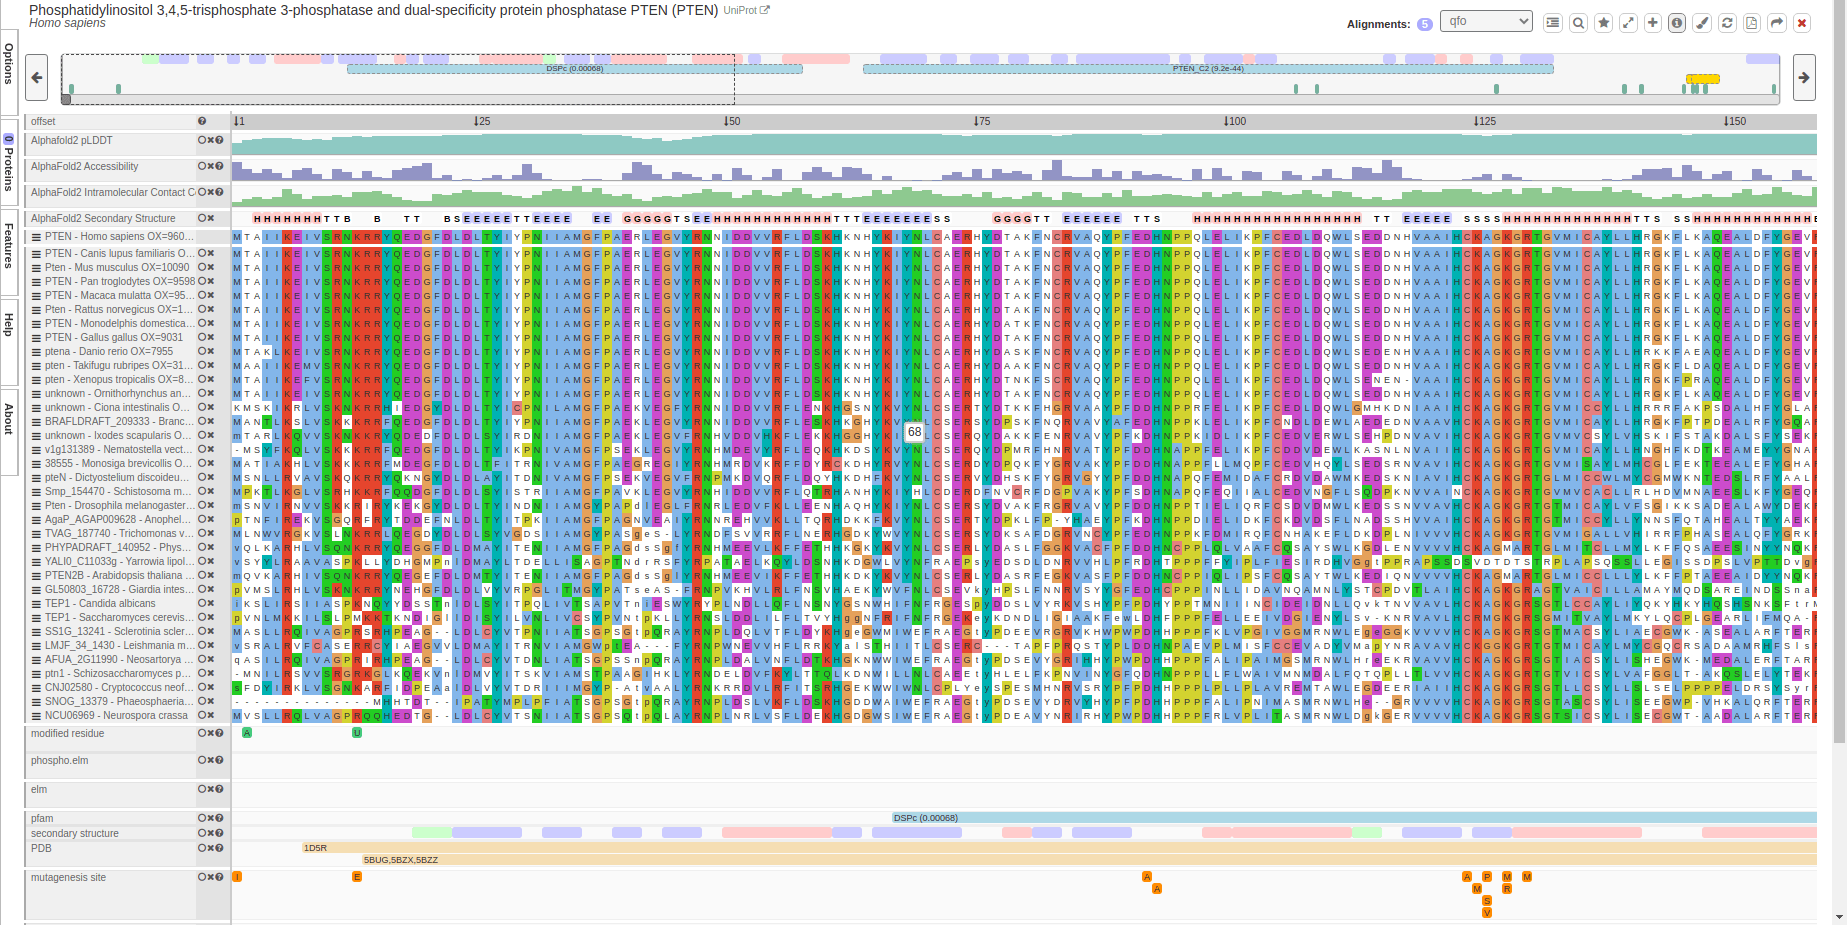
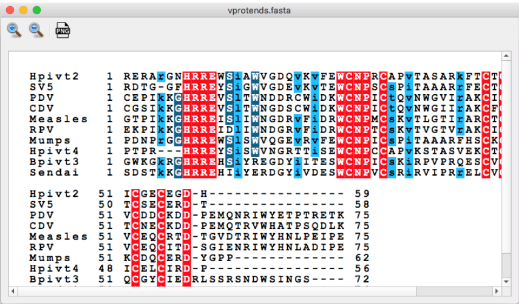
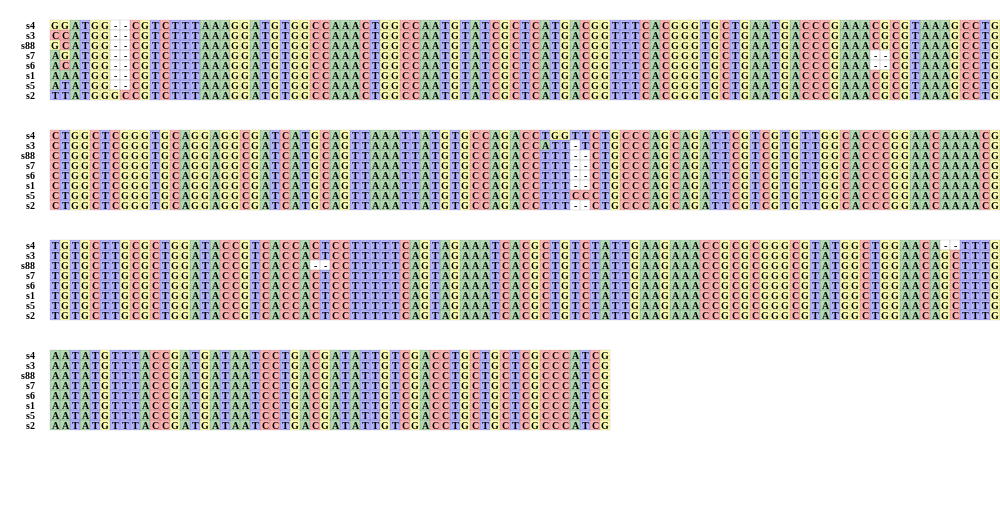
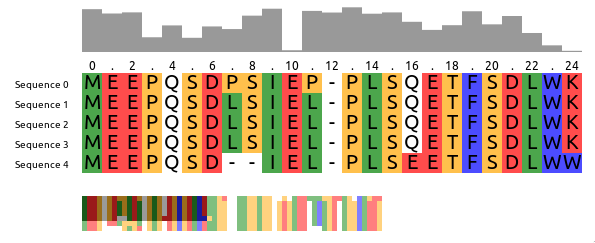
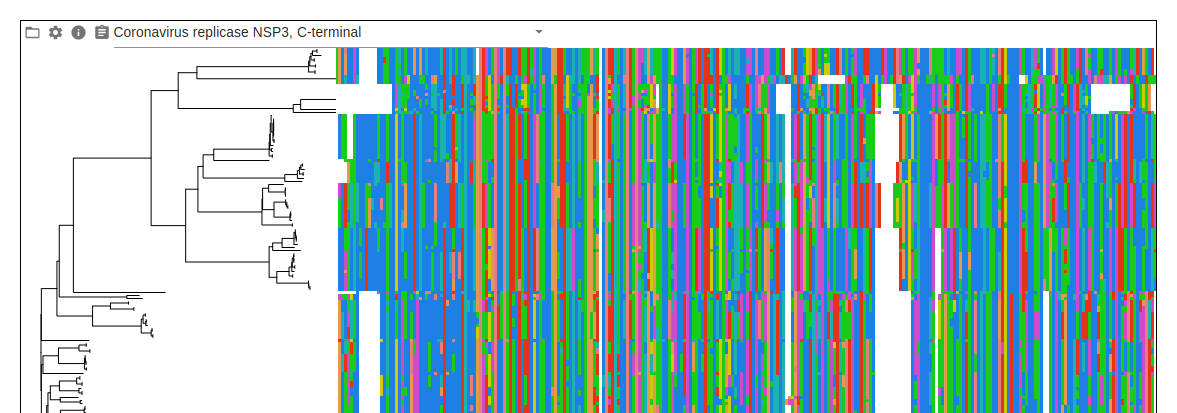
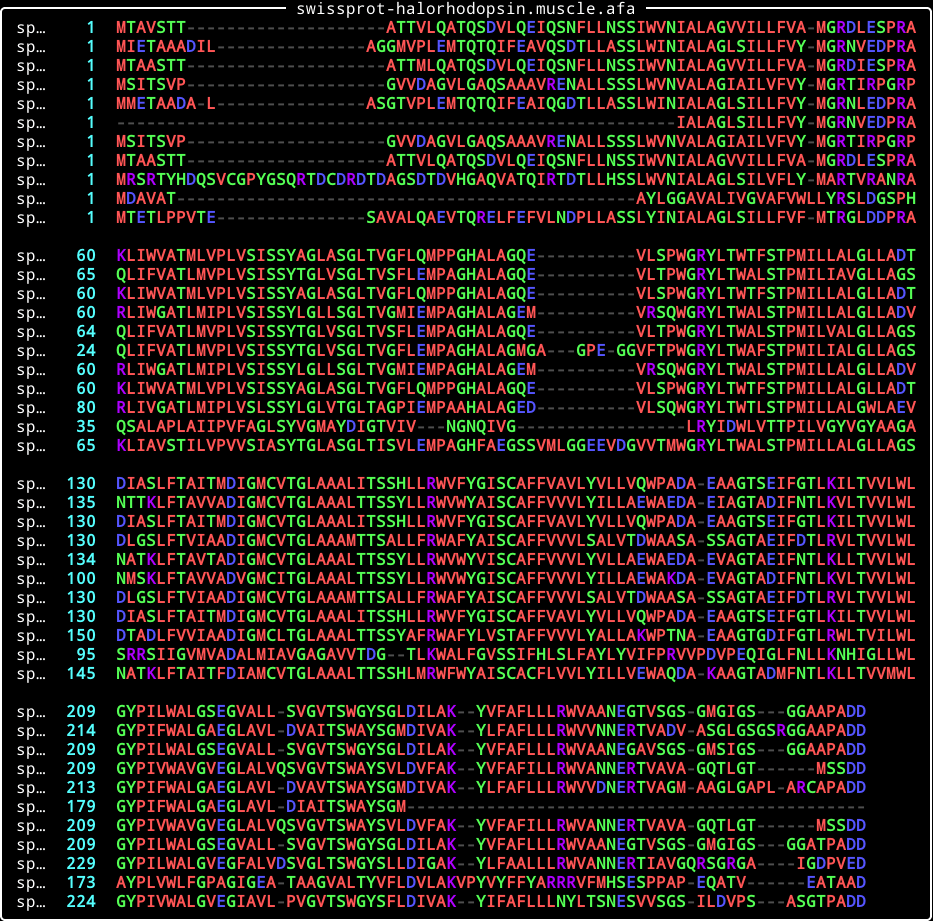
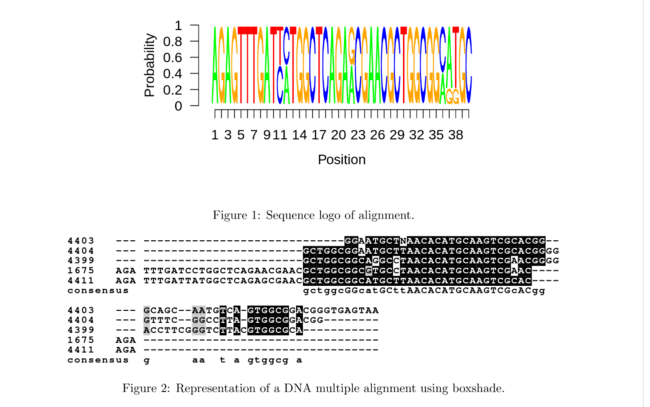
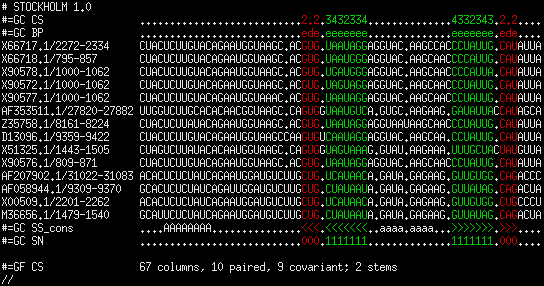
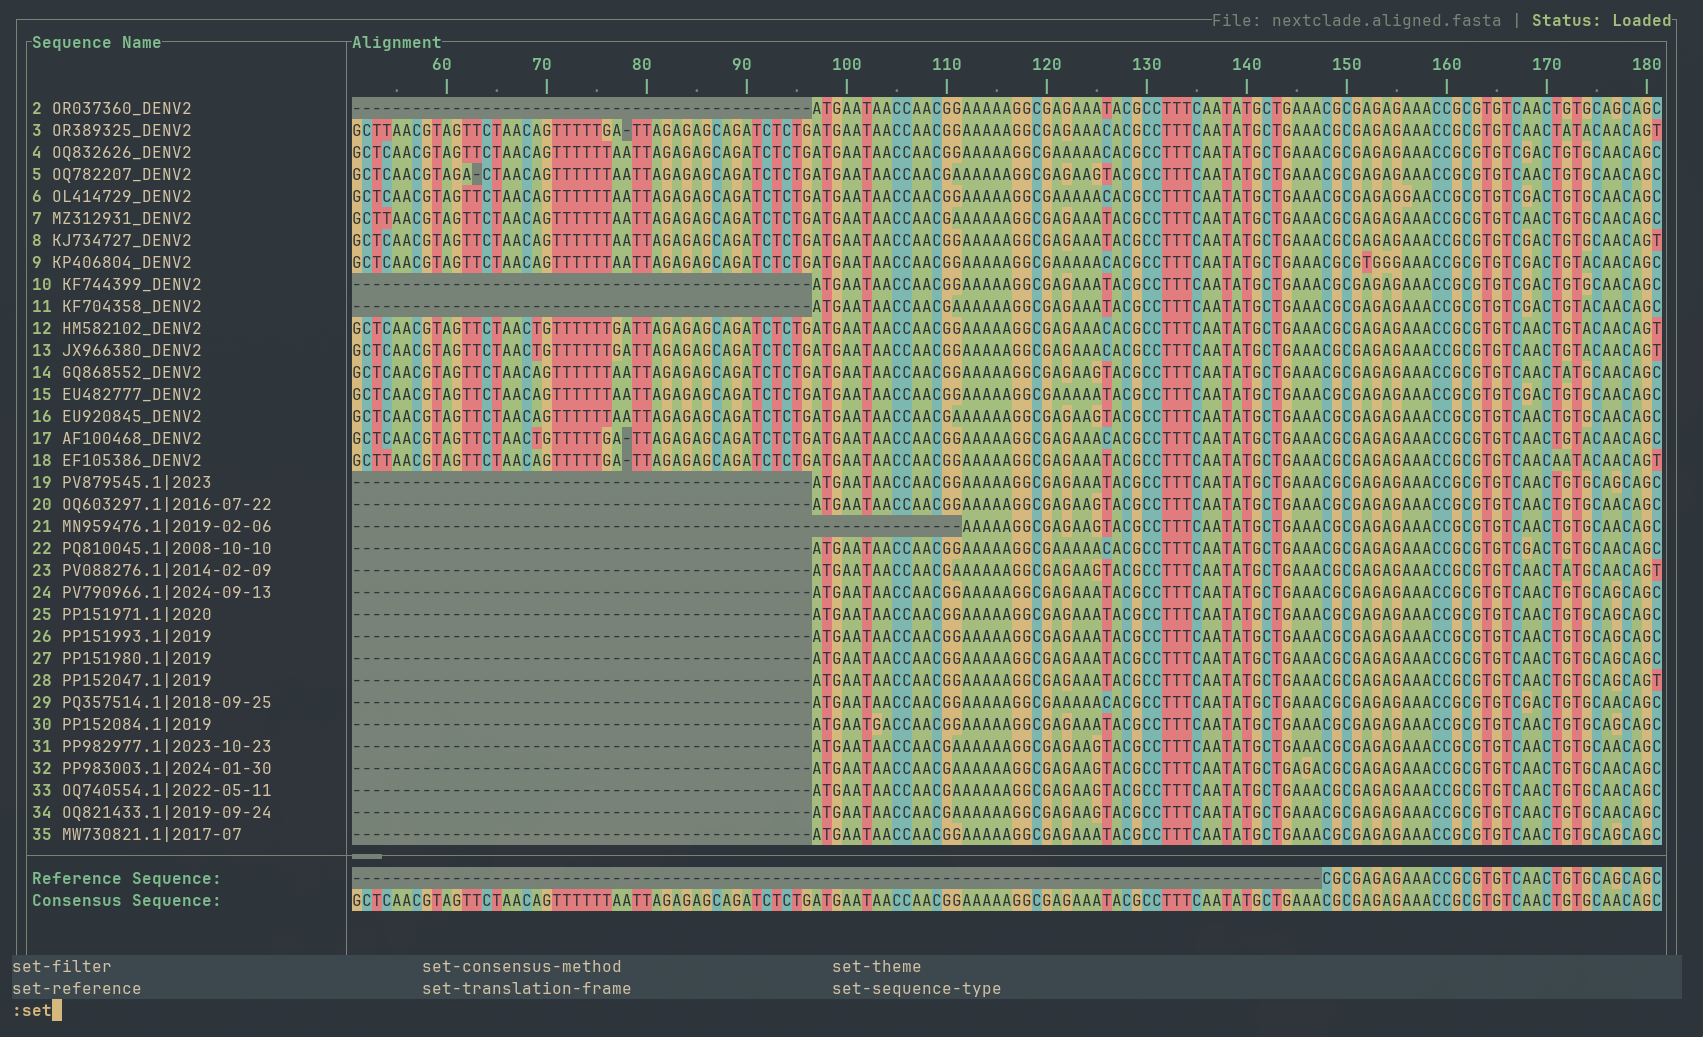
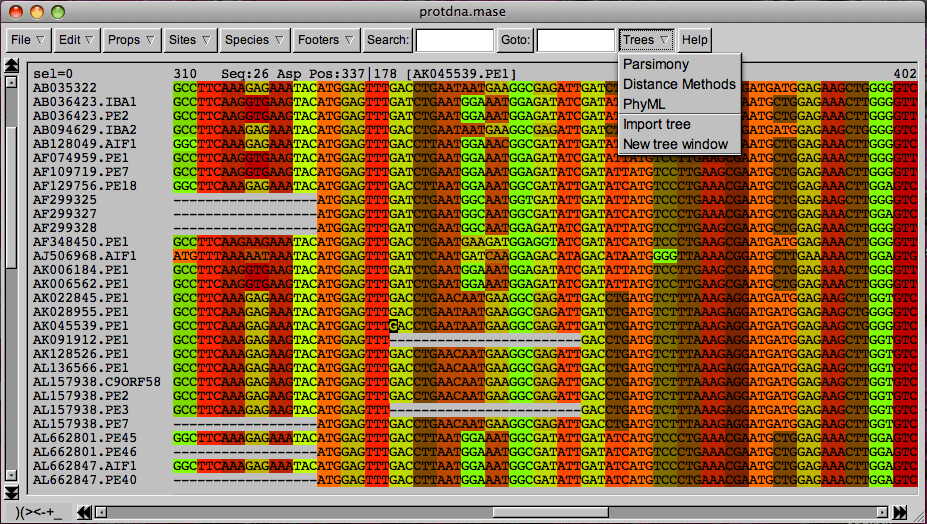
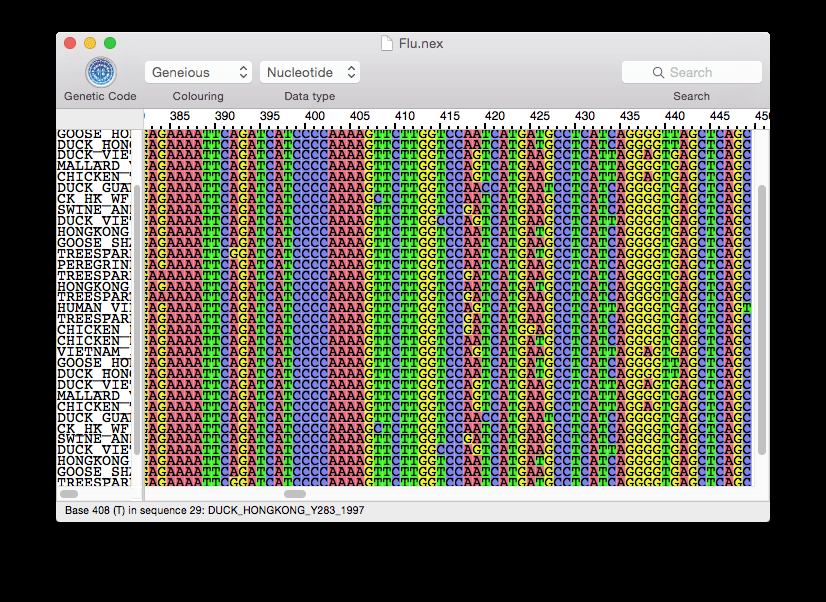

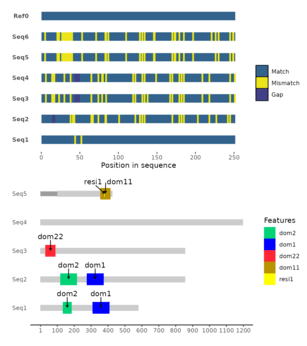
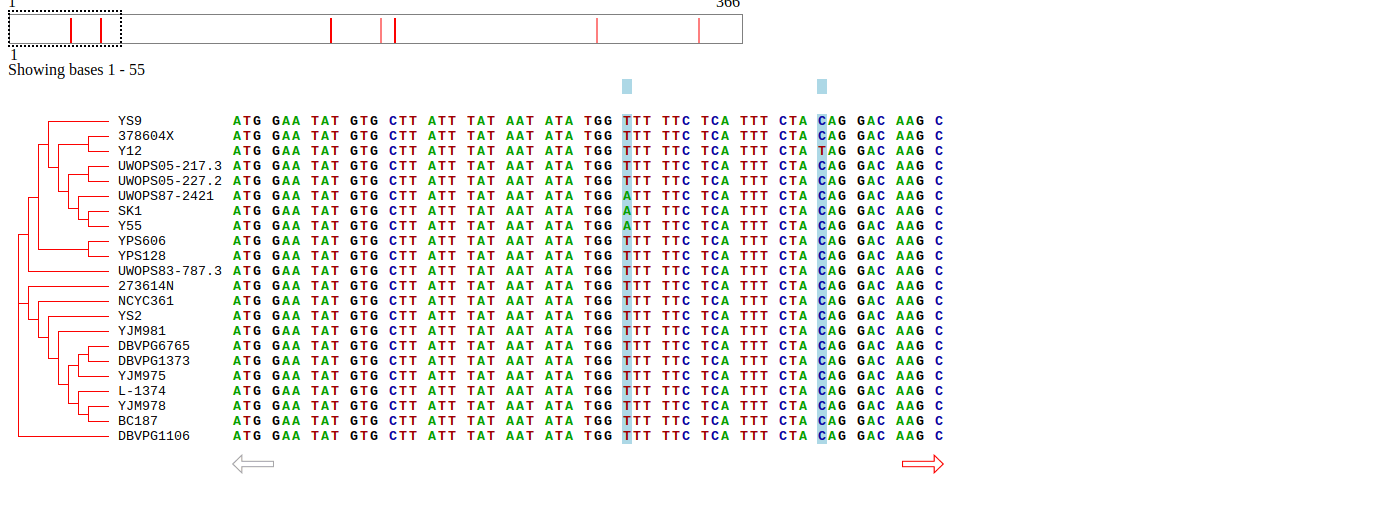
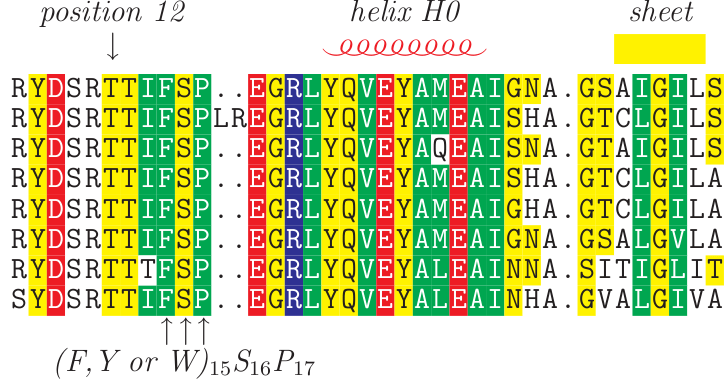
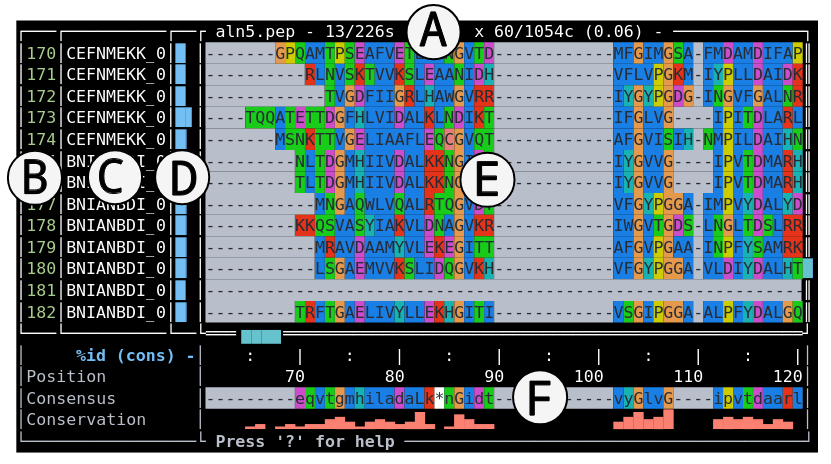
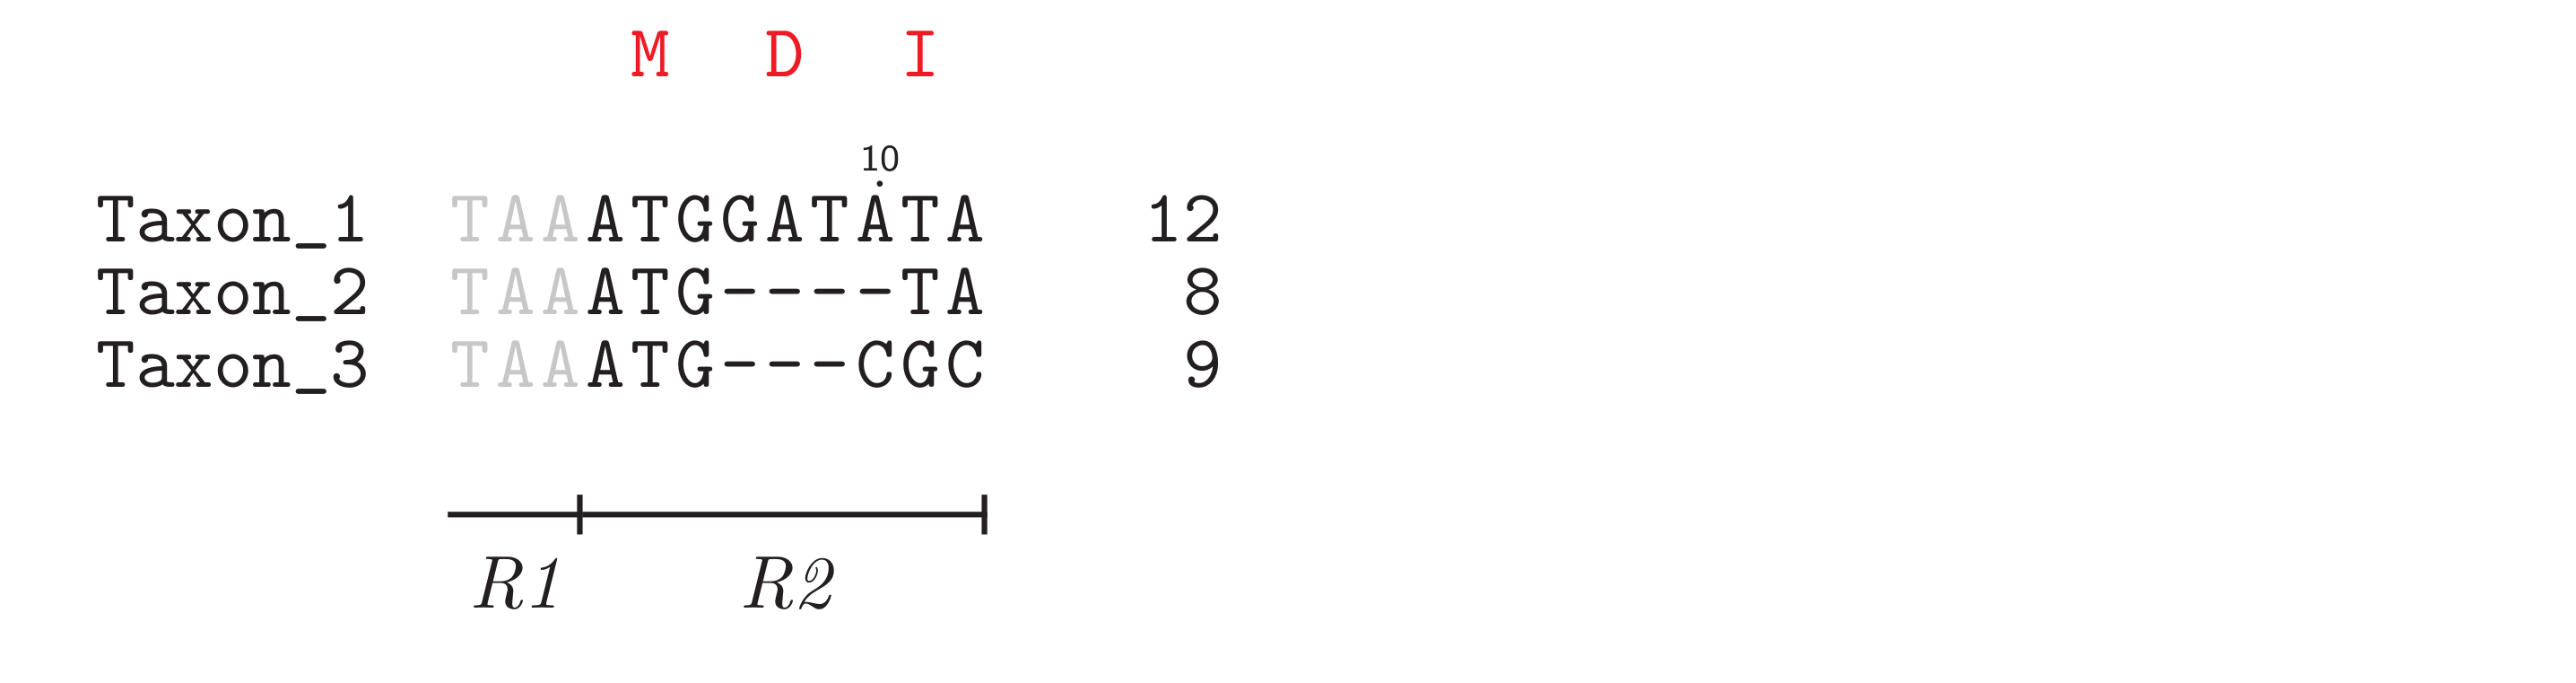
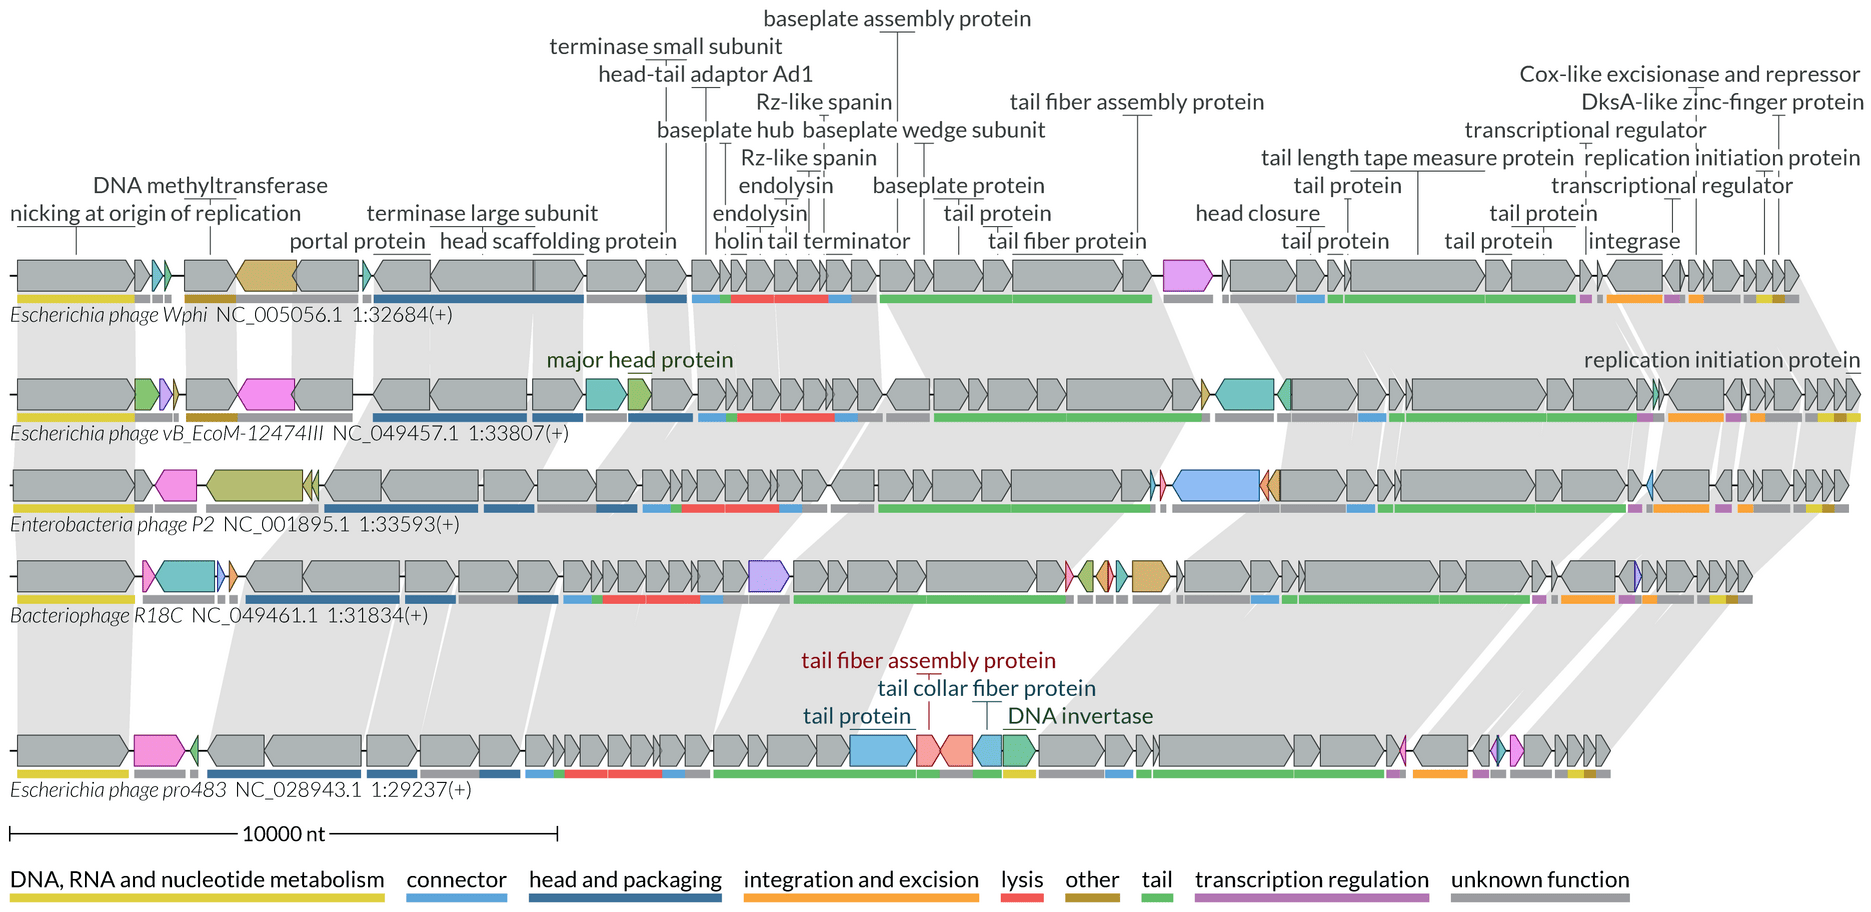
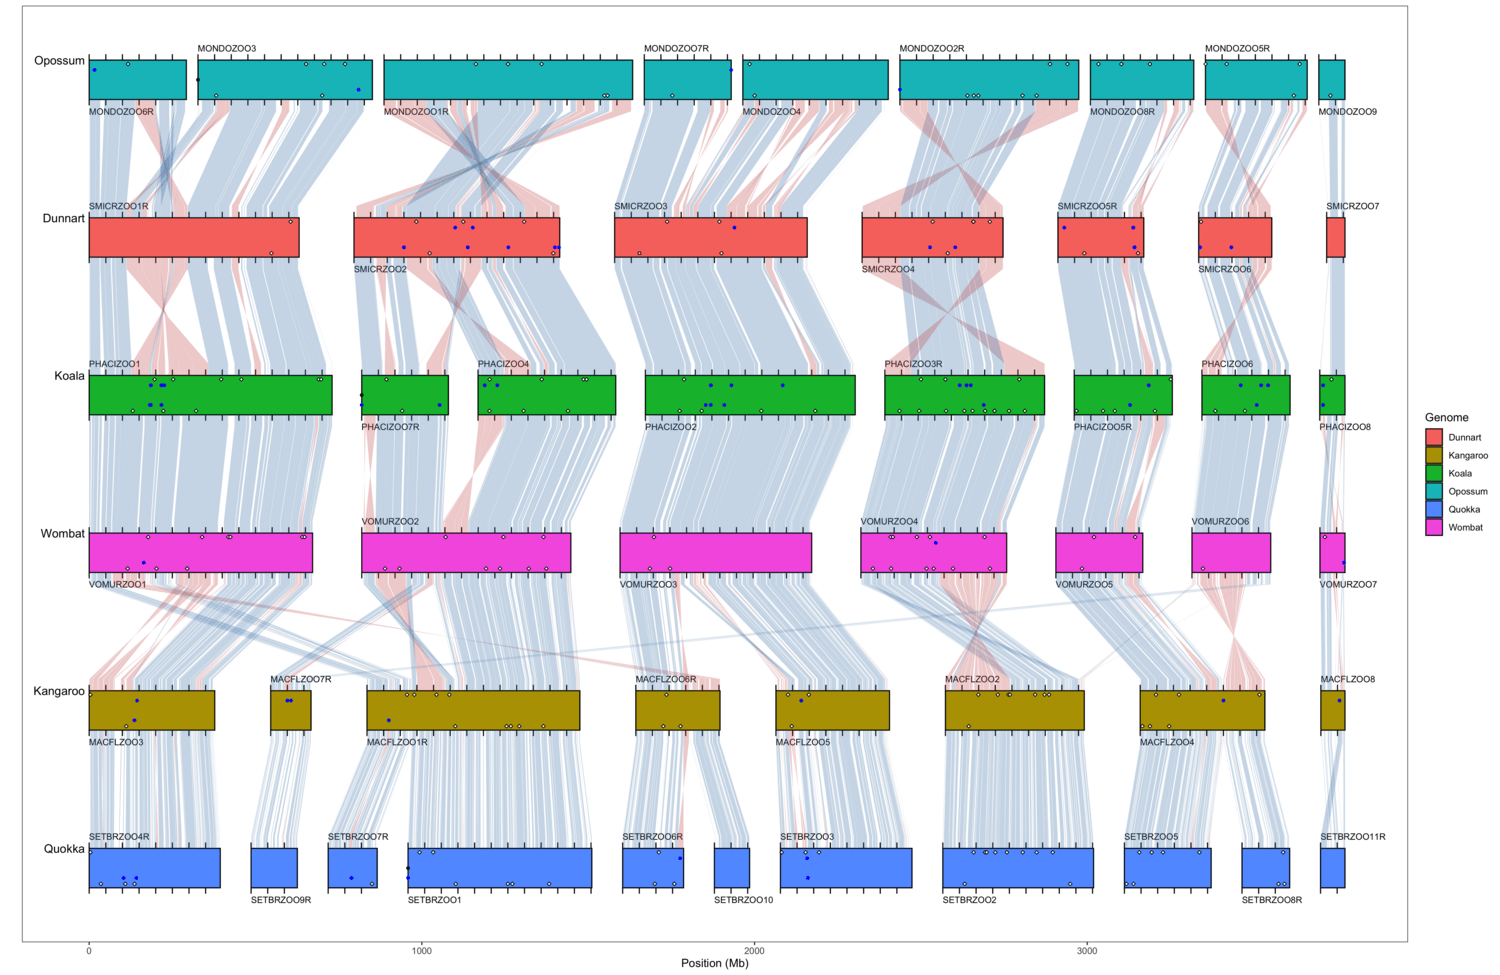
- chromsyn (img)
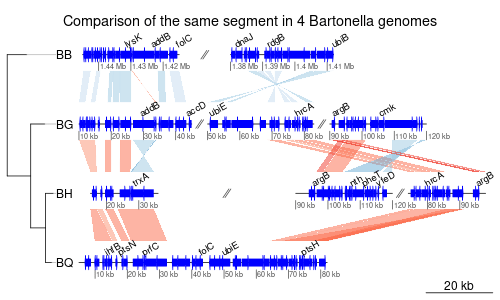
- genoPlotR (img)
- gggenomes (img)
- hoodini (Has a number of related repos for use in colab) (img)
- MCGV (img)
- Mumemto (img)
- NGenomeSyn (See also RectChr) (img)
- ntSynt (Uses gggenomes) (img)
- pauvre (img)
- SVbyEye (AKA plotAVA) (img)
- TidyLocalSynteny (img)
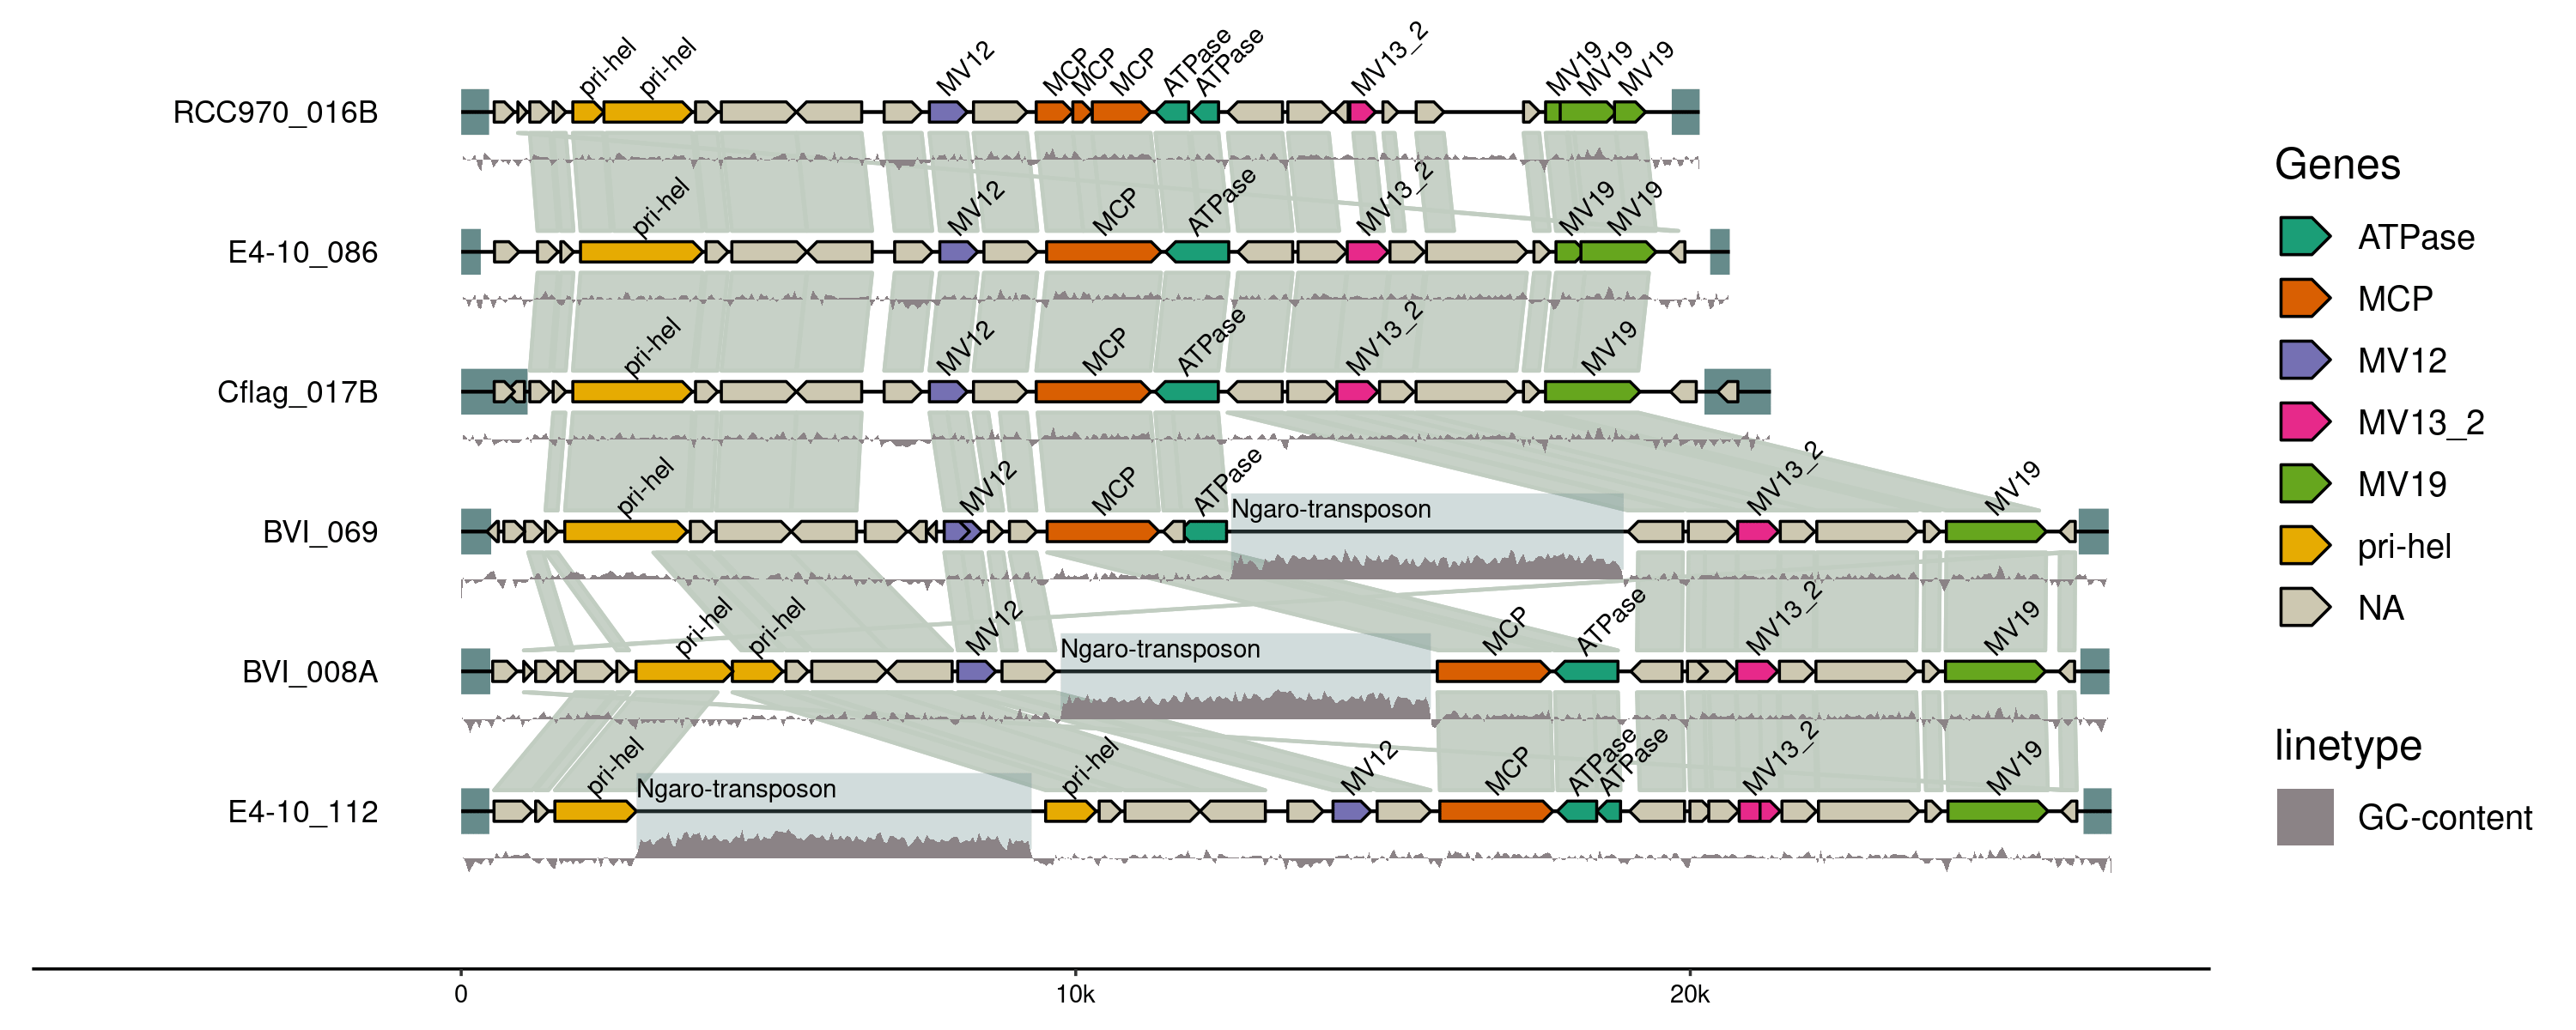
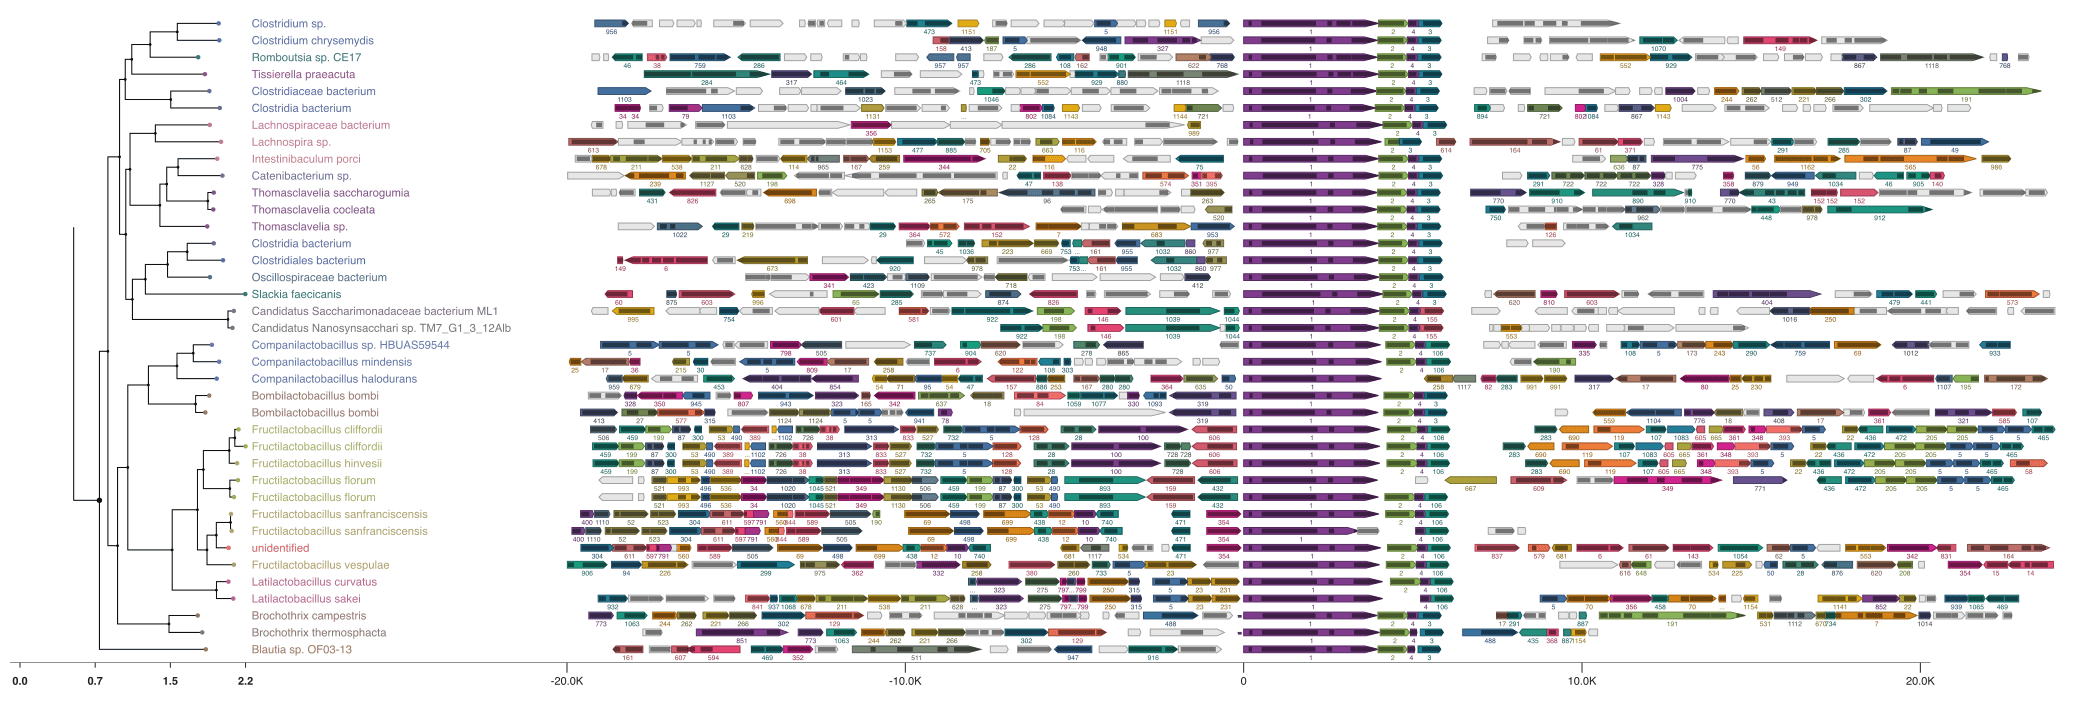
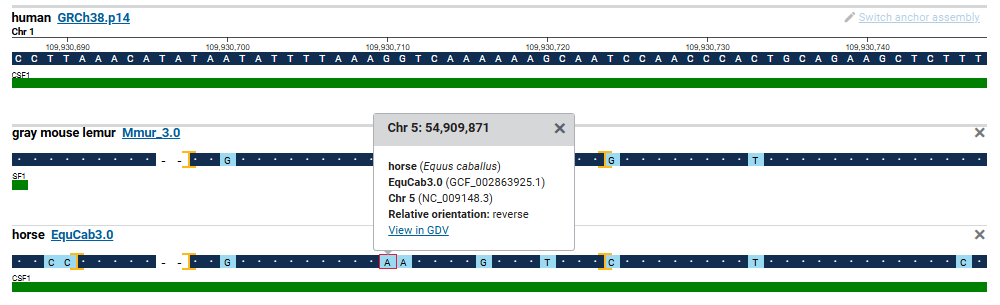
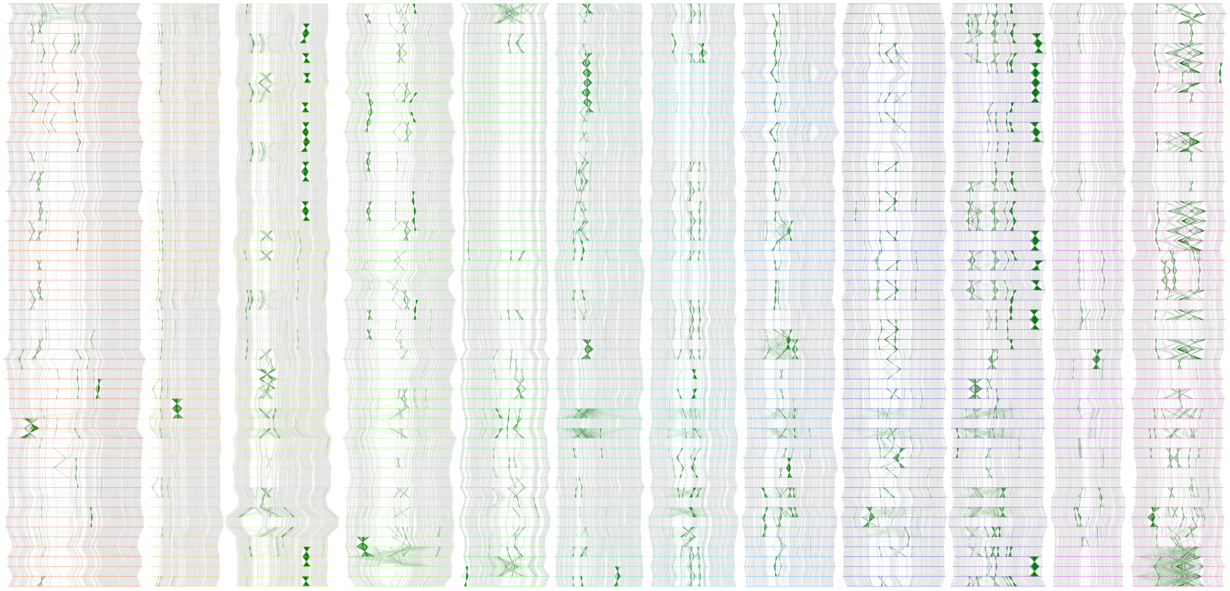
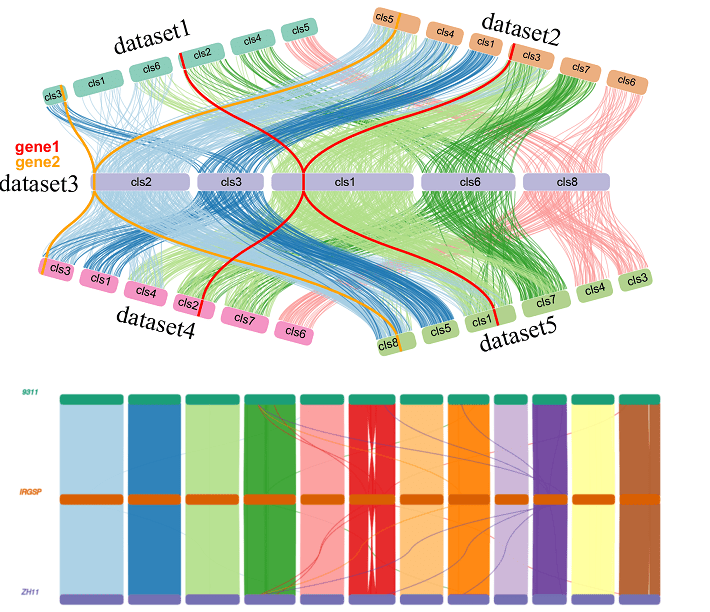
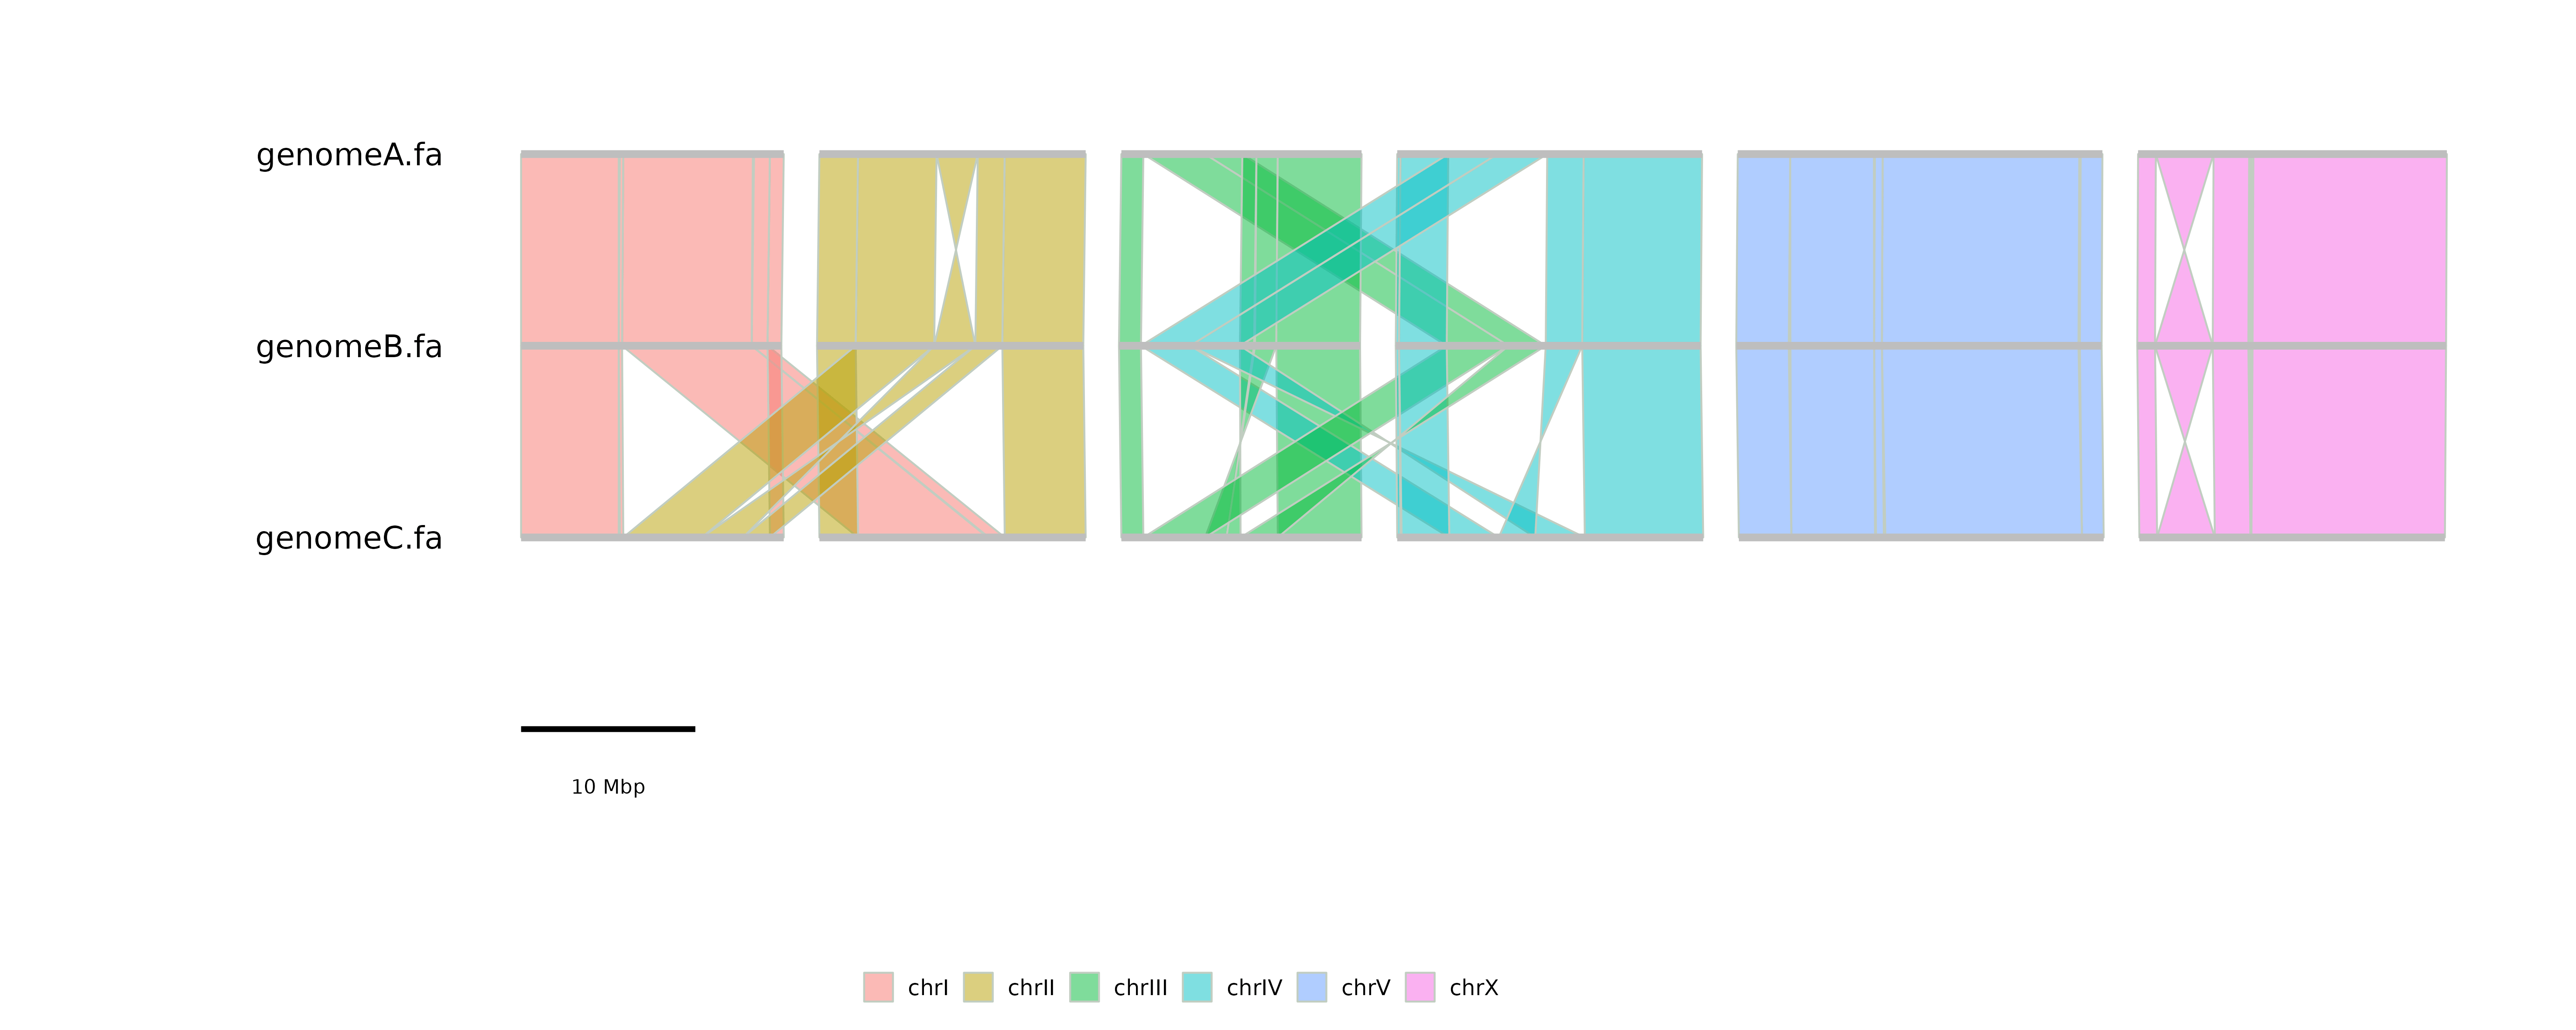
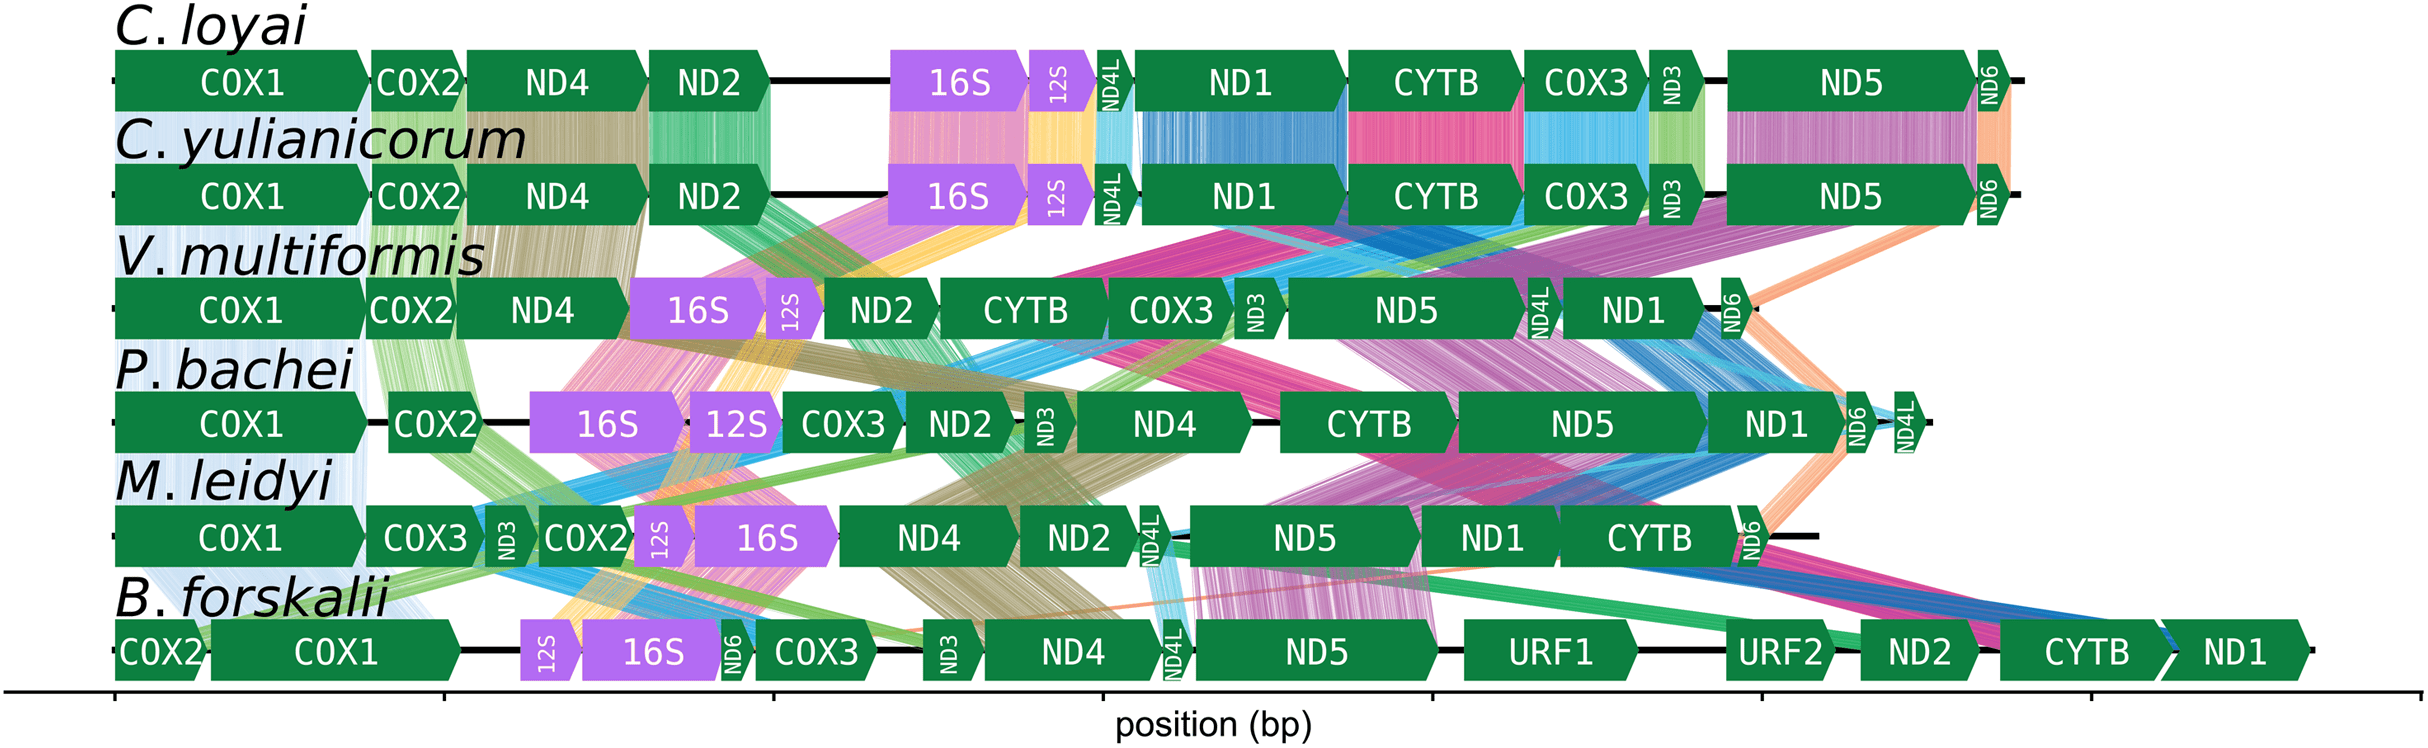
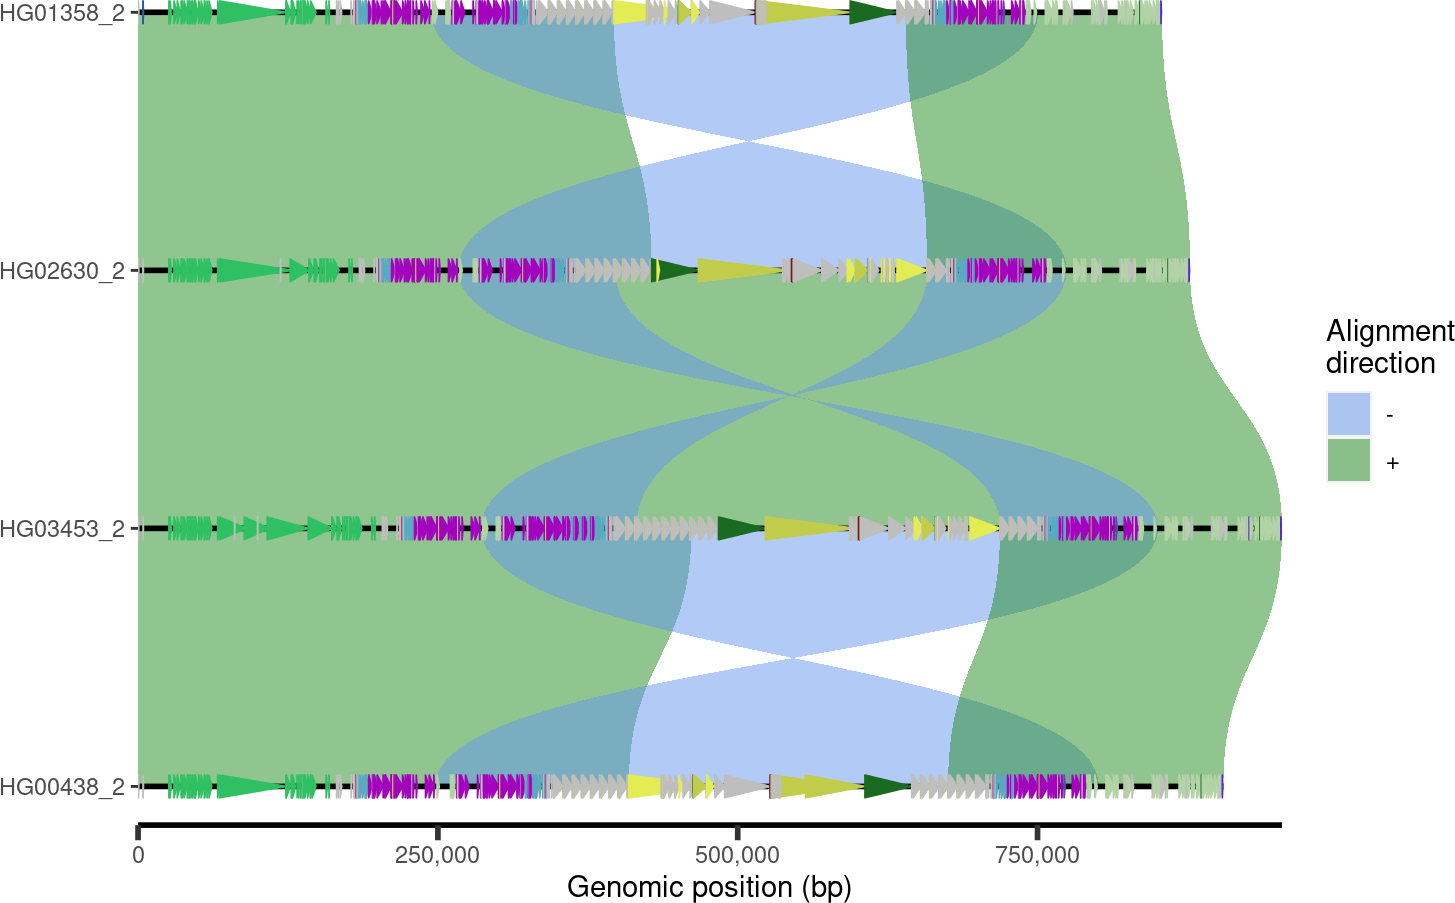
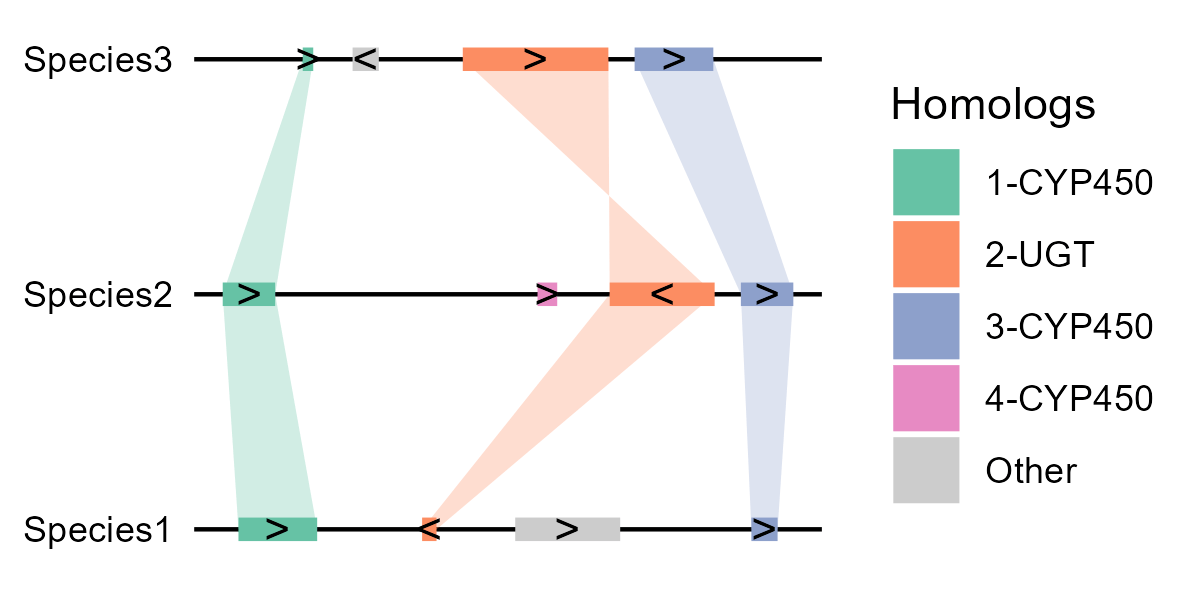
- BigTop (img)
- Cylindrical alignment app (img)
- DNASkittle (img)
- FluentDNA (img)
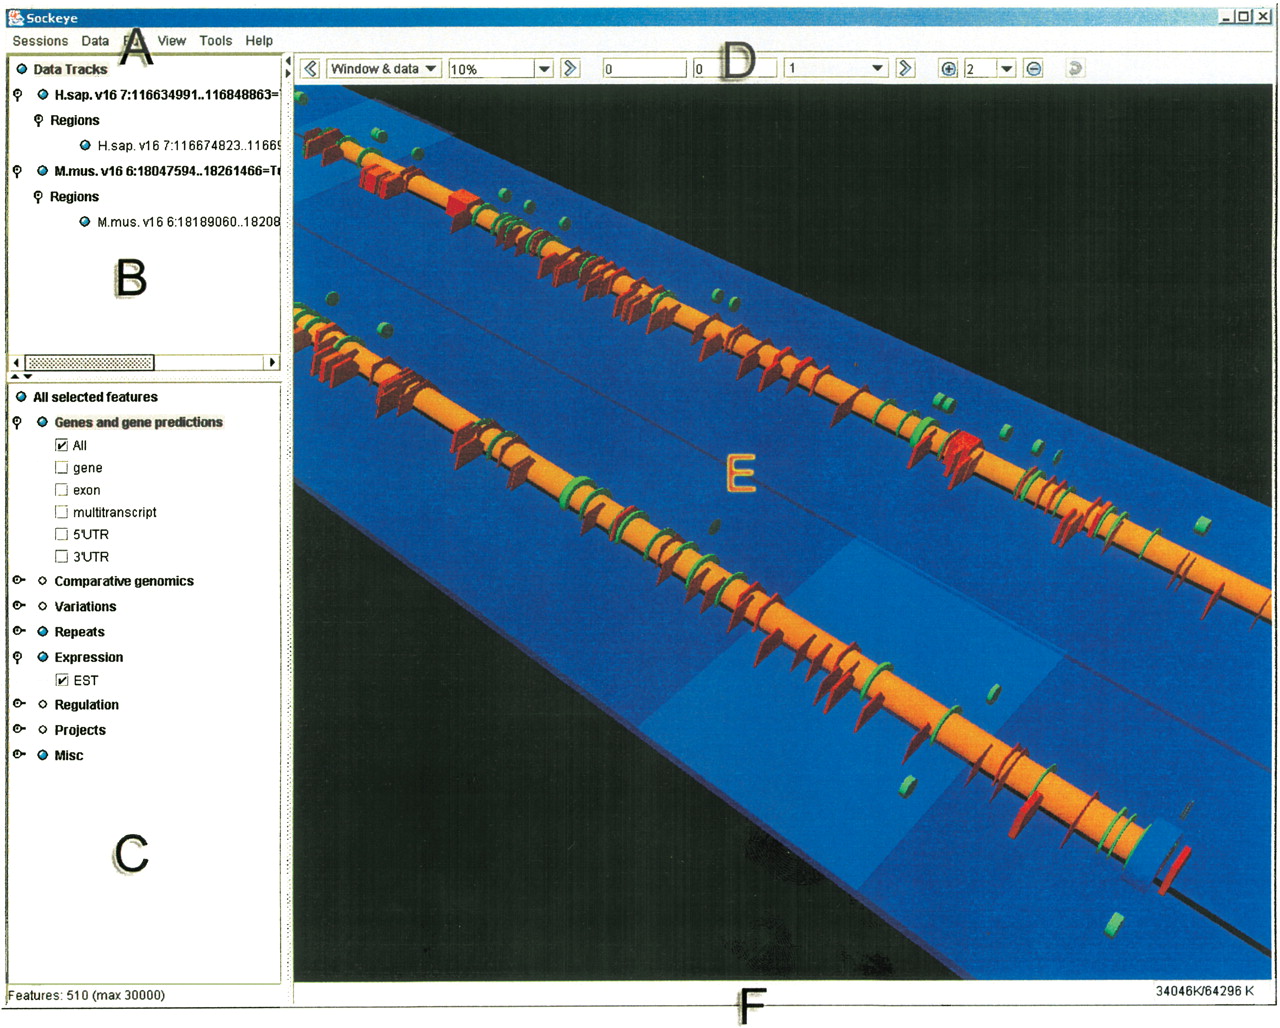
- sockeye (img)
- spinteny (img)
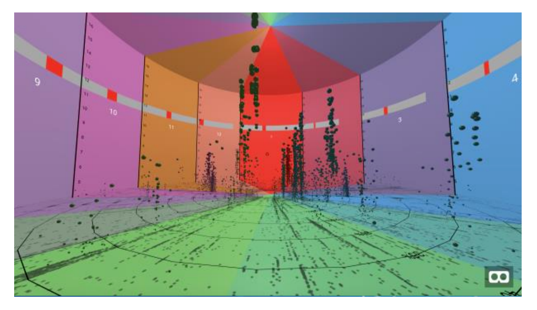
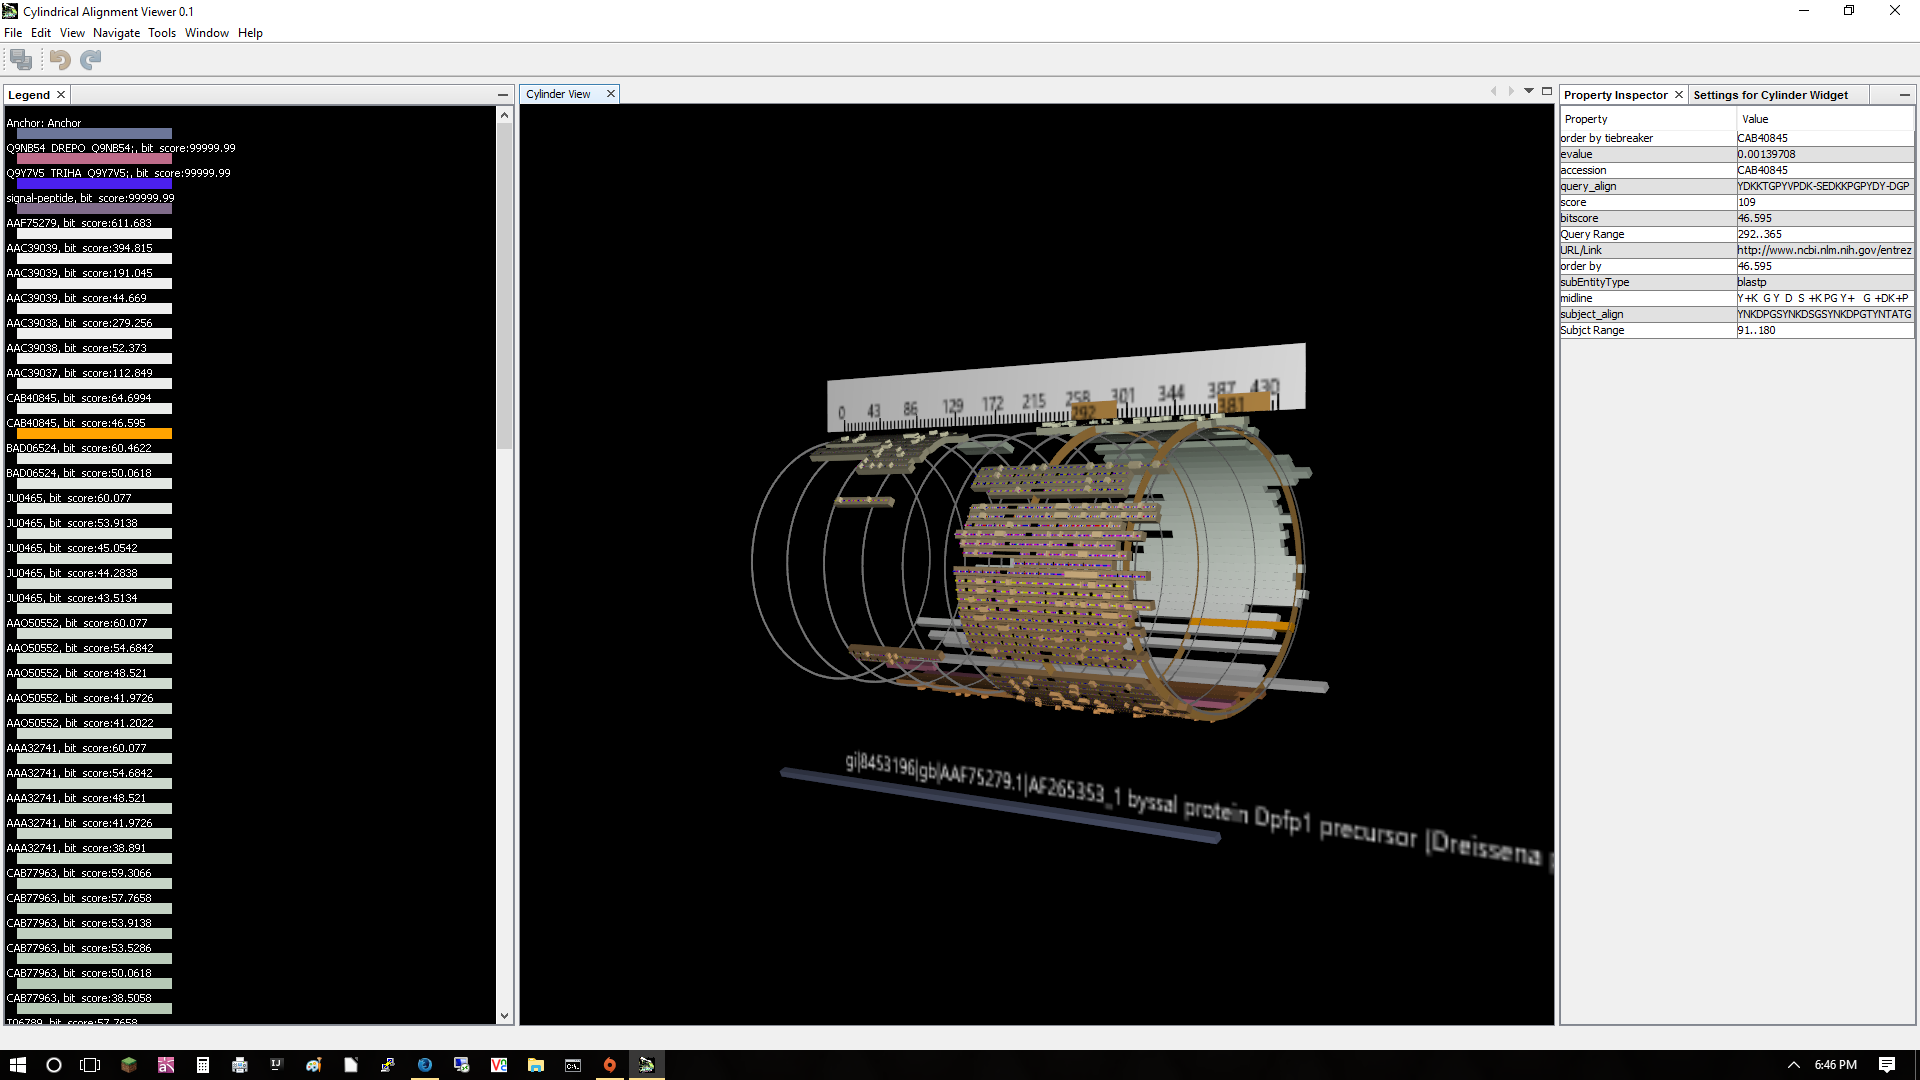
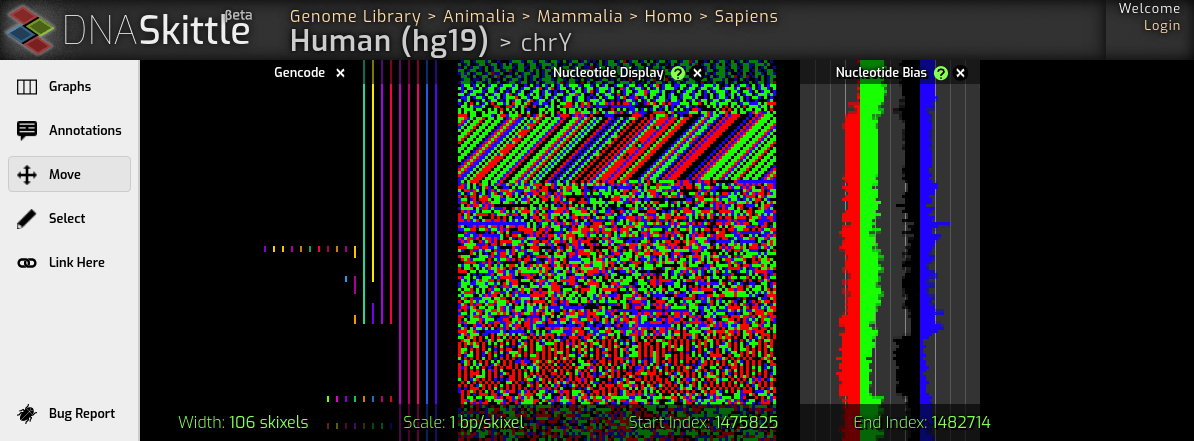

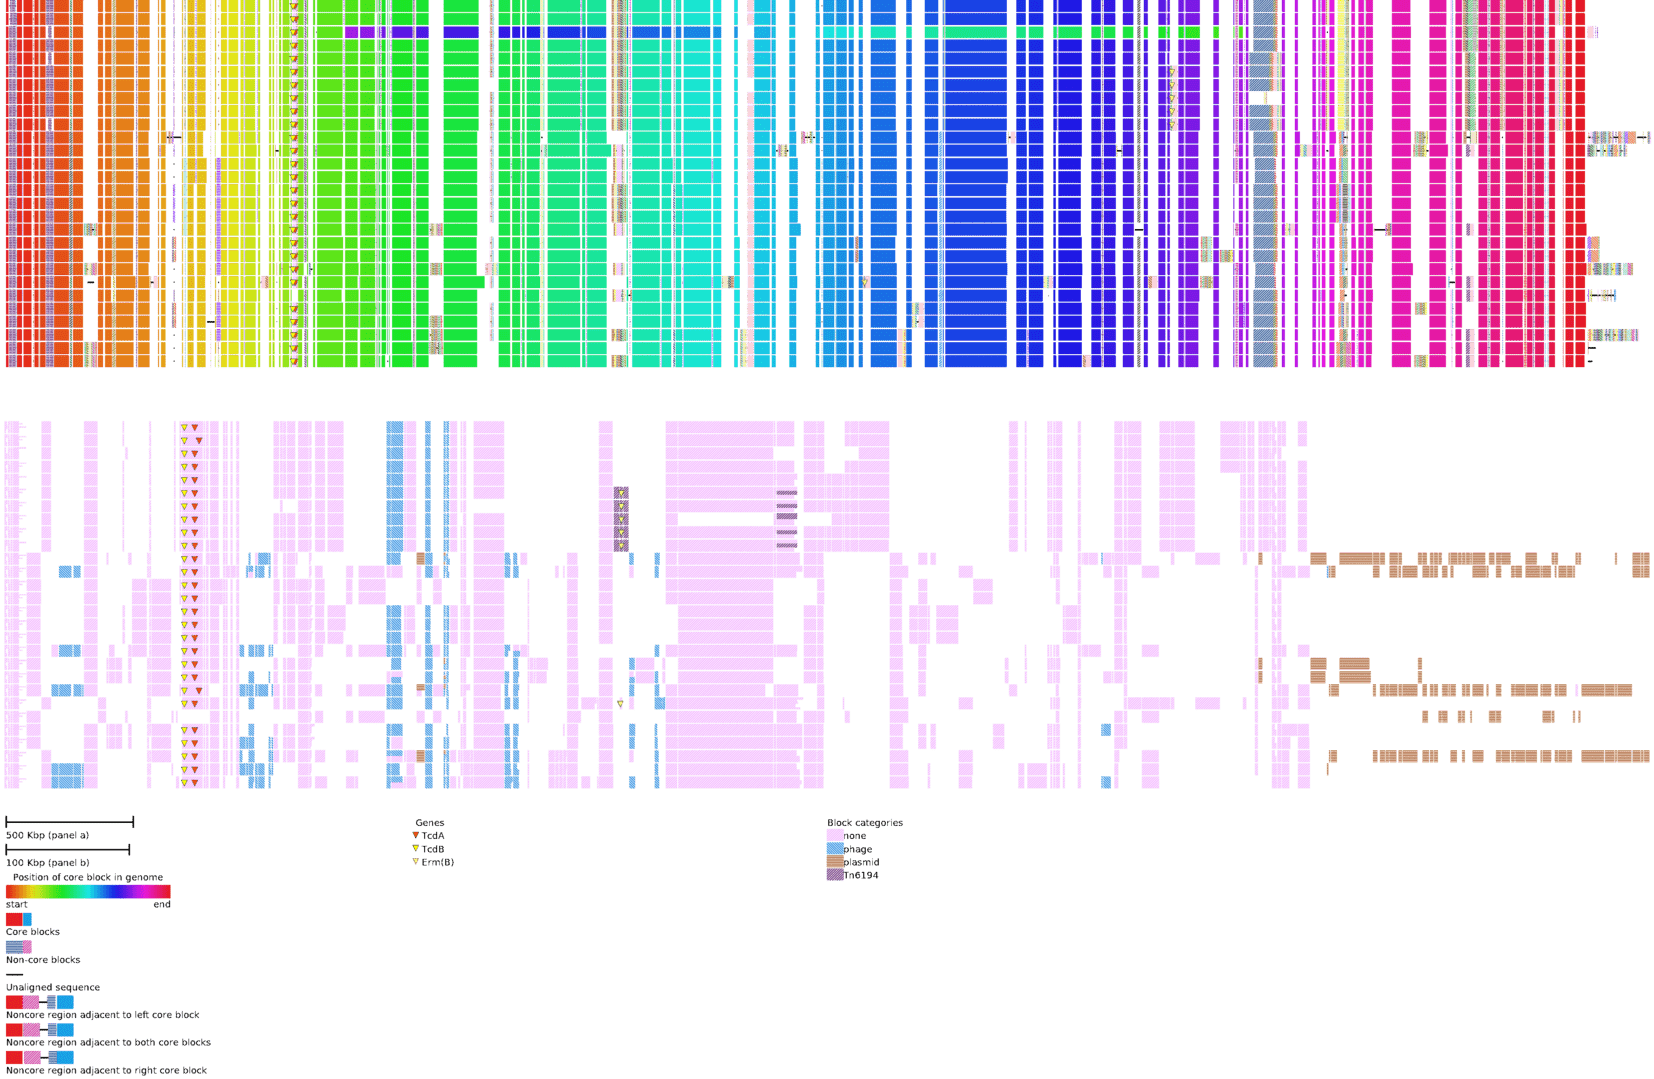
- Chromatiblock (img)
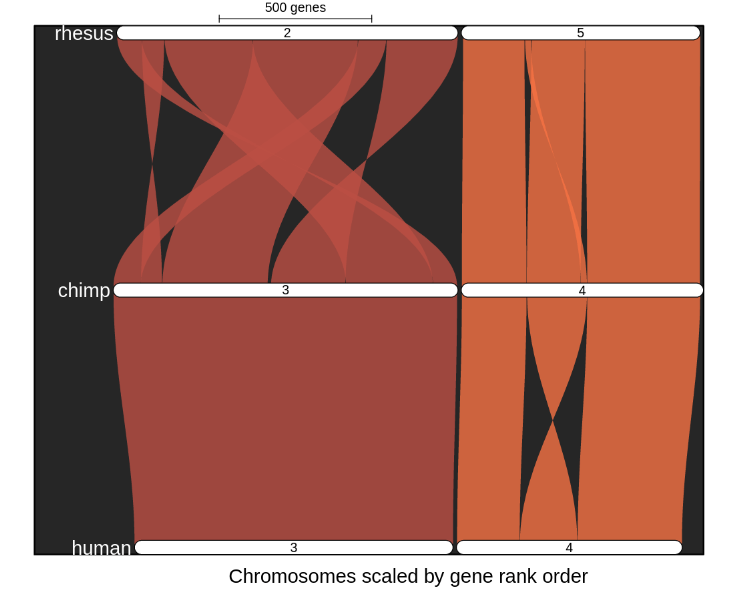
- GENESPACE (Note: plots in 'gene space' instead of actual genome coordinates. Includes a powerful analysis pipeline, worth reading the paper. See also DEEPSPACE, which uses genome coordinates and whole genome alignments) (img)
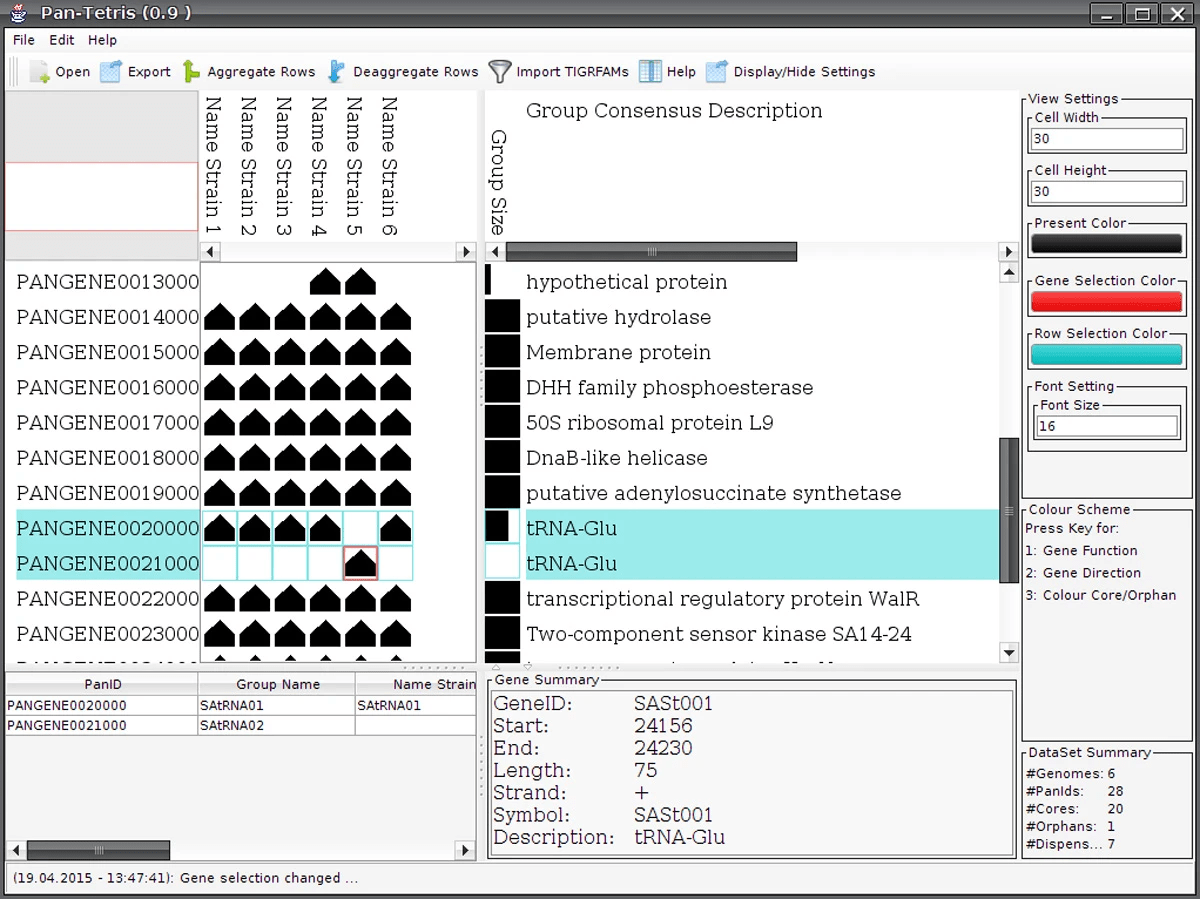
- Pan-Tetris (img)
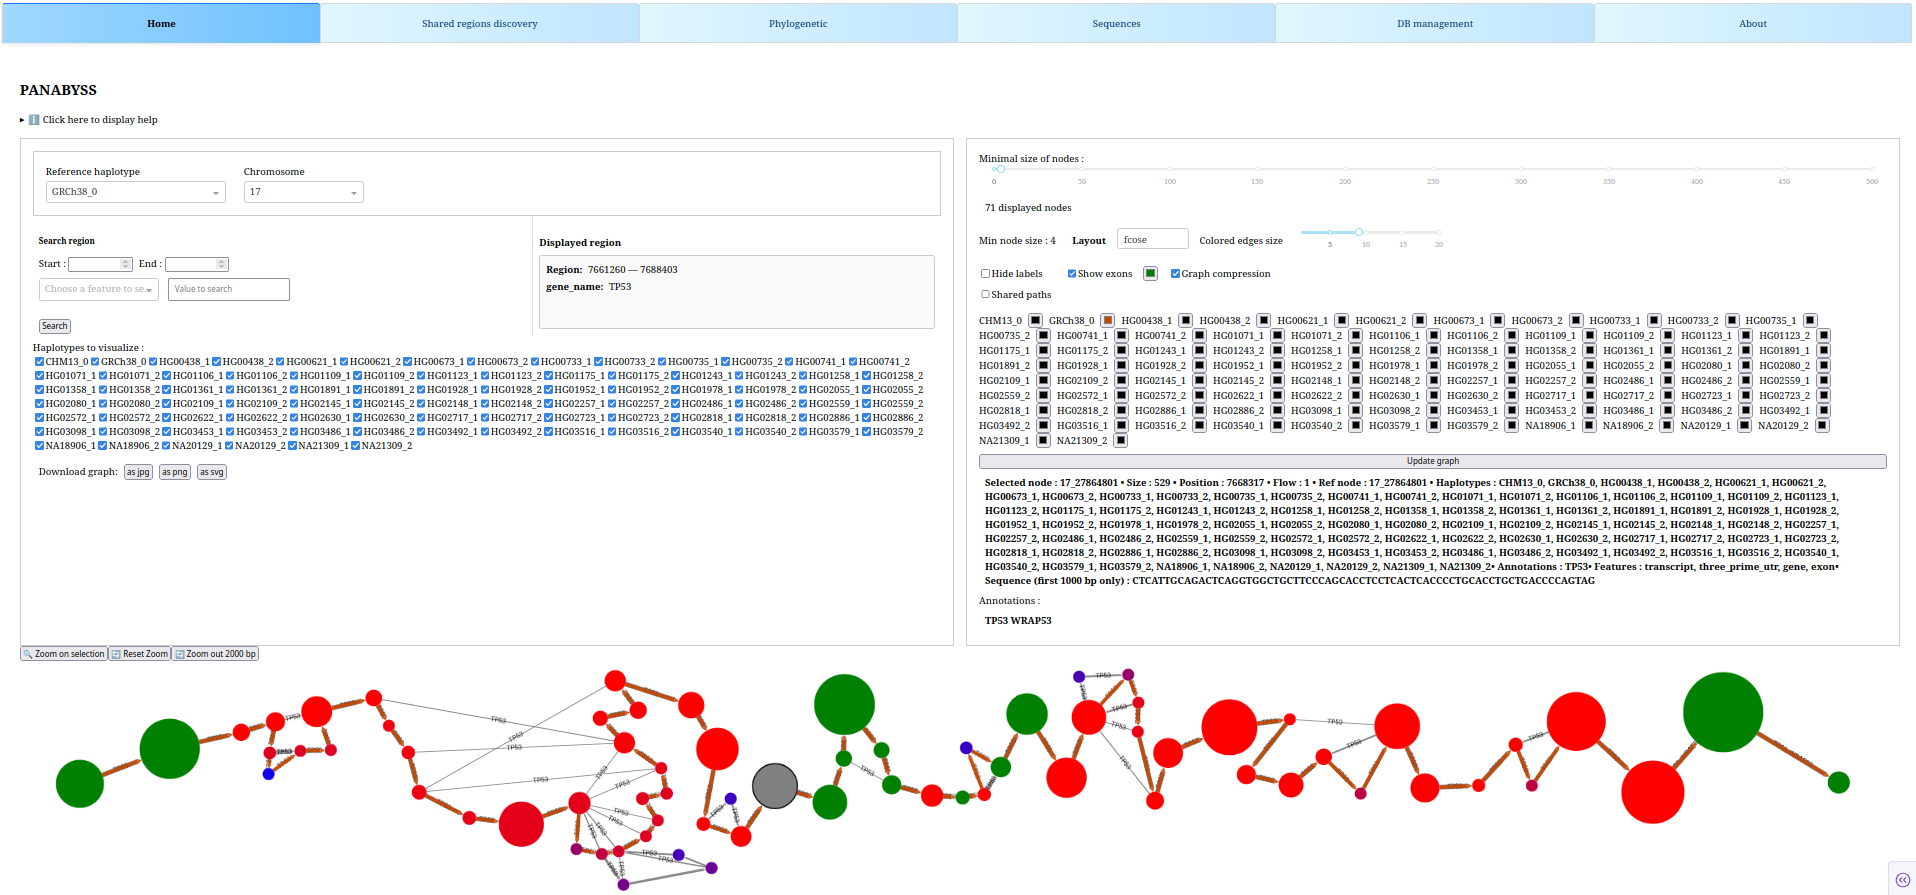
- PanAbyss (Exploring and visualizing large pangenome graphs with PanAbyss: search by coordinates or annotations, identify regions shared by individuals or populations, and access other interactive features. Uses cytoscape.js) (img)
- Panacaea (img)
- Panache (img)
- panX (img)
- PGAP-X (img)
- PGV (pangenome tool) (img)
- Phandango (img)
- RPAN (3kricedb) (img)
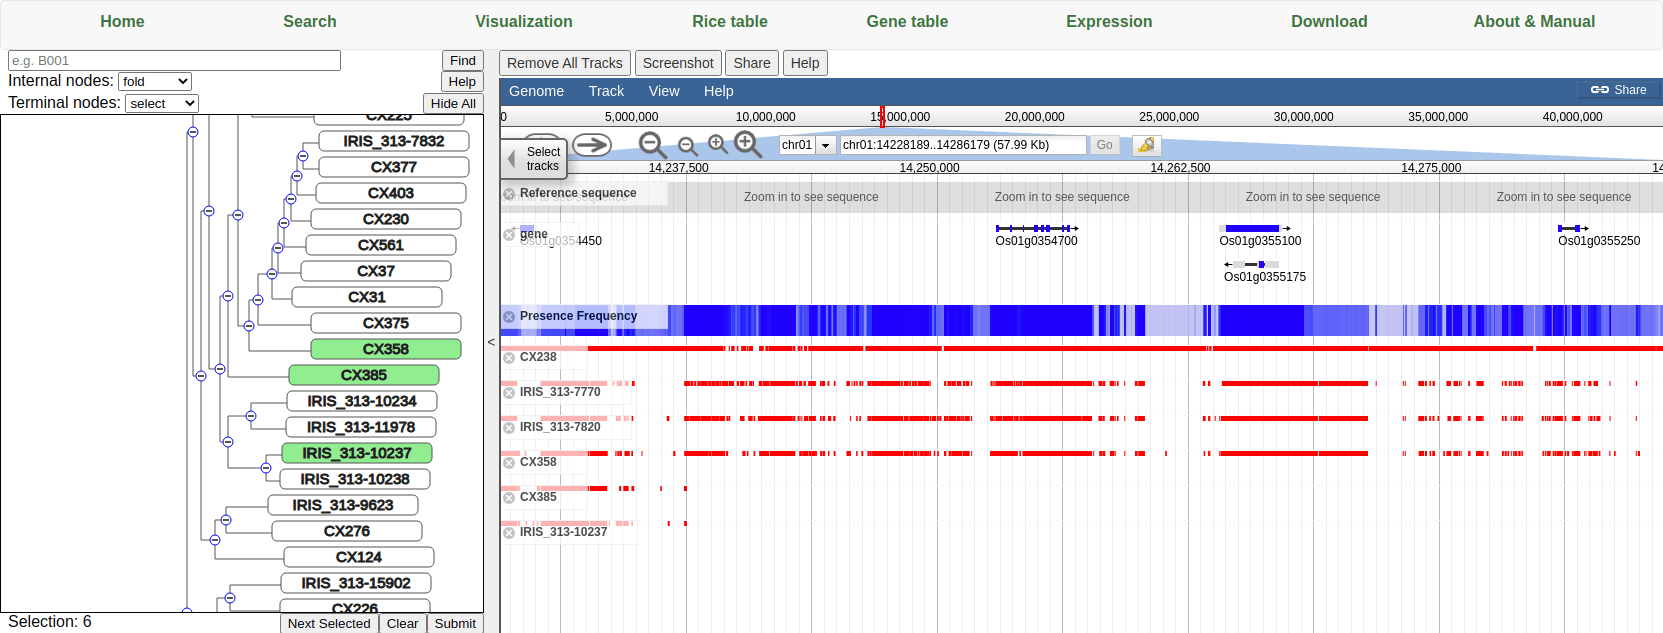
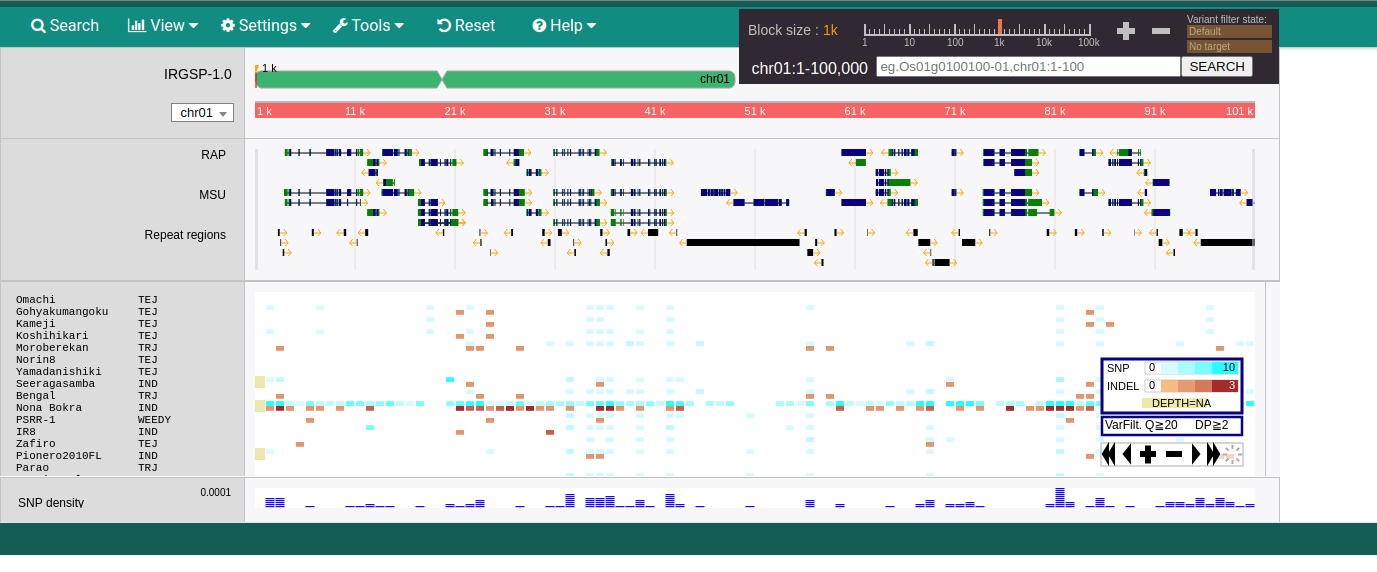
- TASUKE (Visualization of multiple genomes resequencing data from species having larger genome. Requires a LAMP server ) (img)
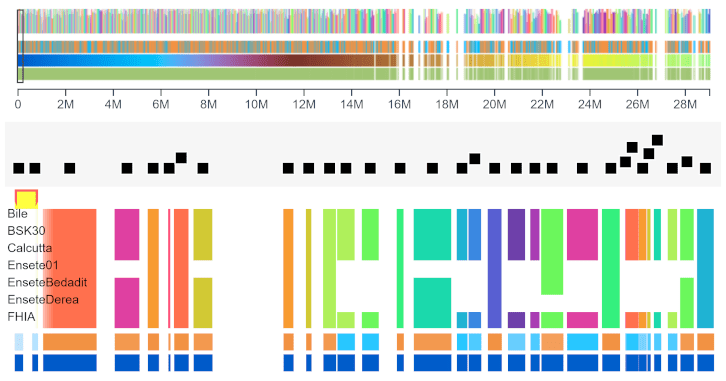
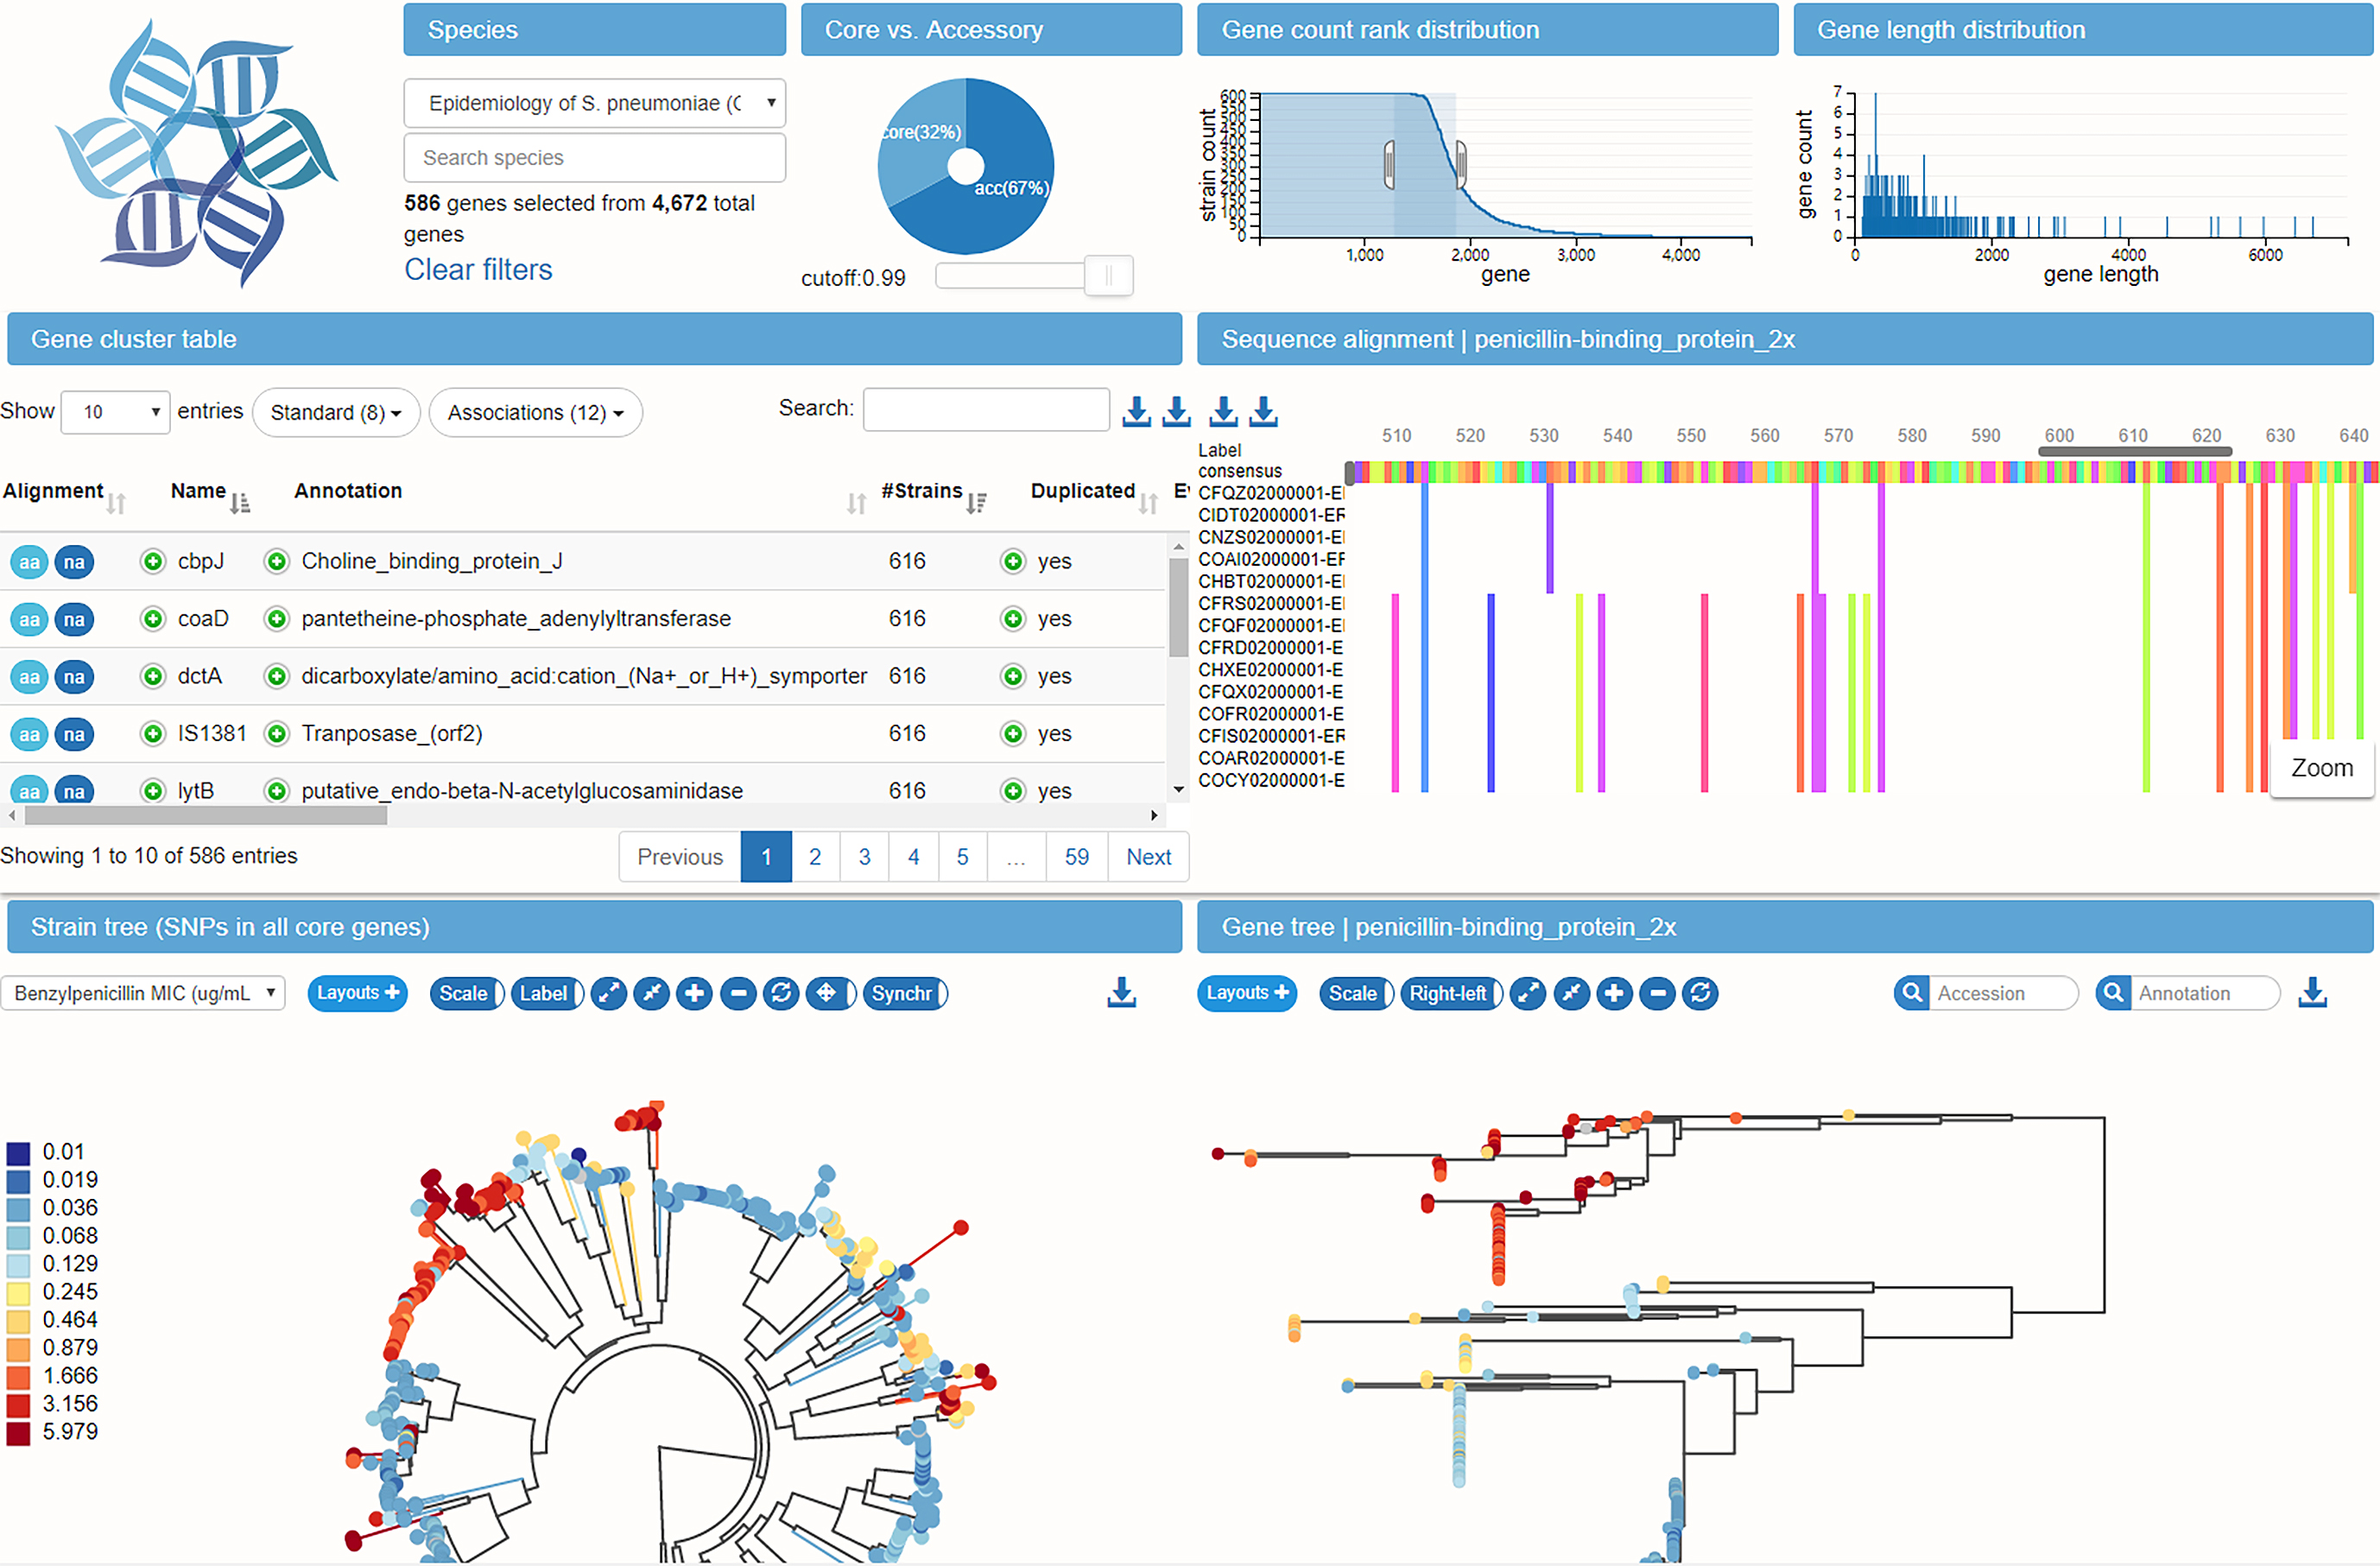
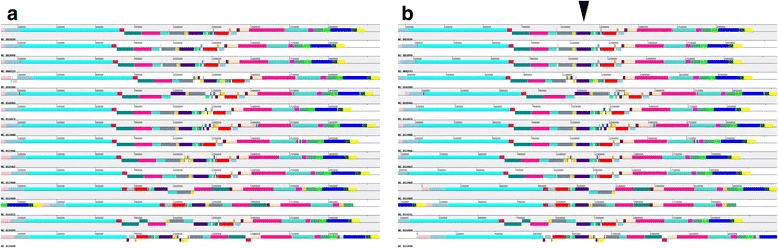
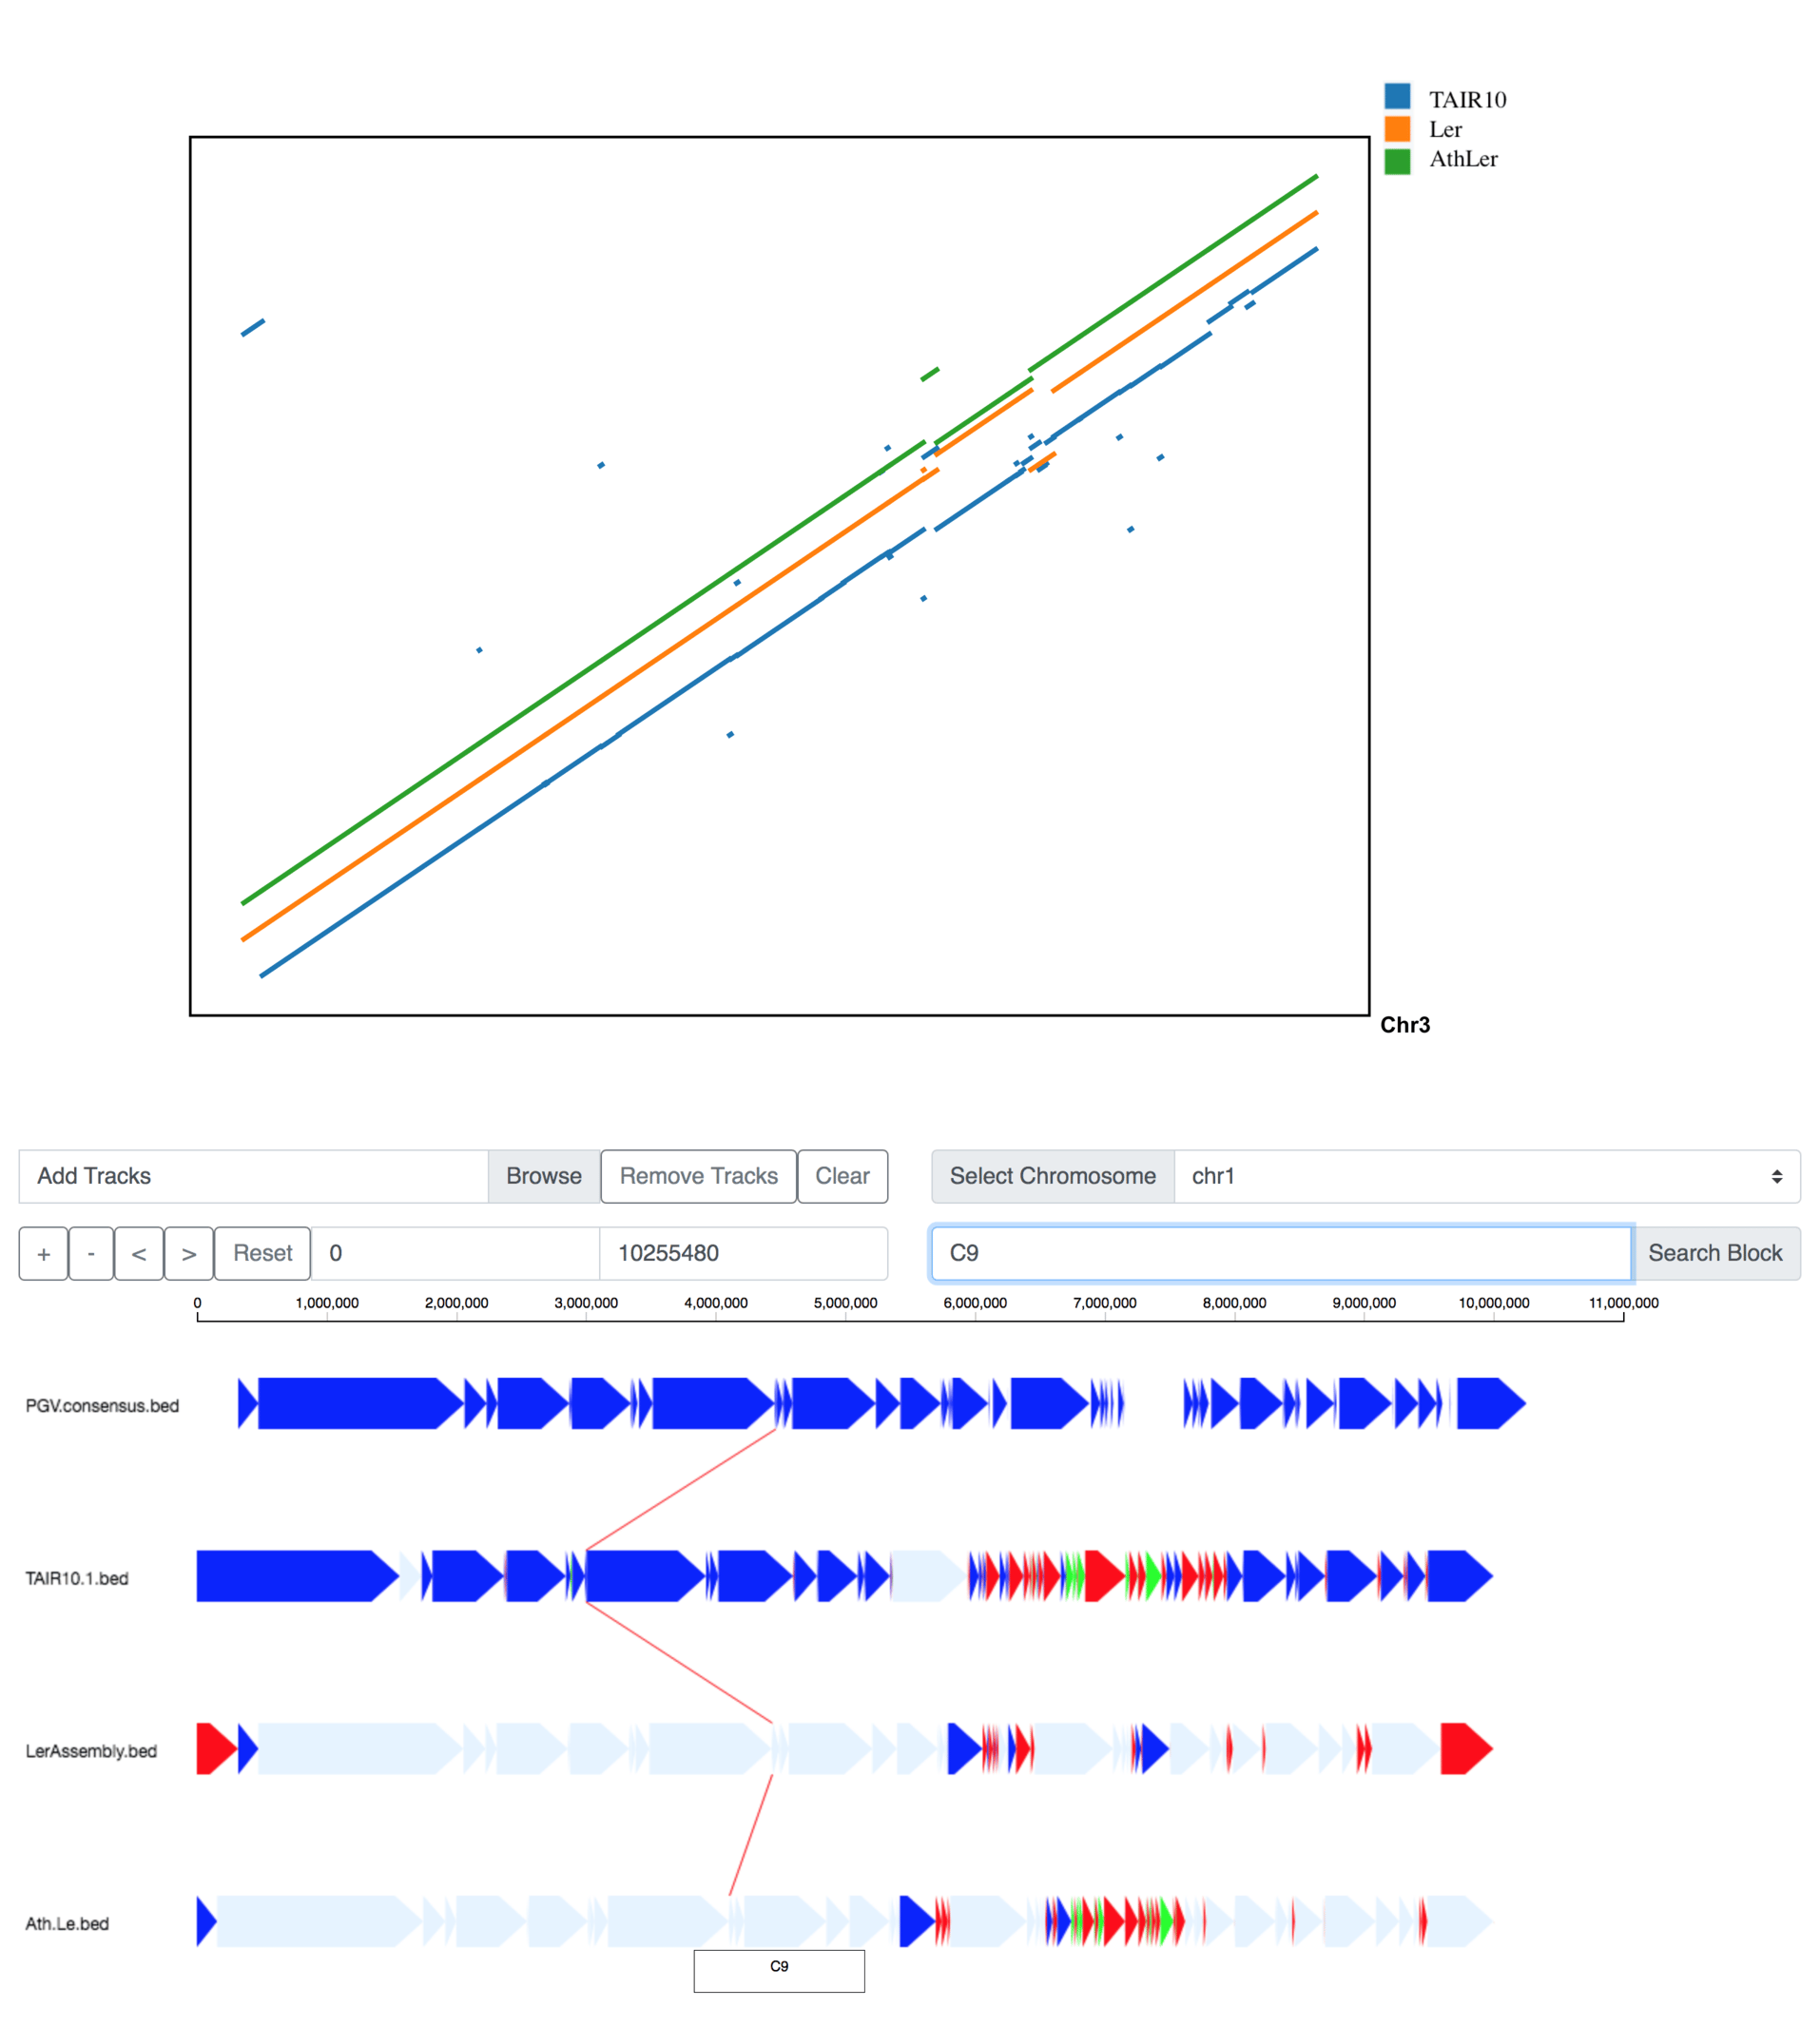
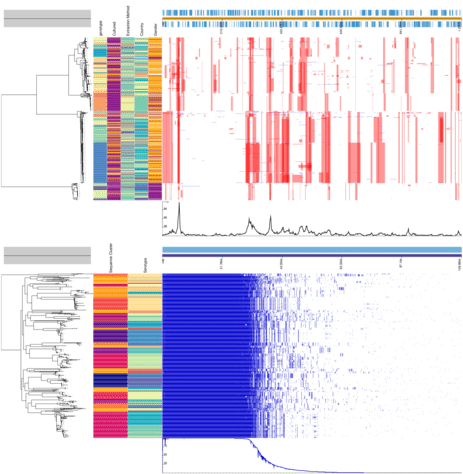
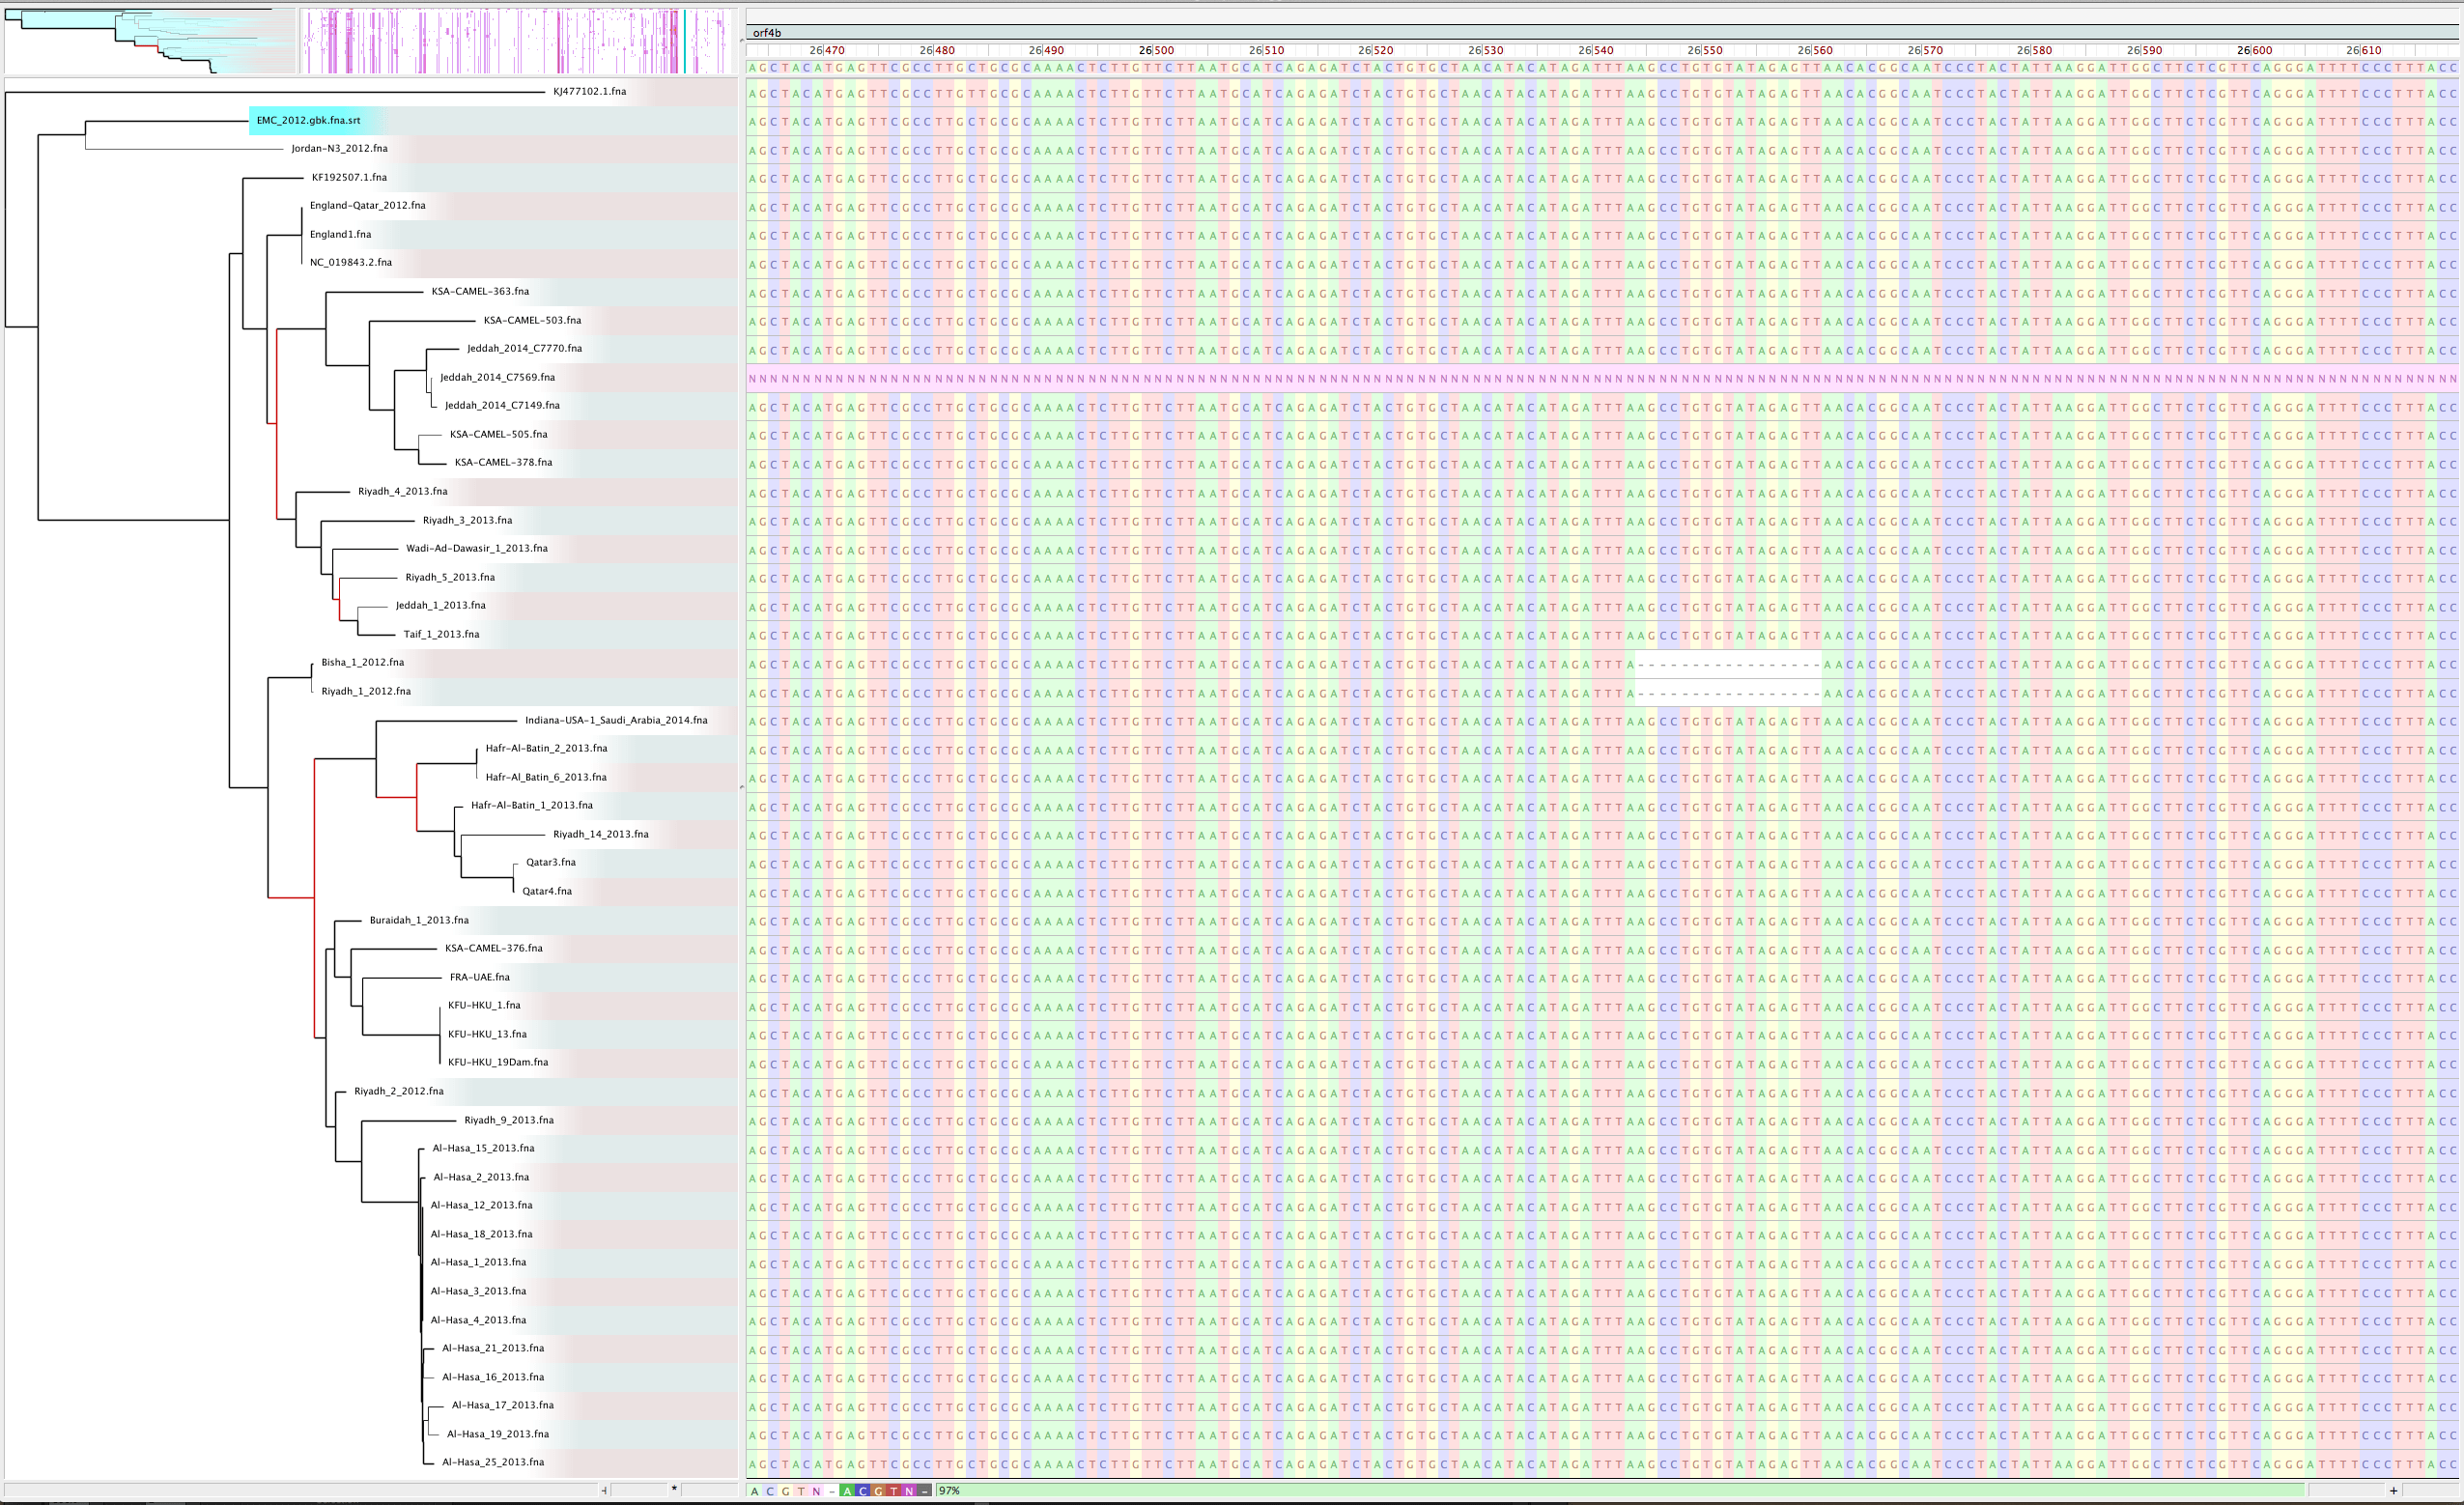
- Gingr (img)
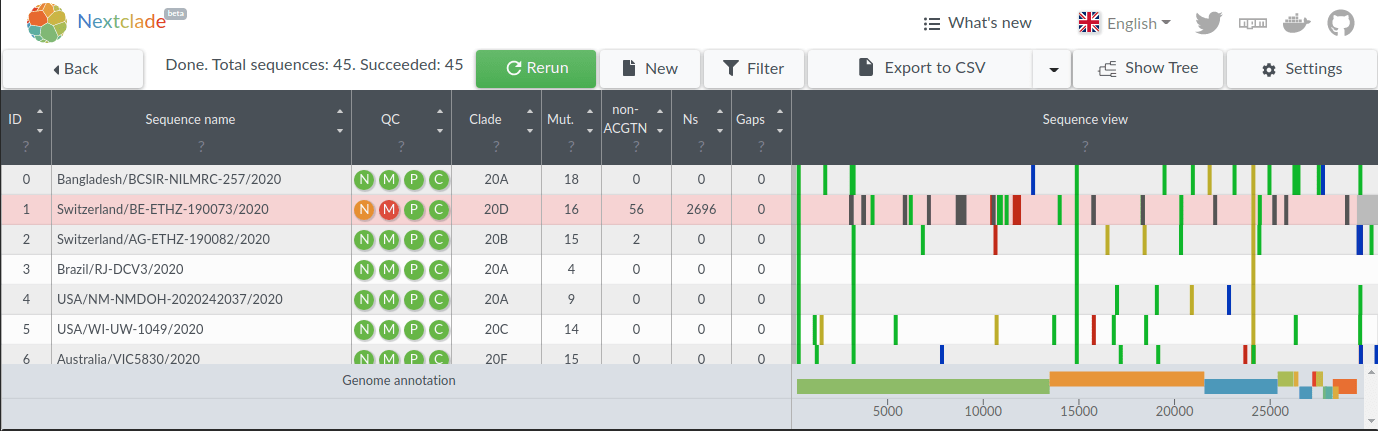
- Nextclade (Related usage on nextstrain app also) (img)
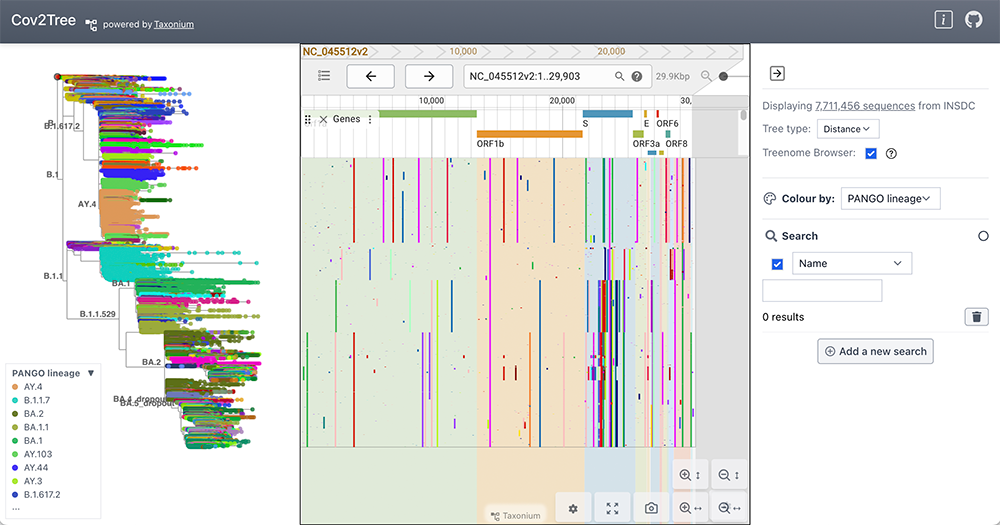
- Taxonium (Genome variation visualisation in Taxonium is provided by the 'Treenome Viewer': https://academic.oup.com/bioinformatics/article/39/1/btac772/6858450) (img)
- TreeBrowser (MicrobesOnline) (img)
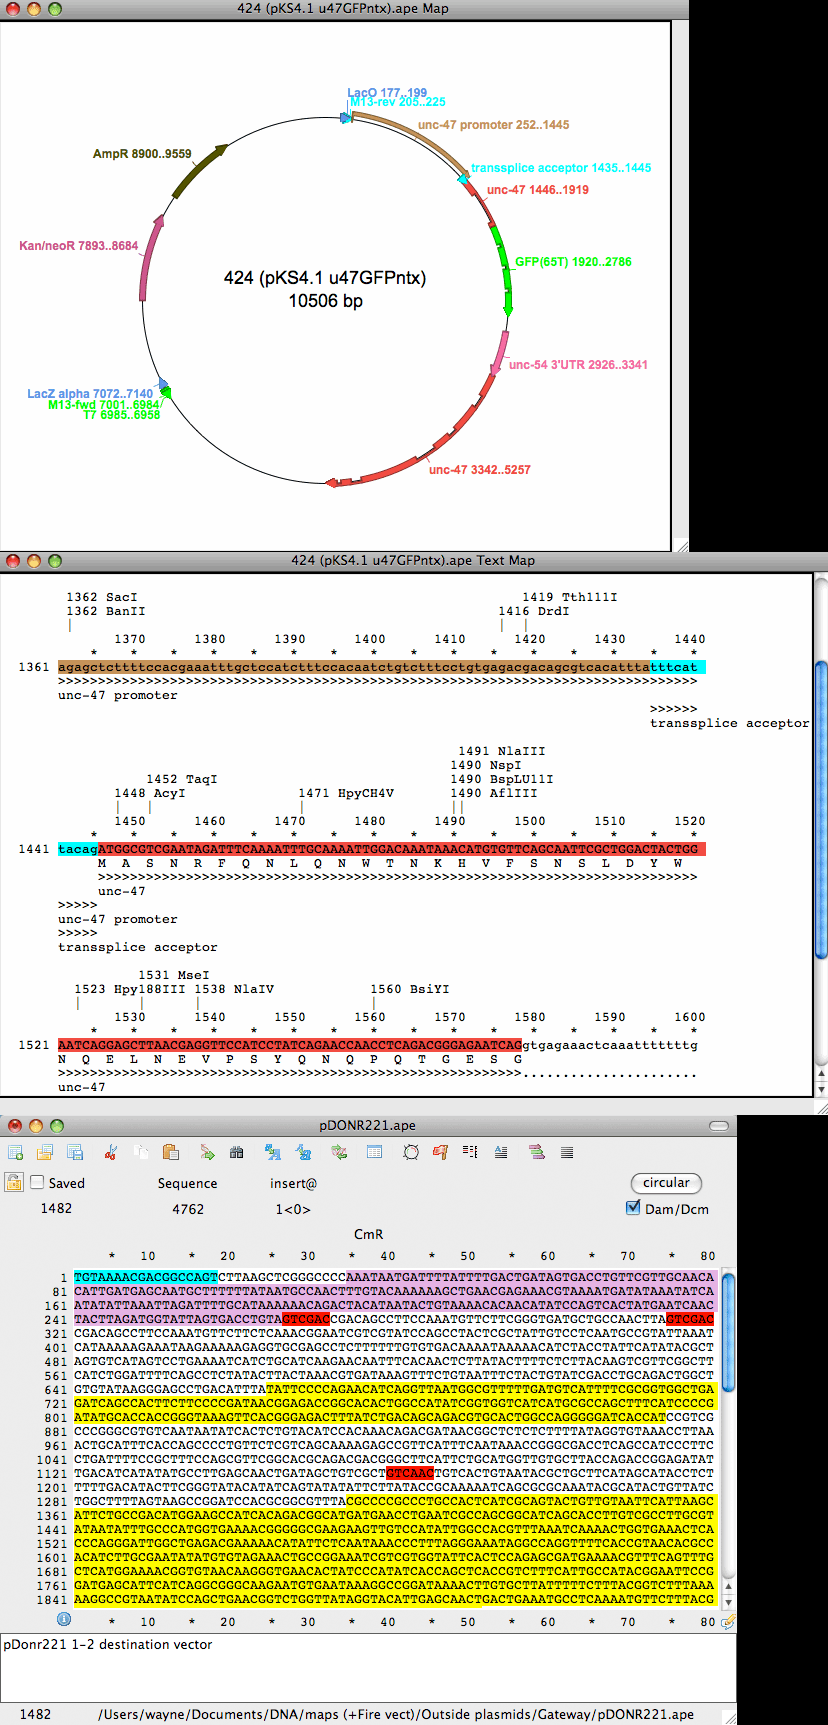
- ApE (a plasmid editor) (img)
- clonifier (per github: 'A web app for viewing plasmid maps & genomes, and simulating PCR and Gibson assembly') (img)
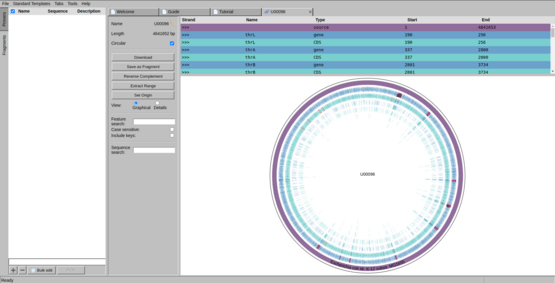
- GWAS catalog browser (img)
- Haploview (img)
- Human genome dating (made with vega/d3) (img)
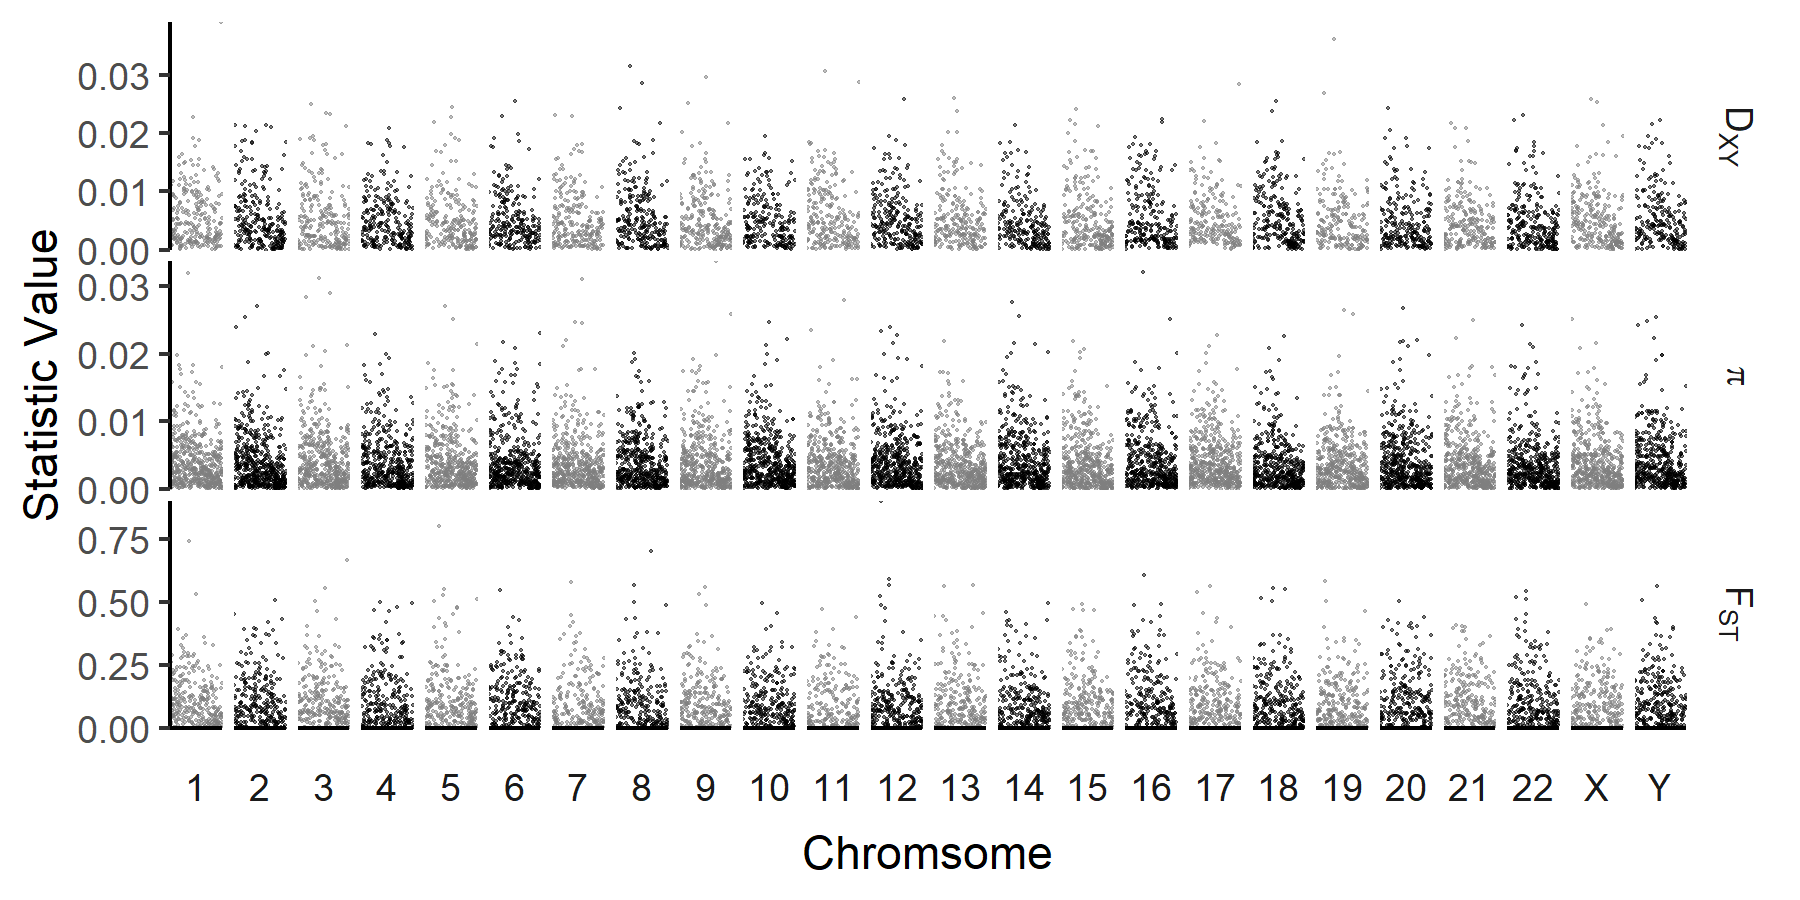
- pixy (The link in readthedocs shows a nice general purpose way to plot multi-chromosome plots in ggplot2 with facet grid. Alternative methods for multi-chromosome plots shown by the manhattan ggplot2 tutorial (https://danielroelfs.com/blog/how-i-create-manhattan-plots-using-ggplot/ uses cumulative bp instead of facet_grid)) (img)
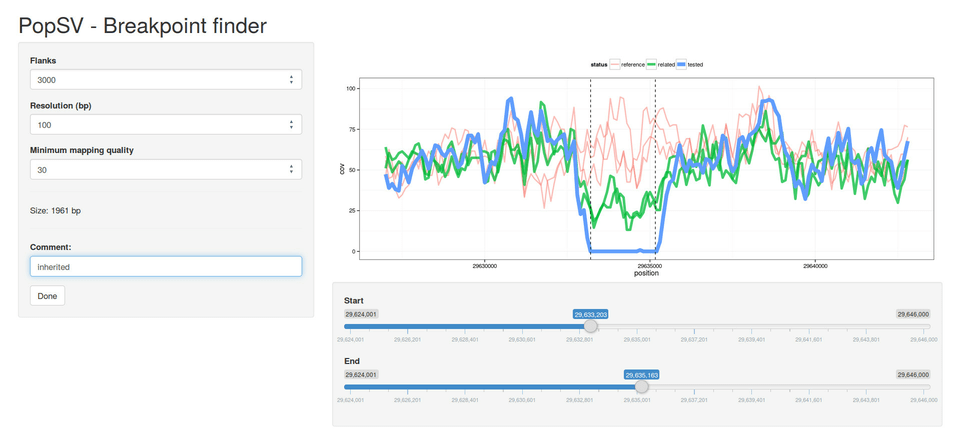
- PopSV (img)
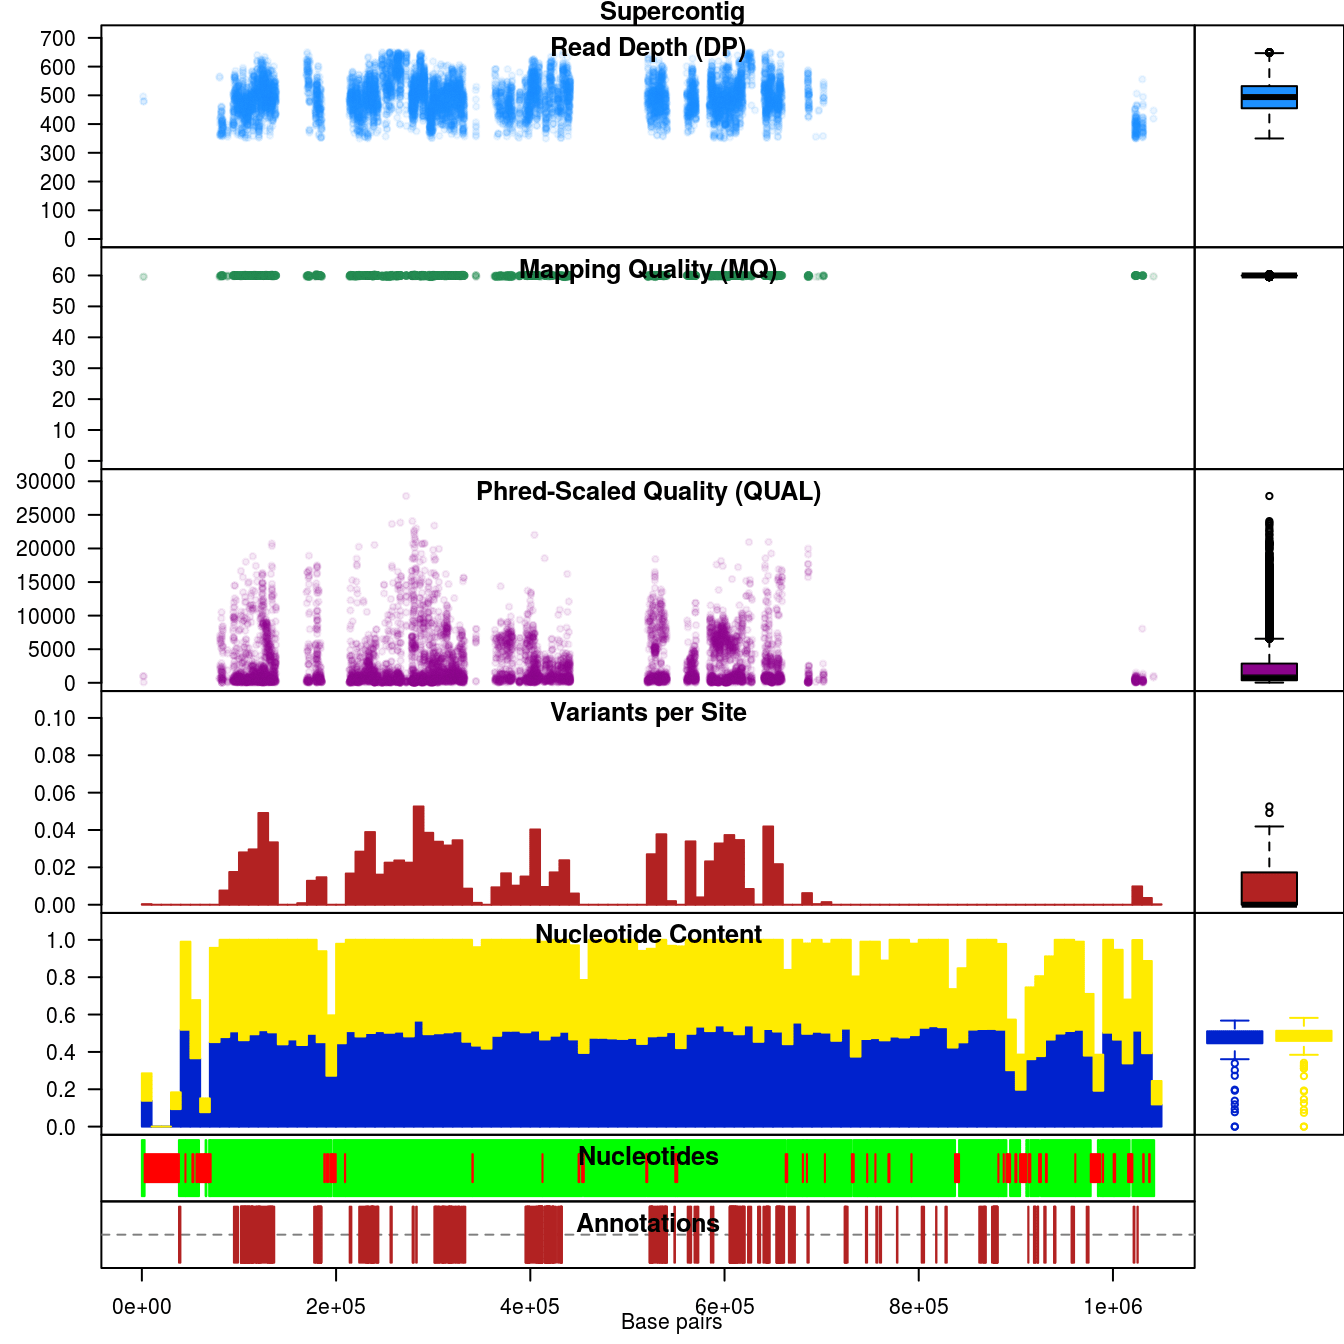
- vcfR (image shows chromoqc output) (img)
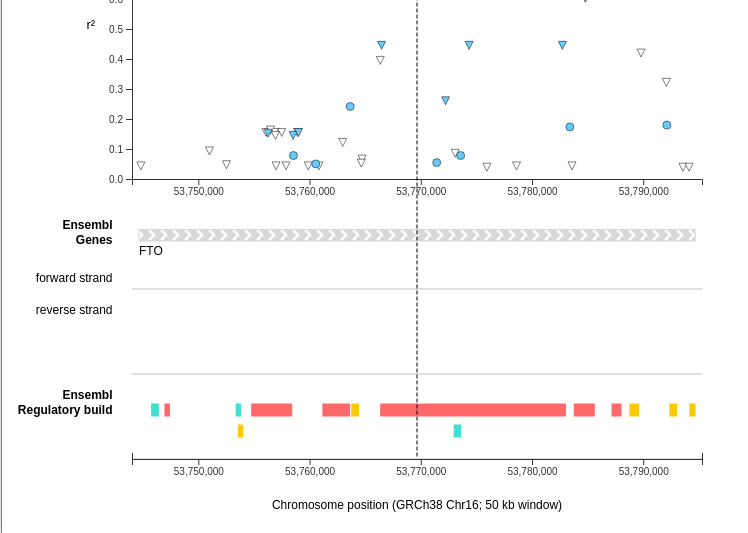
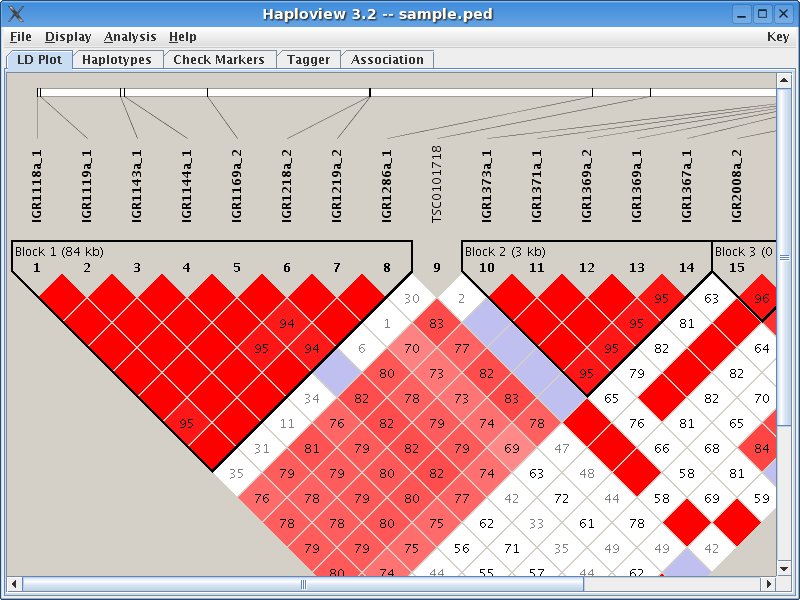
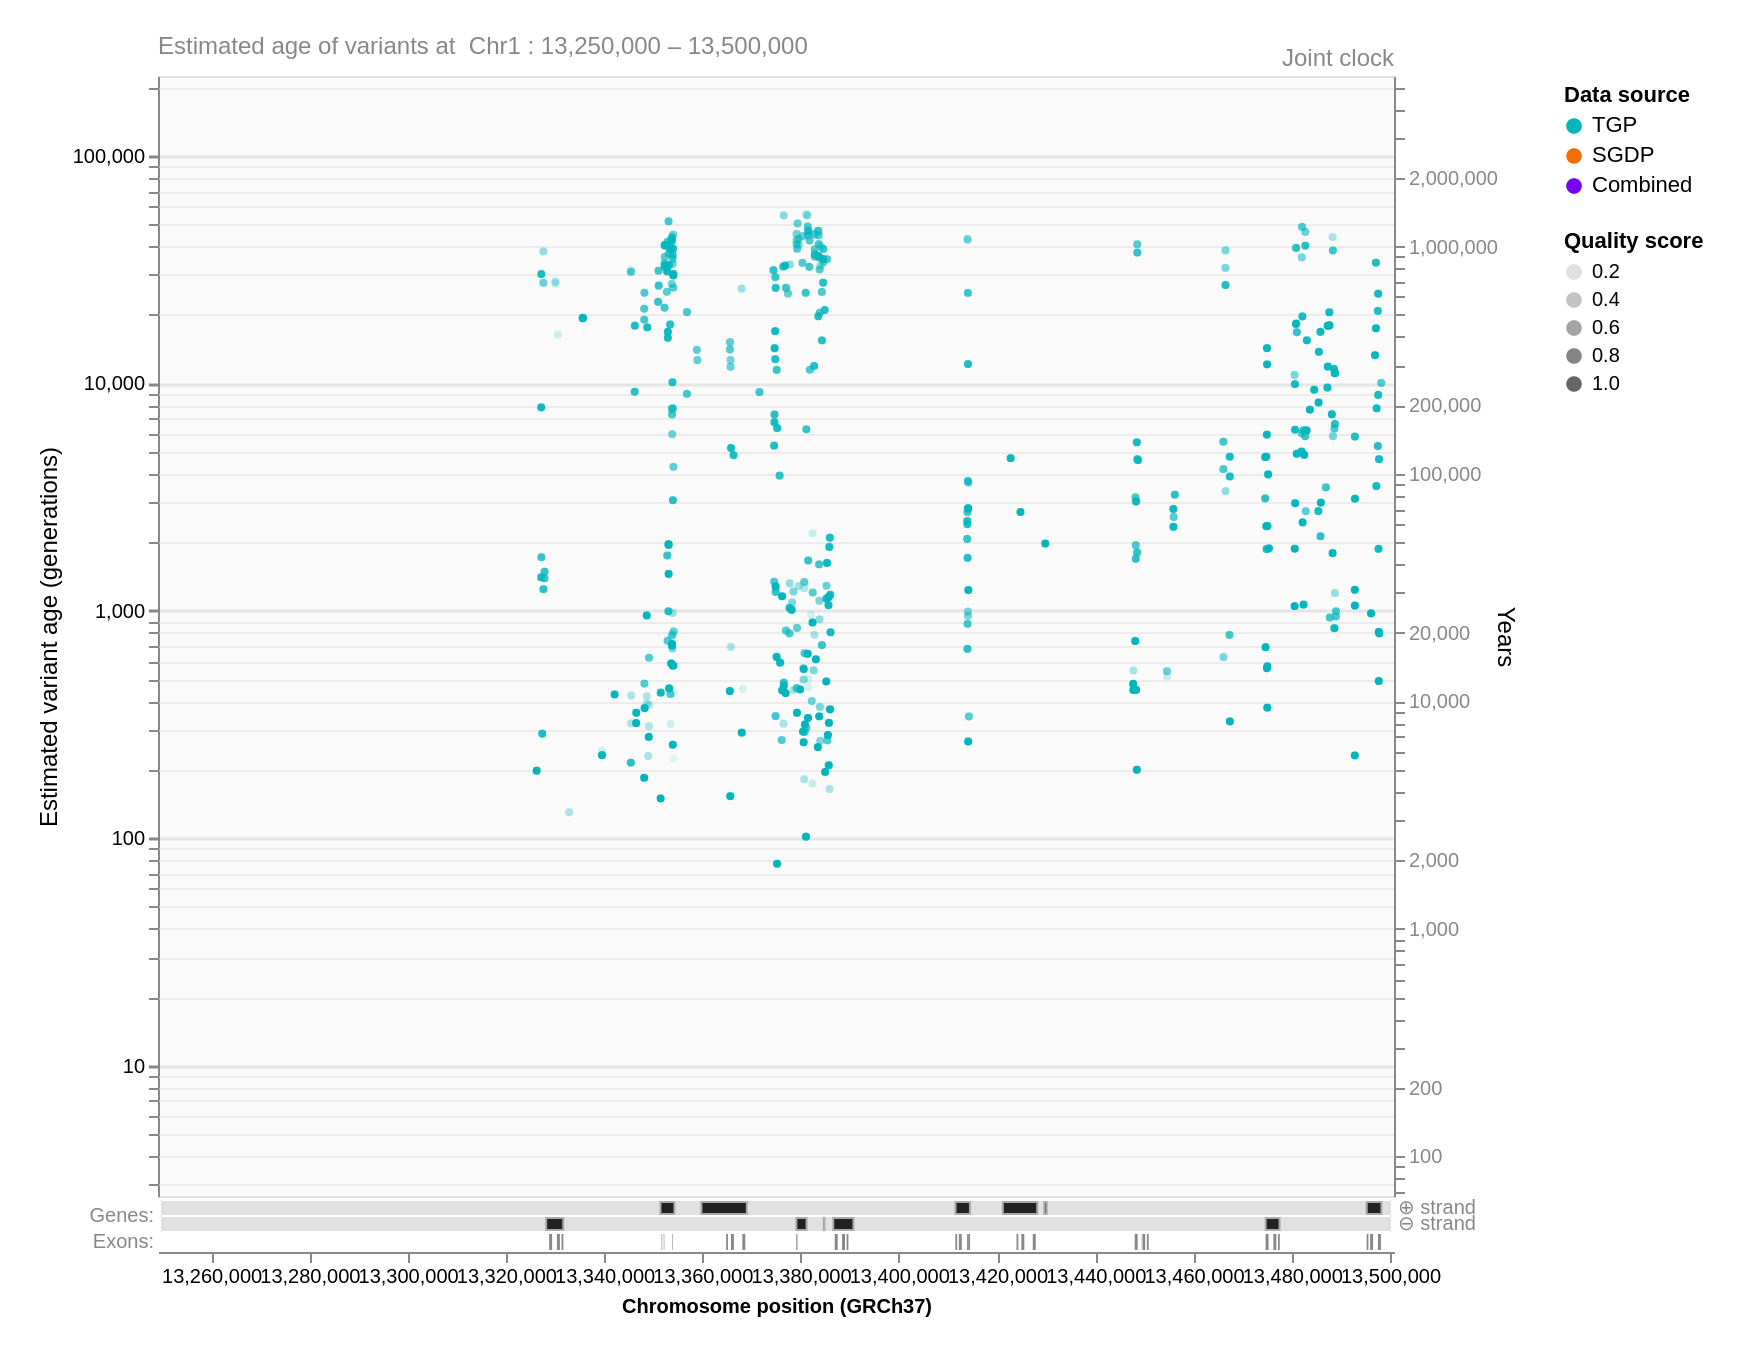
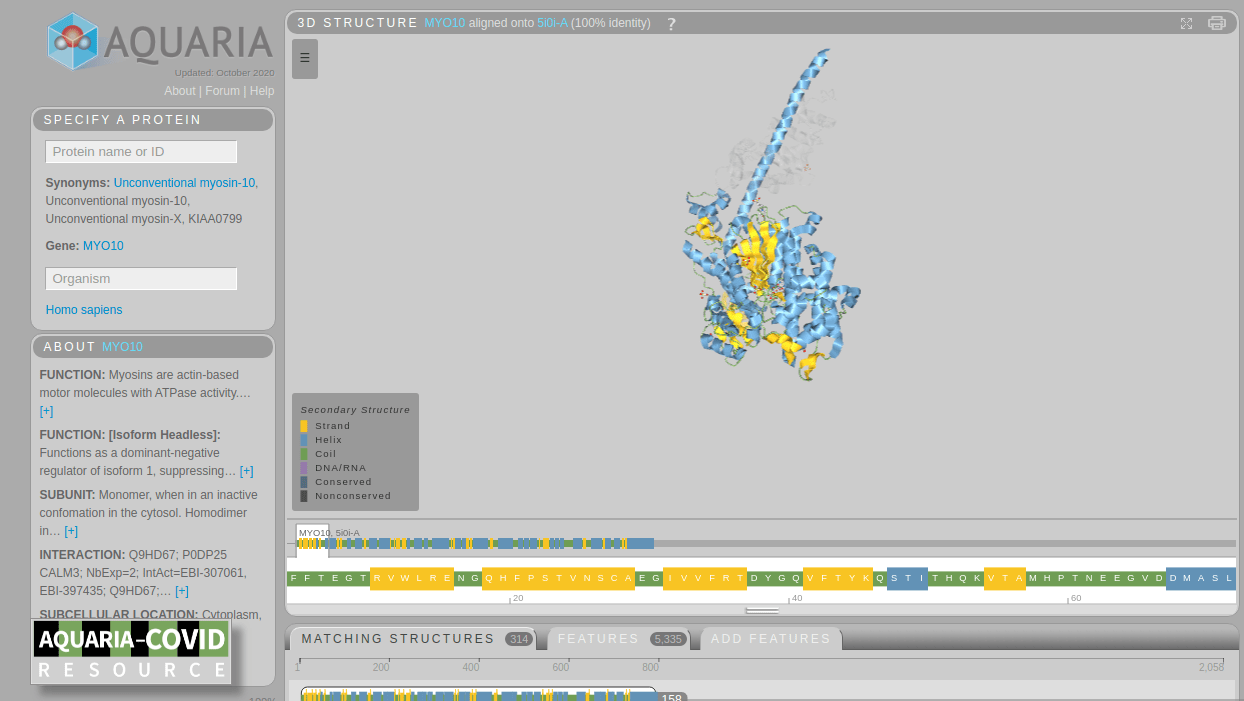
- Aquaria (img)
- drawProteins (img)
- Genomics 2 Proteins Portal (img)
- IBS (Illustrator for Biological Sequences) (img)
- Lollipops (img)
- Mason (img)
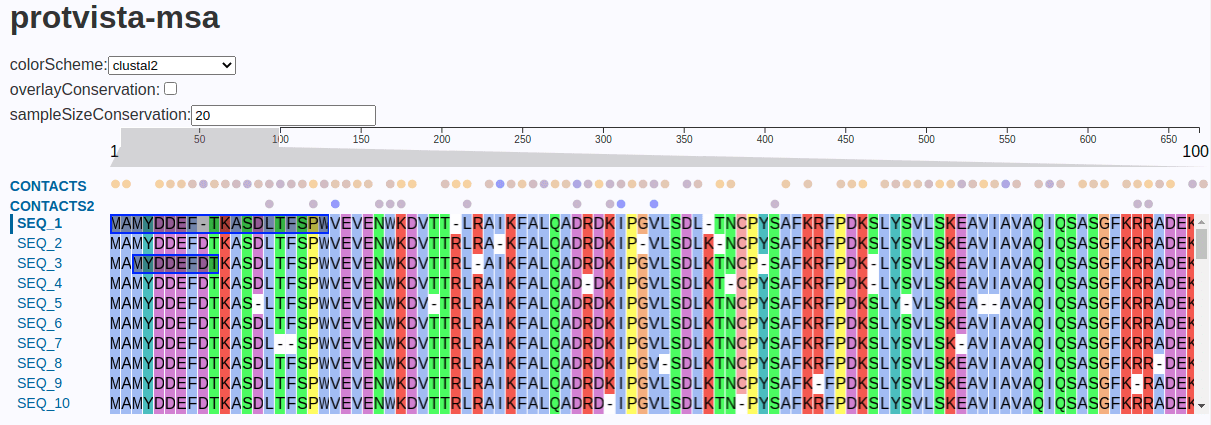
- nightingale protvista (Used on InterProScan website https://www.ebi.ac.uk/interpro/) (img)
- PFAM generate_graphic (Also see guide here https://pfam.xfam.org/help#tabview=tab10) (img)
- Prosite MyDomains (img)
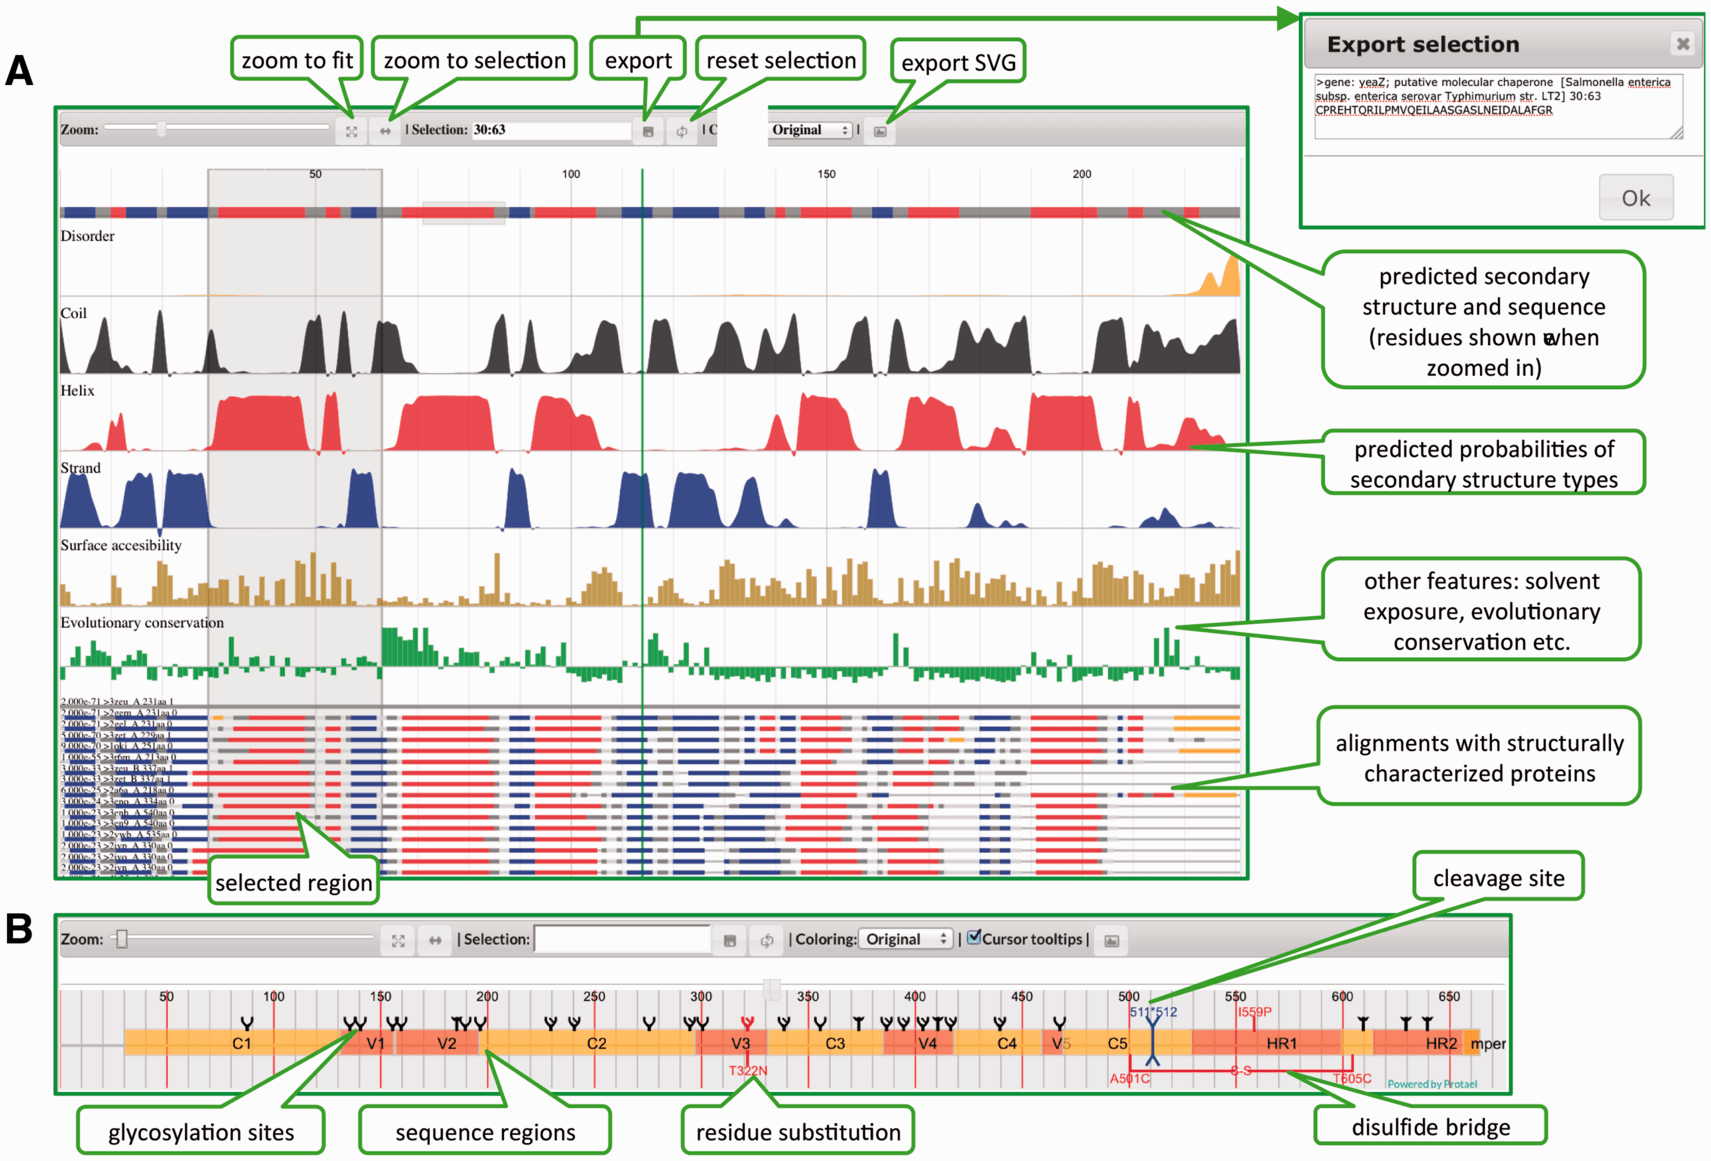
- Protael (img)
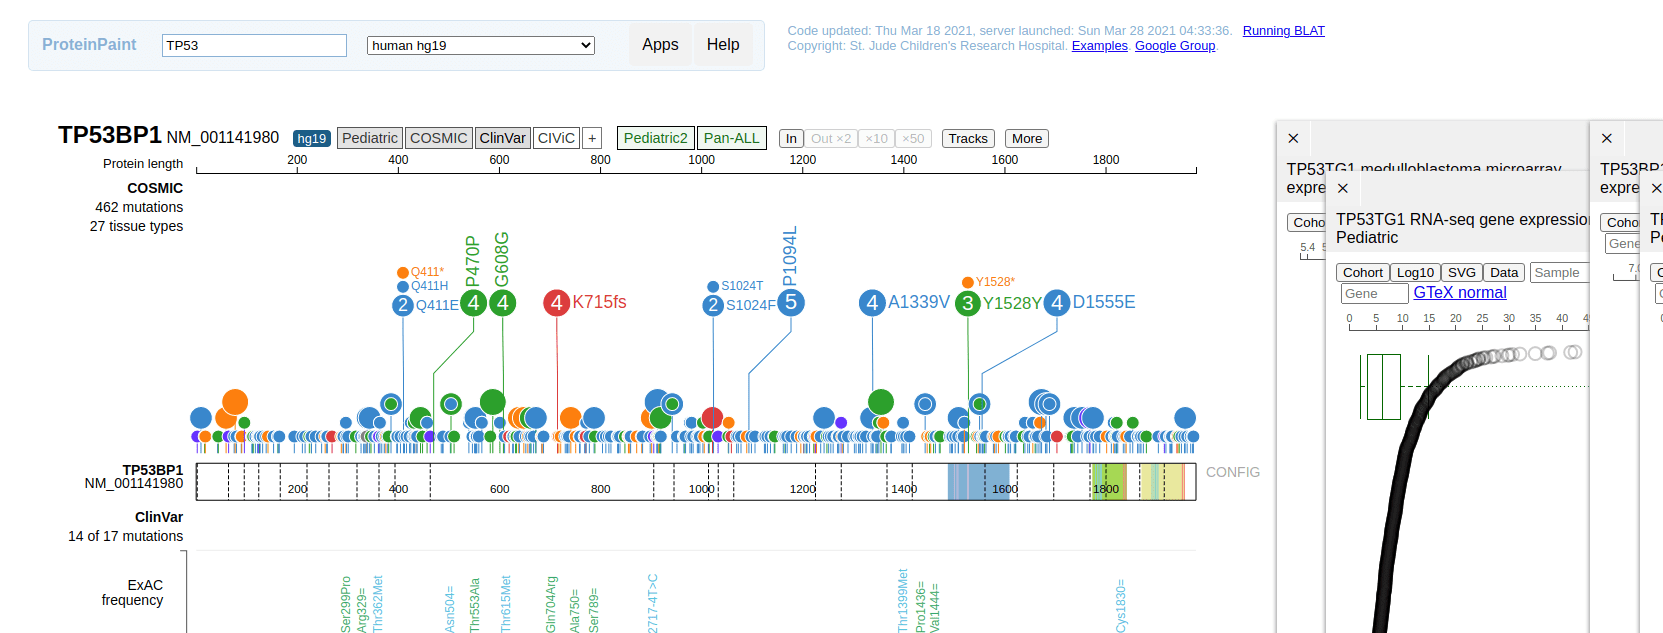
- ProteinPaint (img)
- pViz (img)
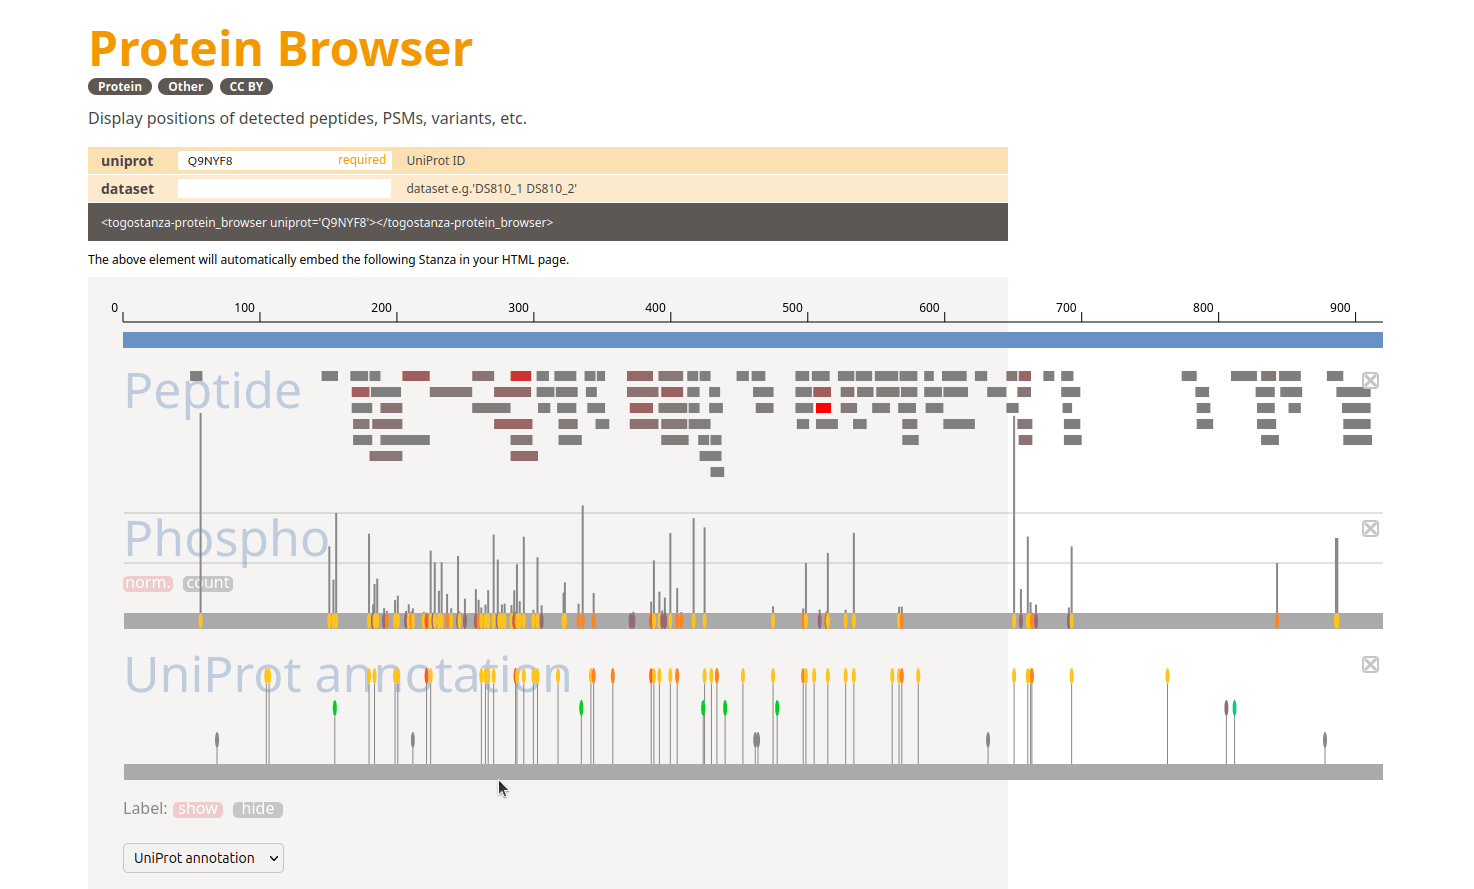
- TogoStanza Protein Browser (img)
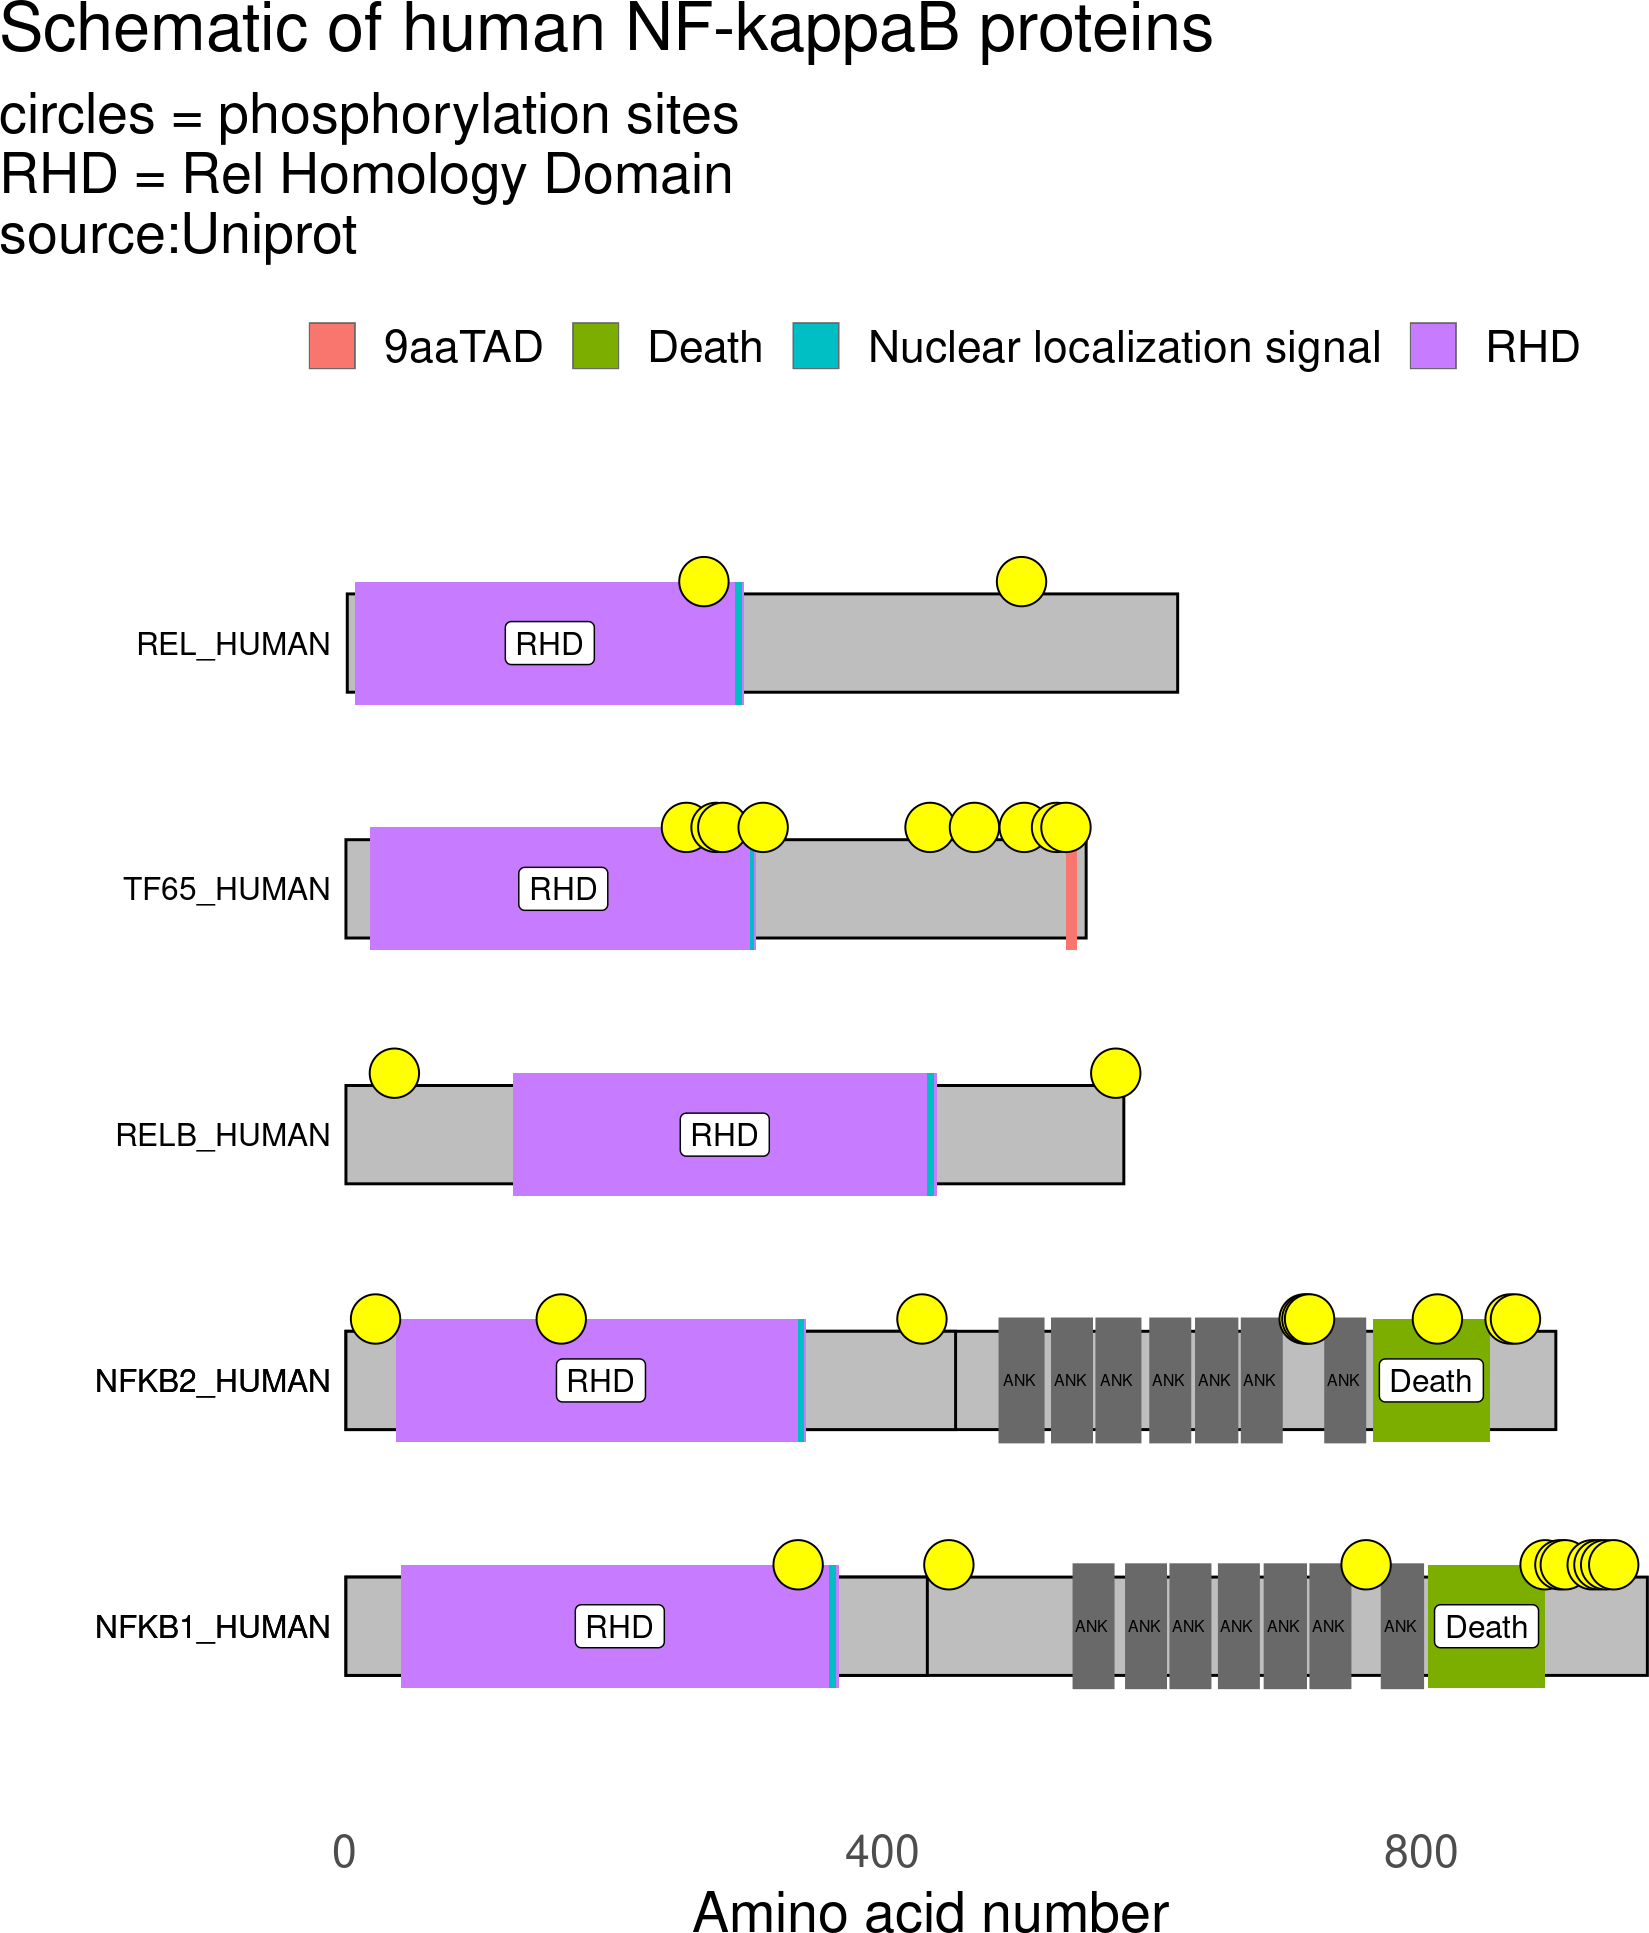
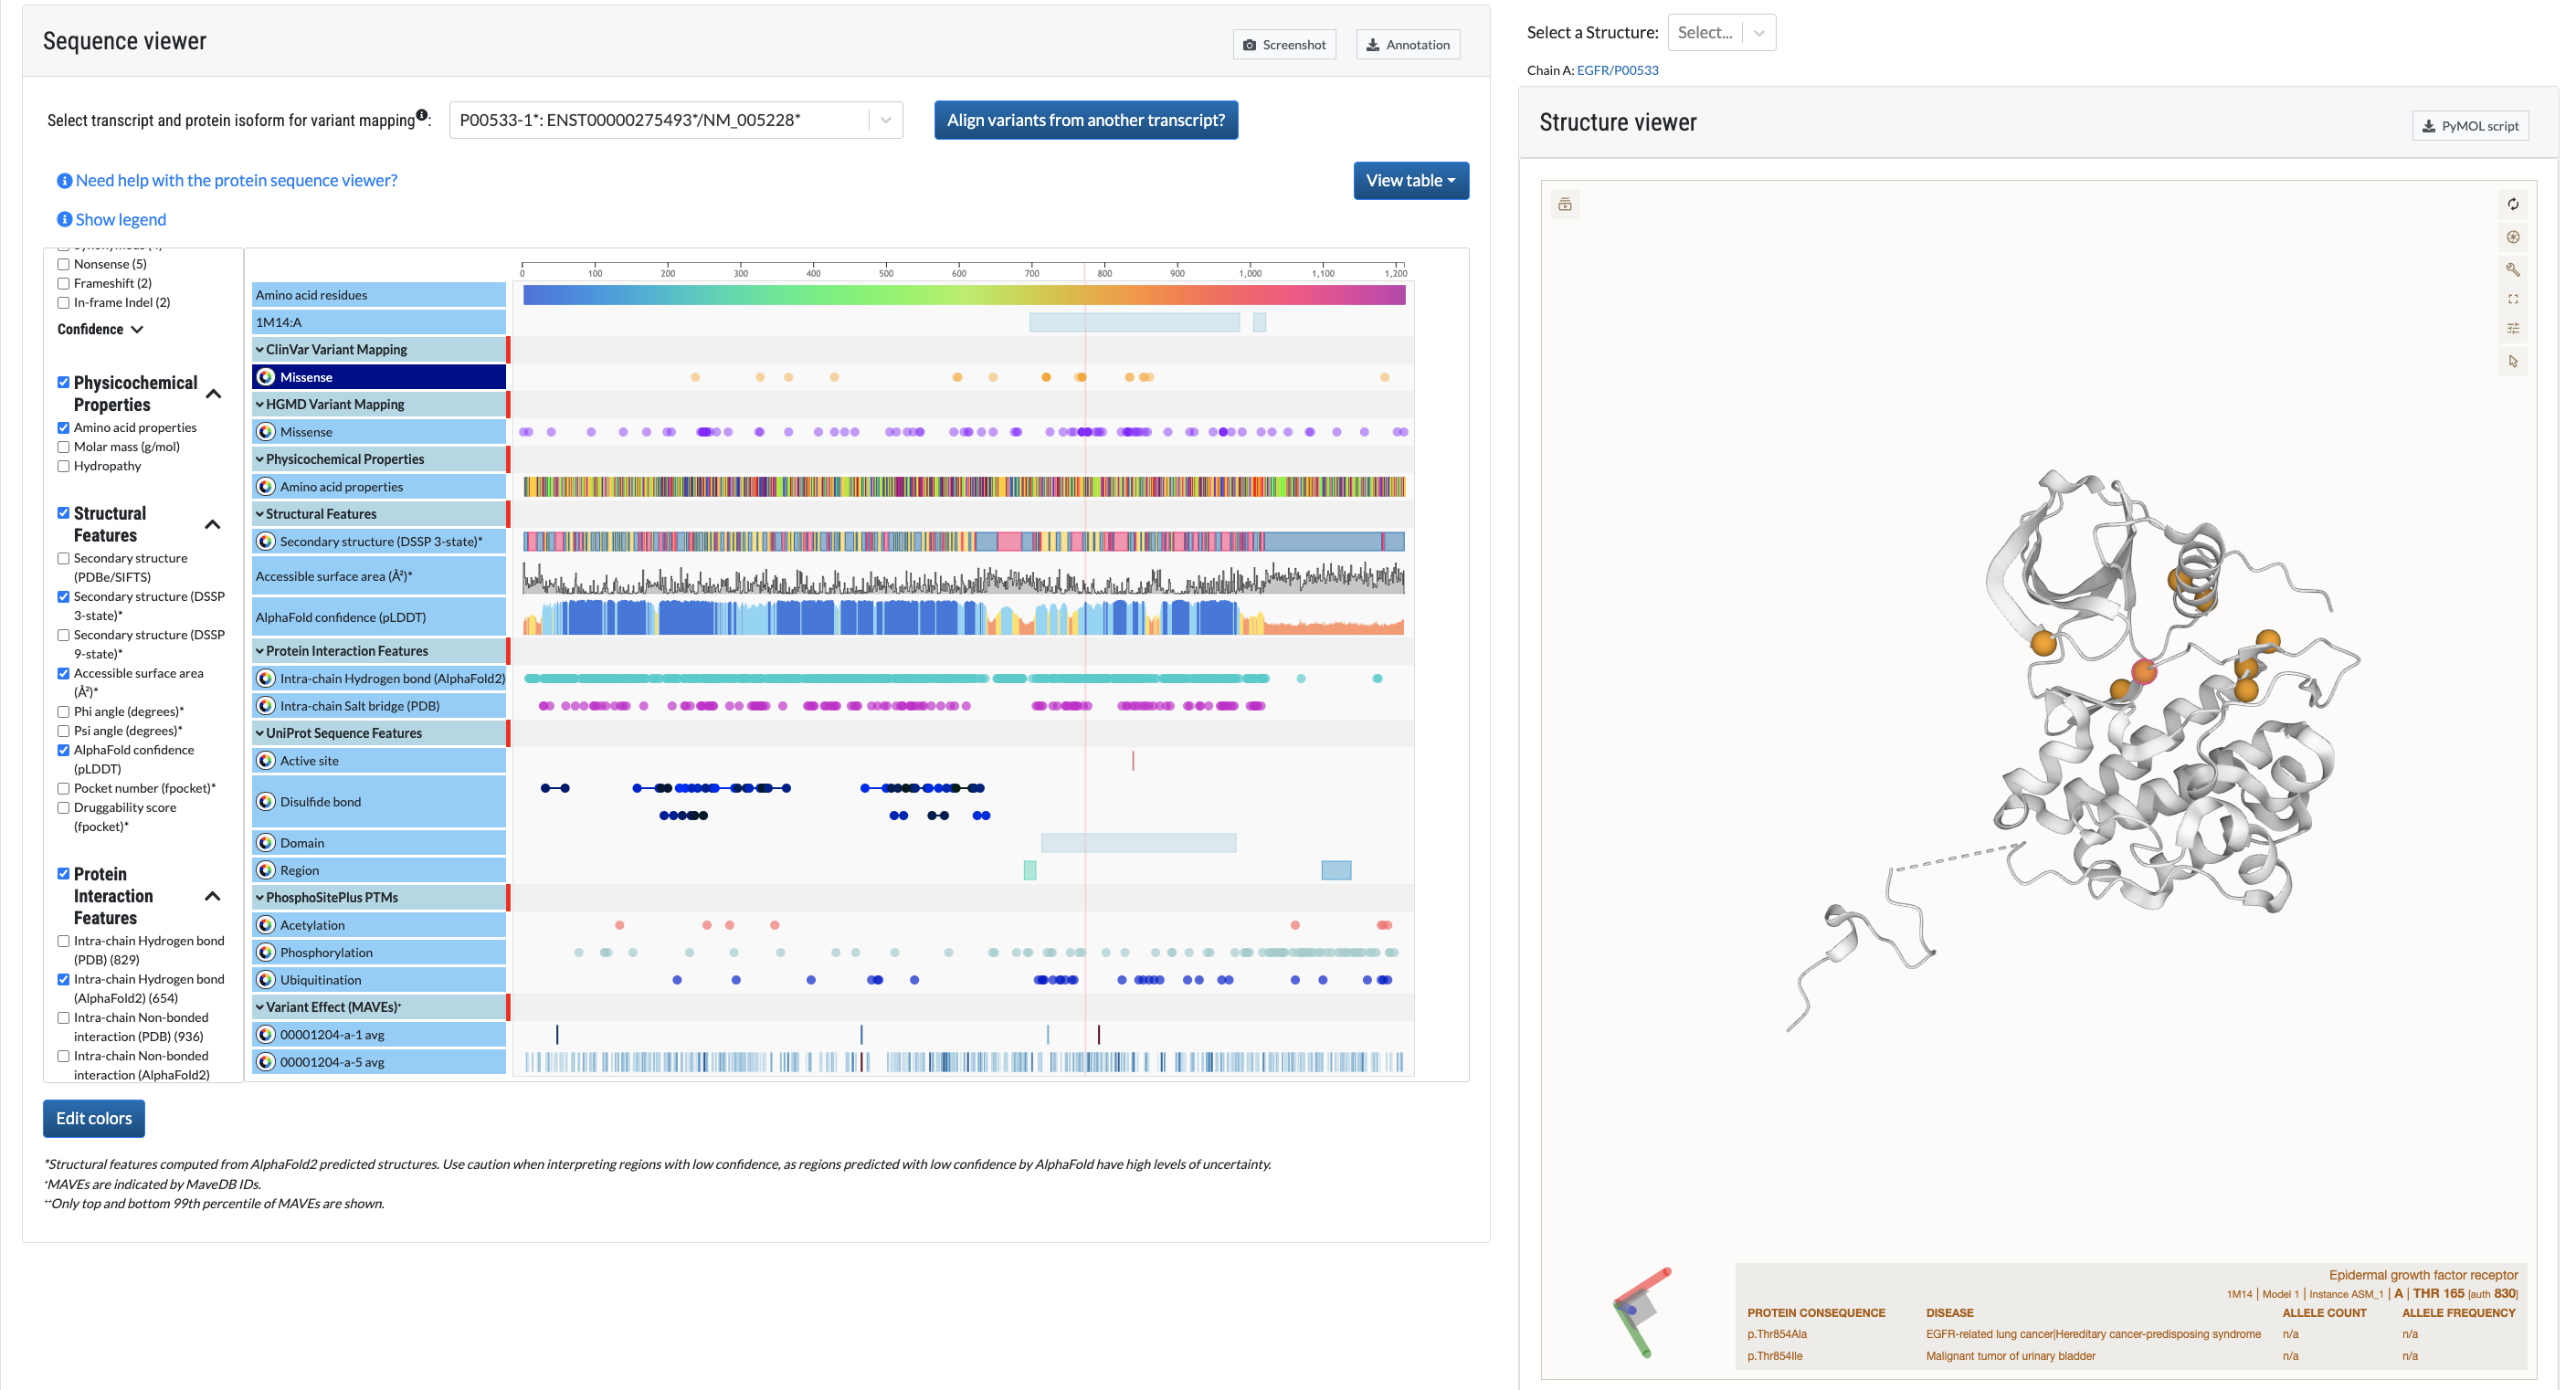
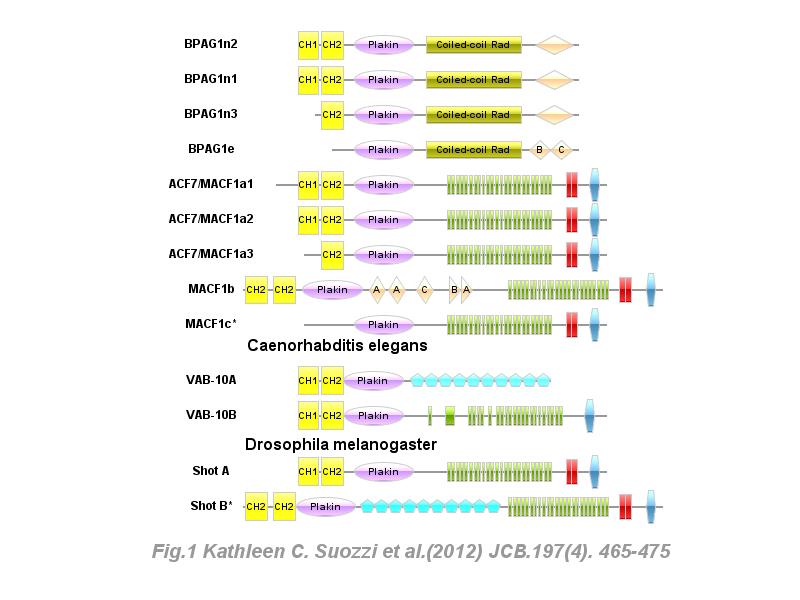

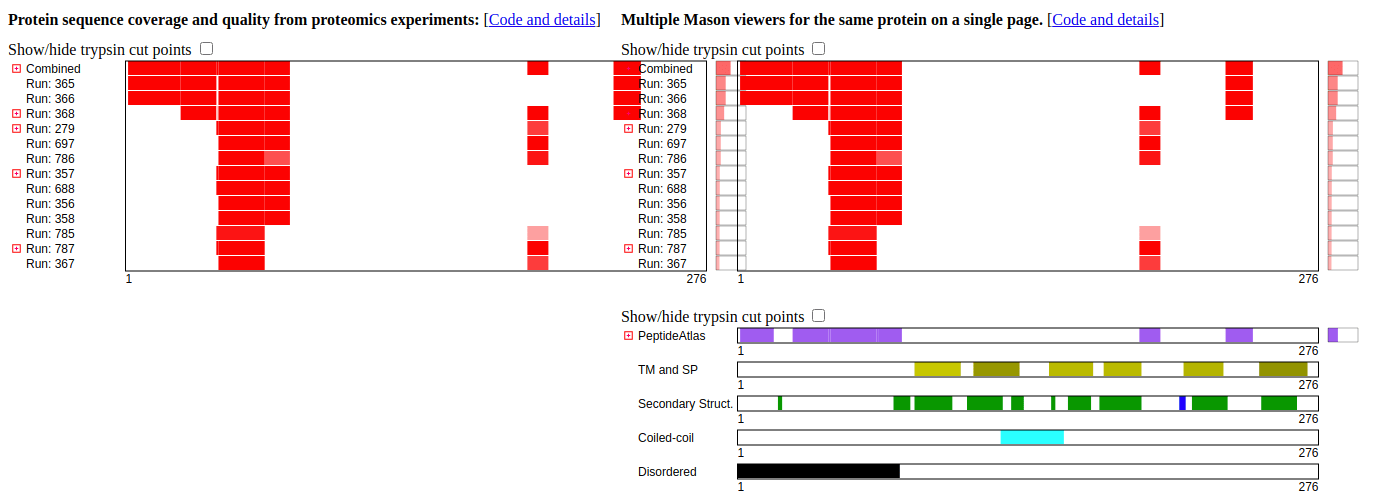


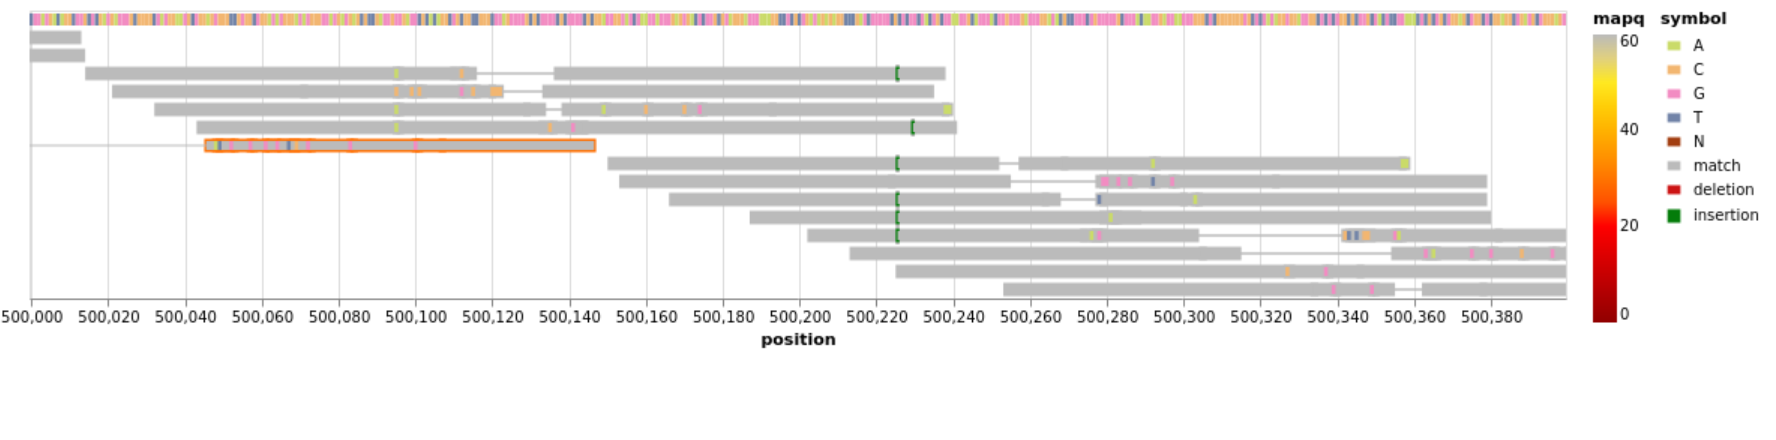
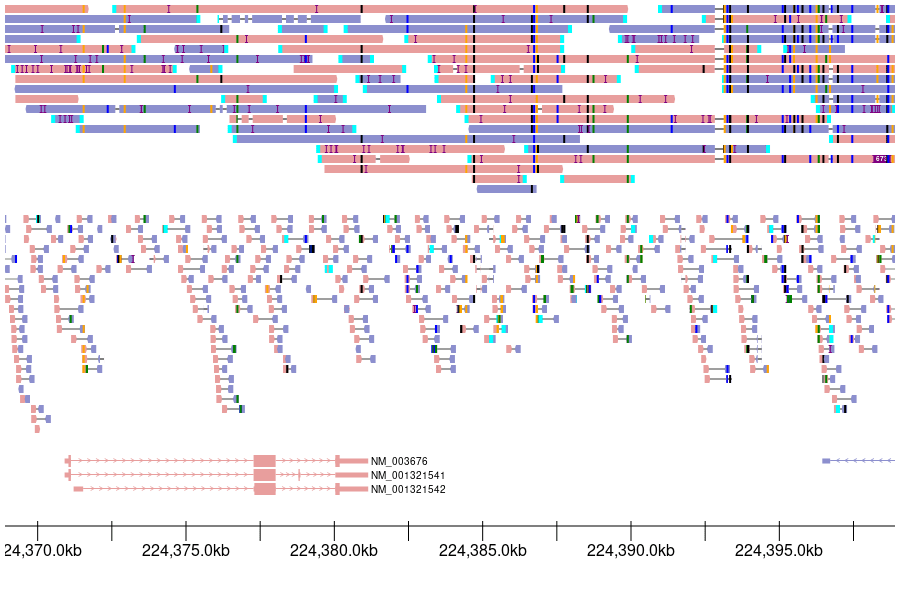
- alignoth (img)
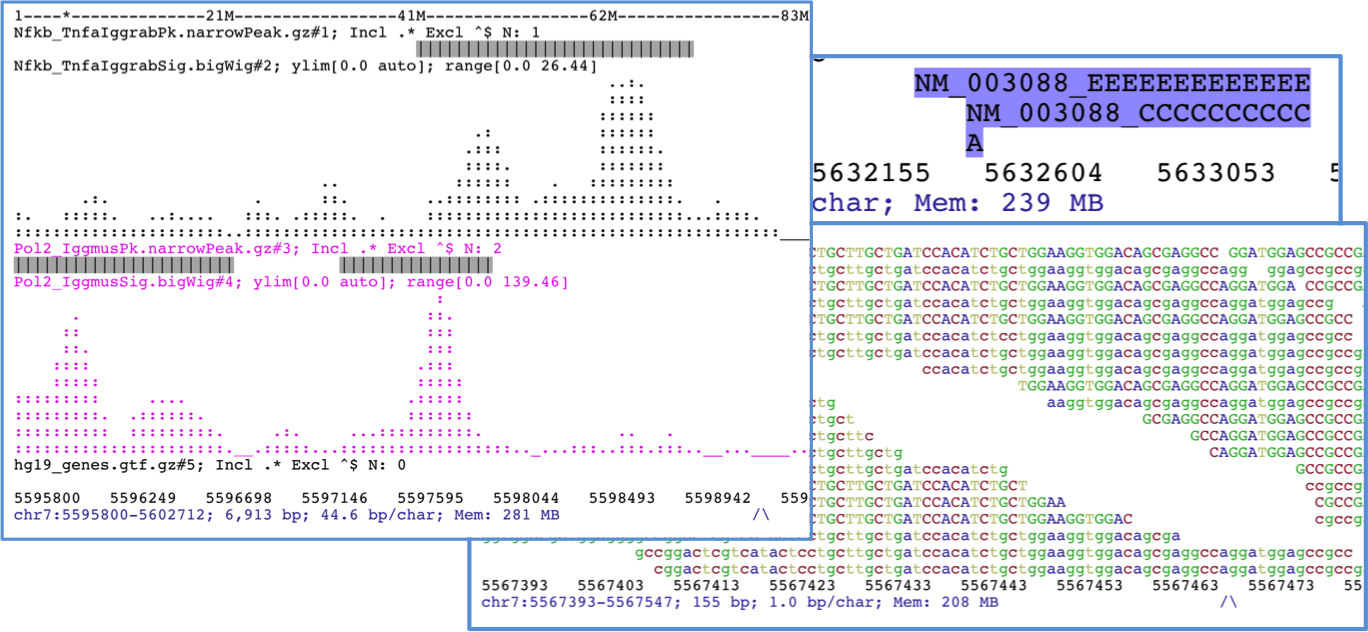
- ASCIIGenome (img)
- bamscope (img)
- BAMSnap (img)
- Chromatic (img)
- DrukBam (img)
- Gambit (img)
- GenomeView (java app) (img)
- GSSPlayground (img)
- Gviz (img)
- gw (img)
- Hapviz (img)
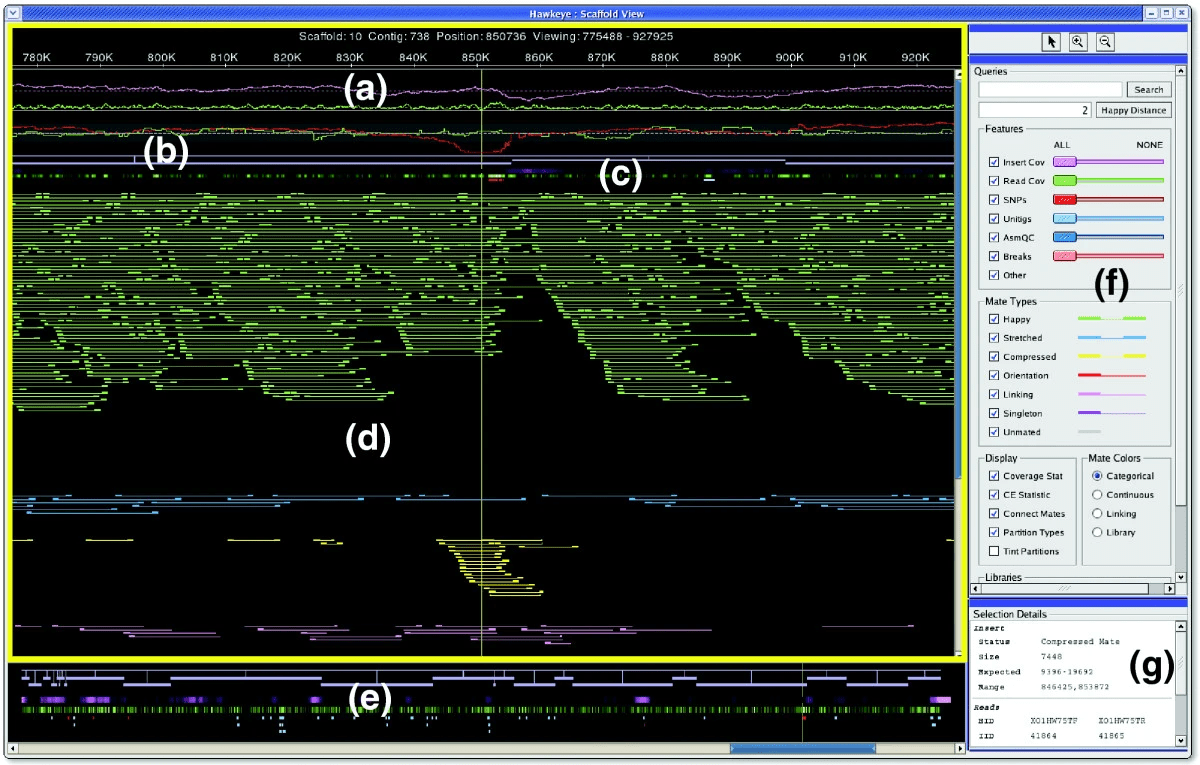
- Hawkeye (img)
- iGenomics (img)
- JVarKit BamToSVG (img)
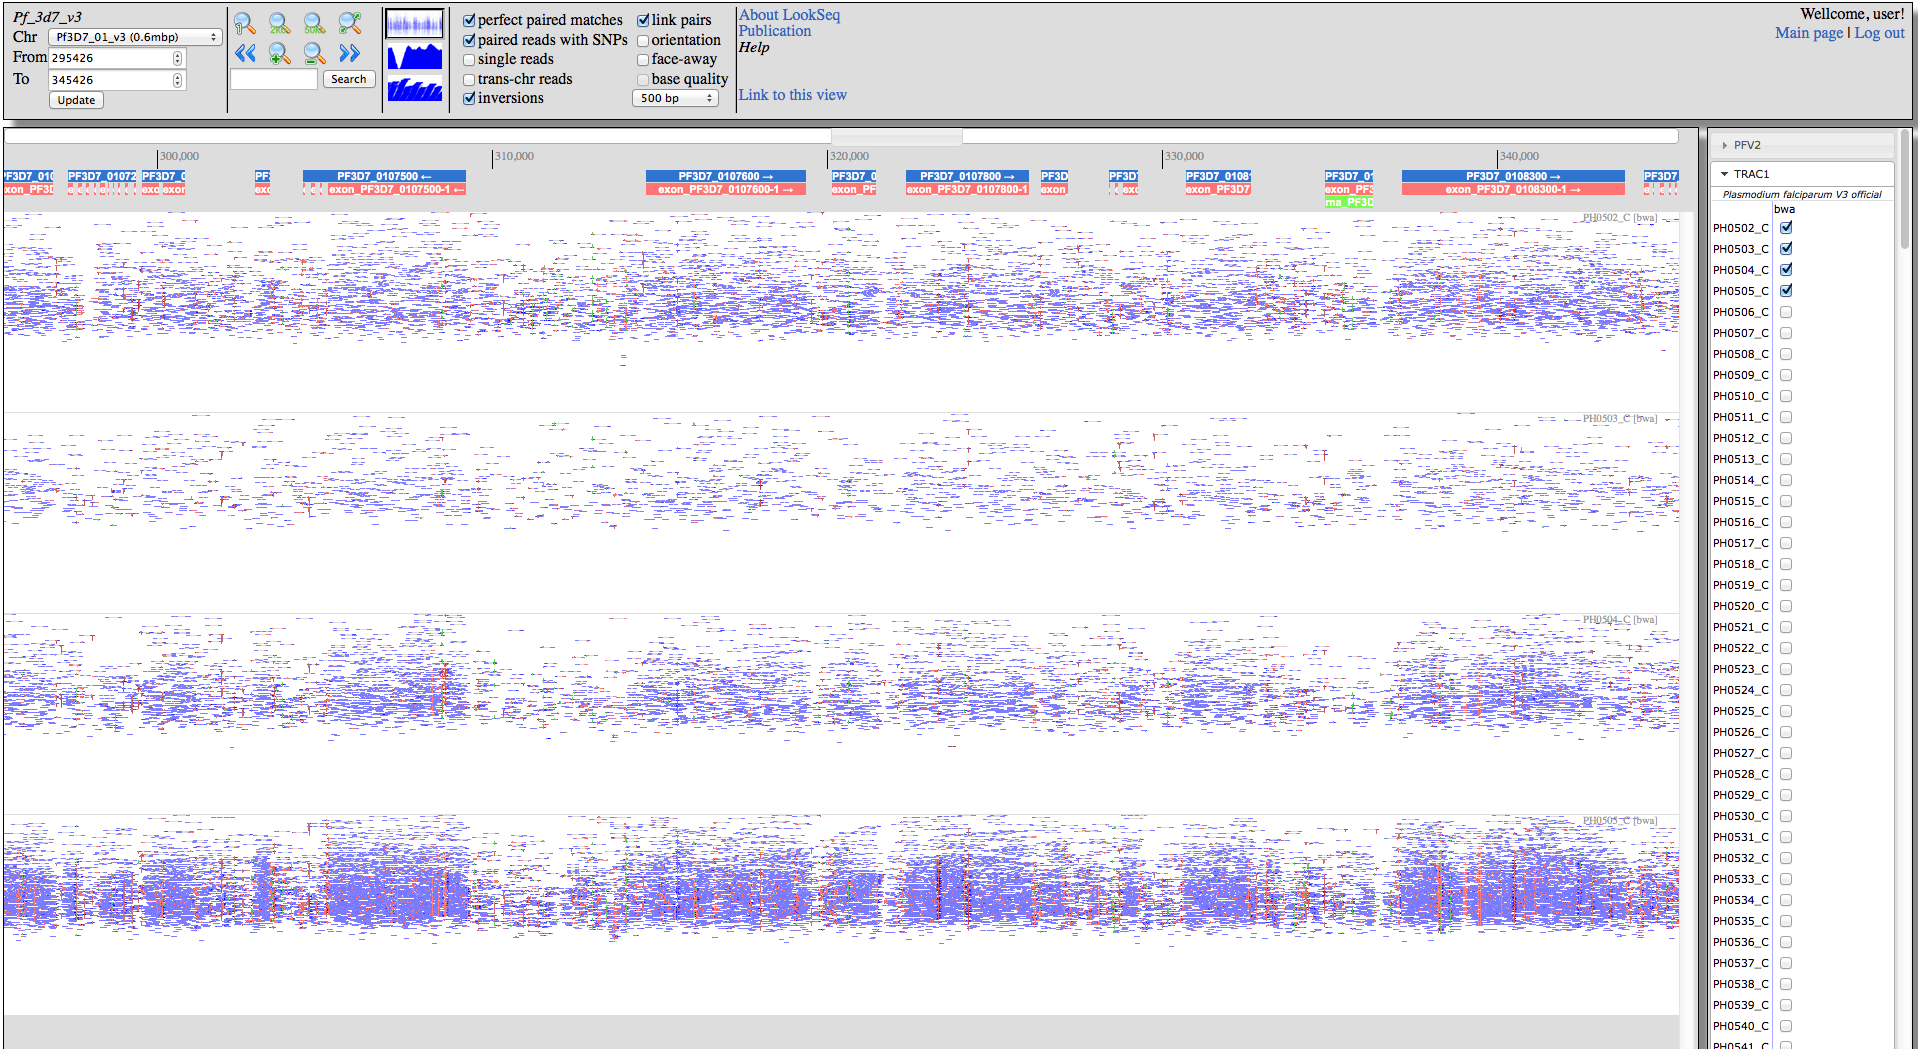
- LookSeq (img)
- Lucid viewer (img)
- MagicViewer (img)
- MapView (URL is a direct link to zip file download on archive.org) (img)
- NGB (img)
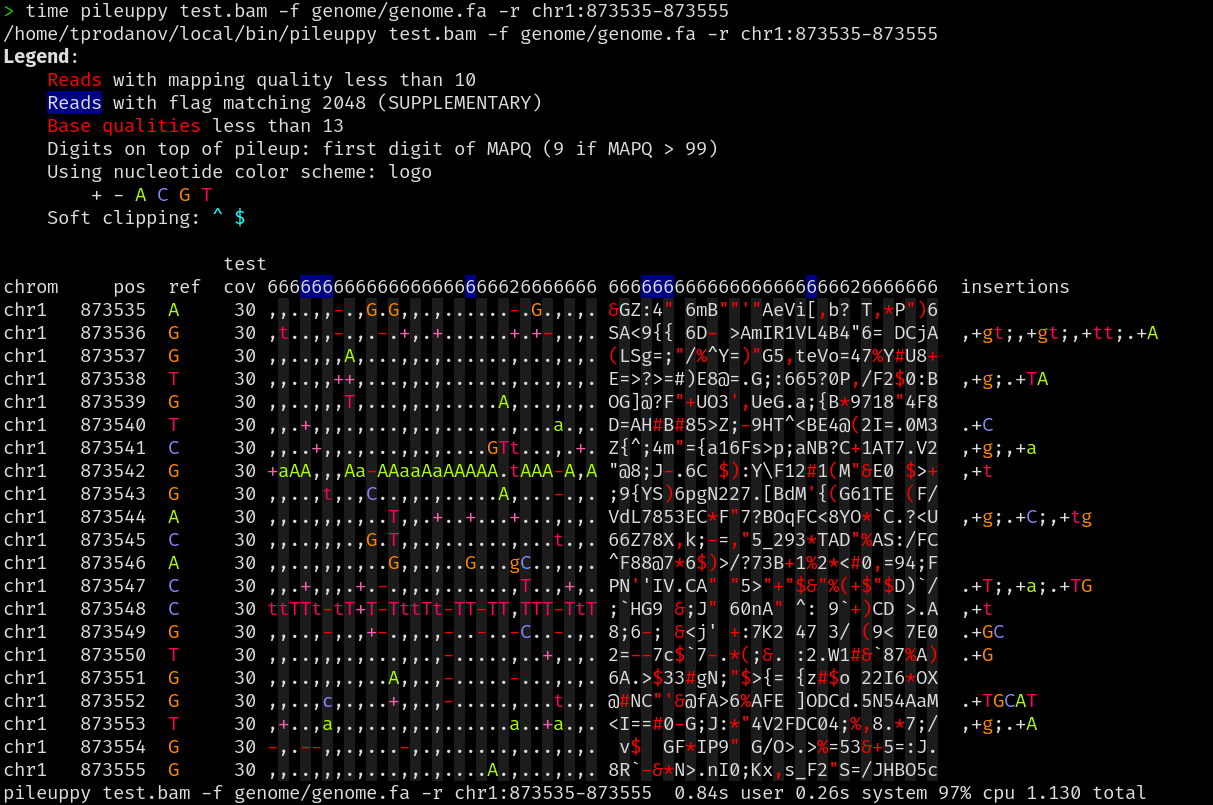
- pileuppy (img)
- plotReads (img)
- pyBamView (See supplementary info for more figures, supports padded SAM/BAM which is fairly rare) (img)
- Sam2pairwise
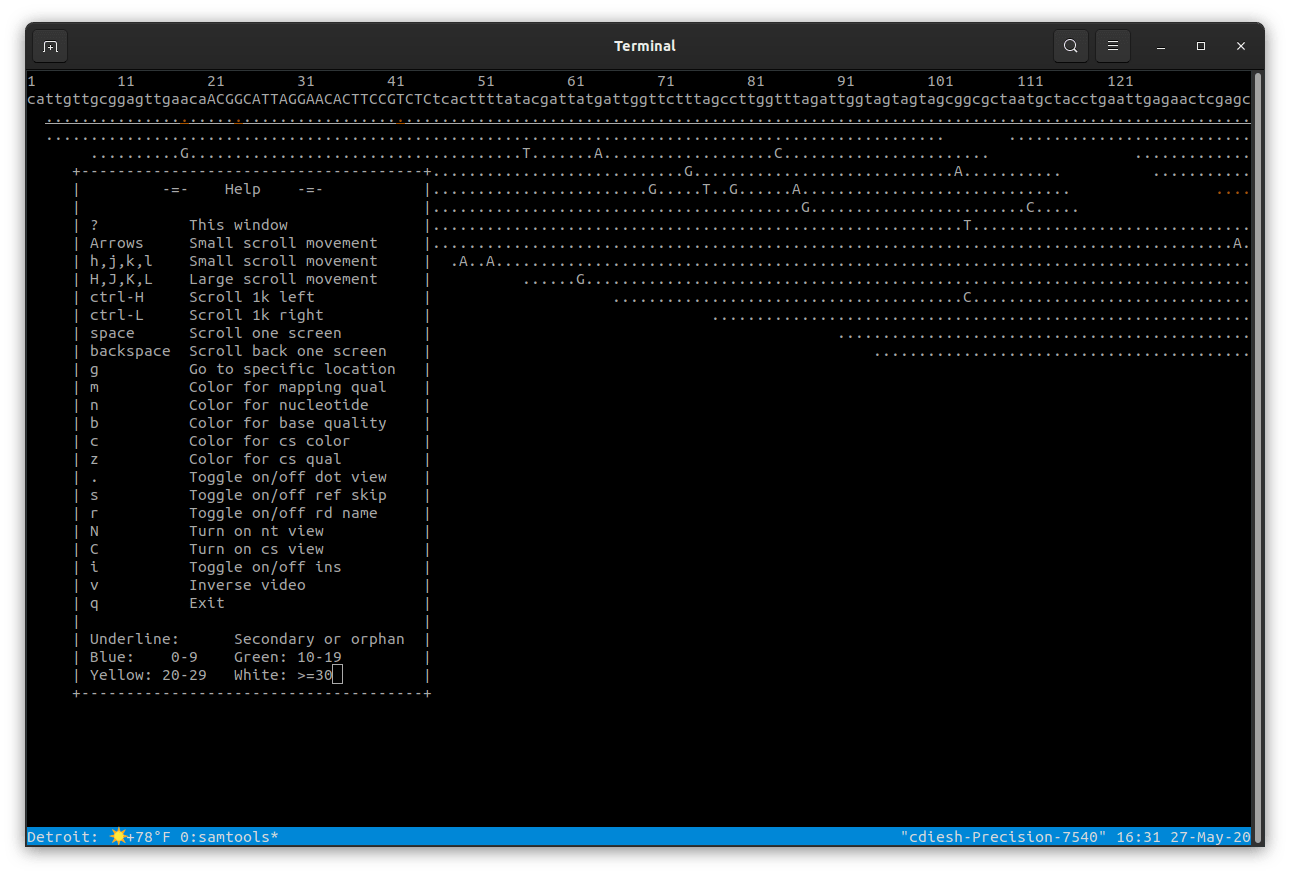
- Samtools tview (img)
- shabam (img)
- Staden (img)
- tgv (terminal genome viewer) (img)
- udon (Uses an advanced data structure for pileup, so visually a basic example but likely just a small demo) (img)
- VizAln (from HipSTR) (img)
- wally (Available via the web from compiling to wasm) (img)
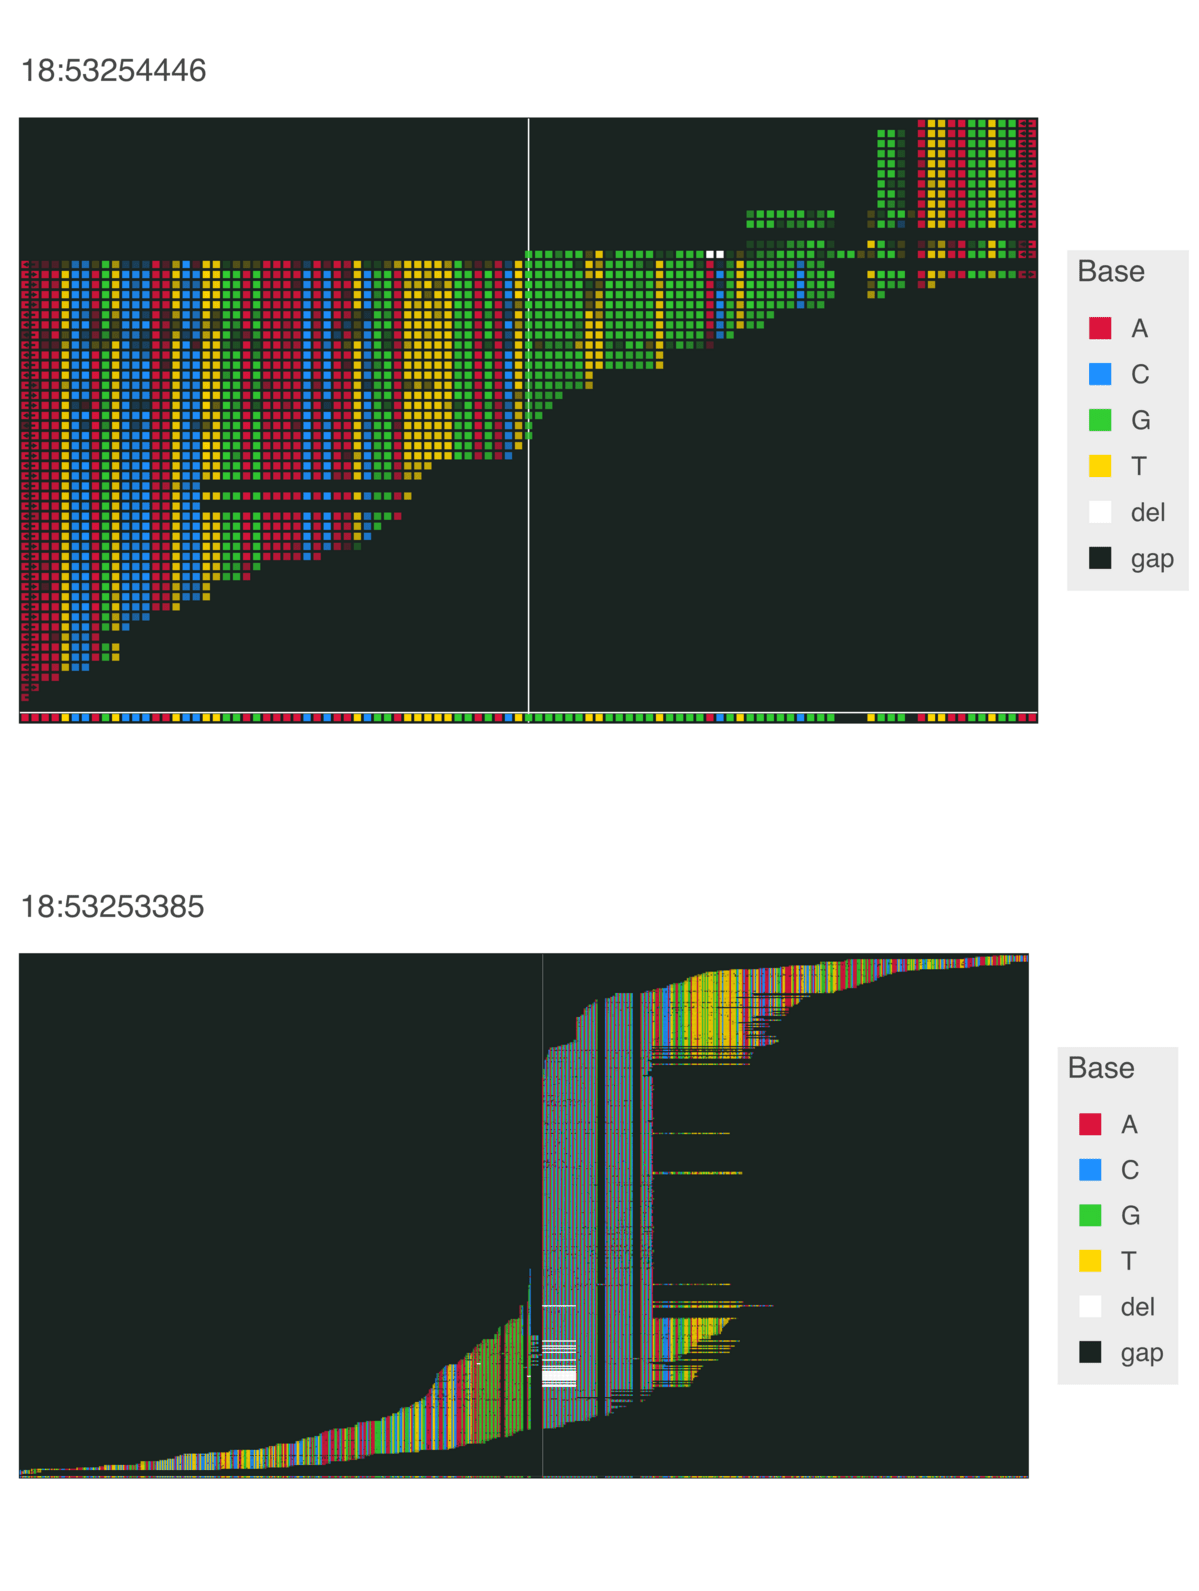
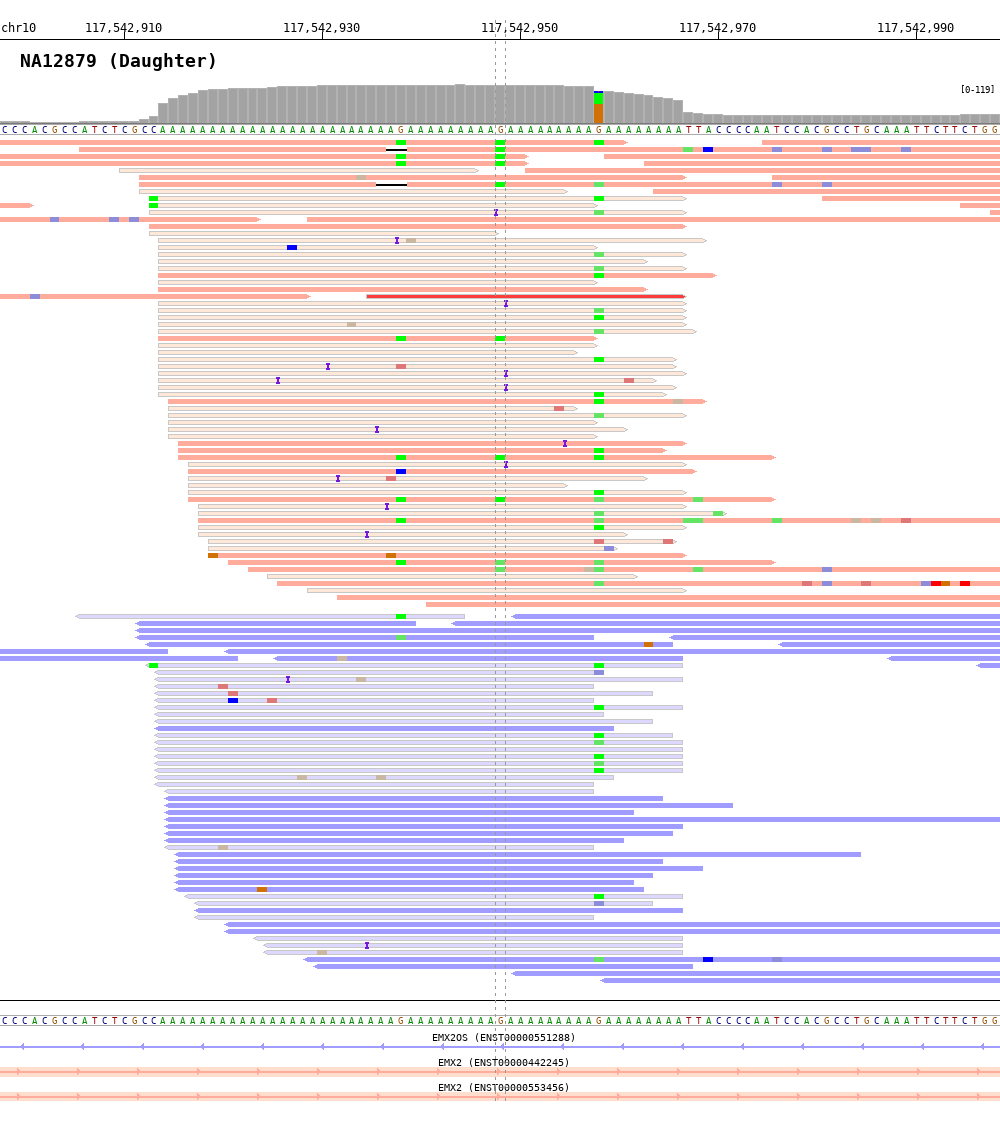
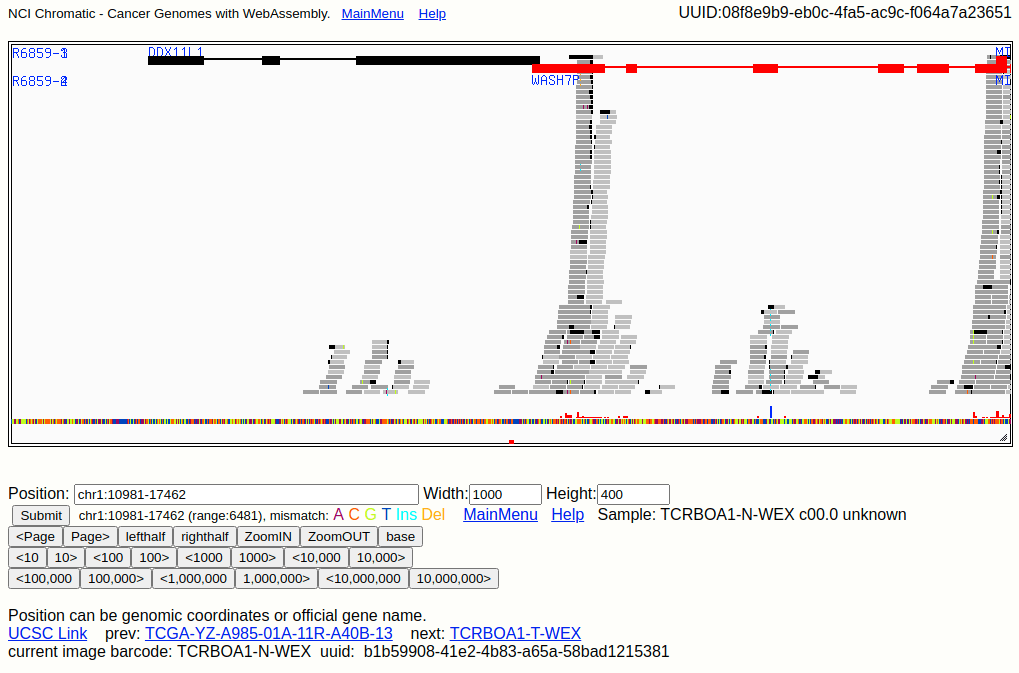
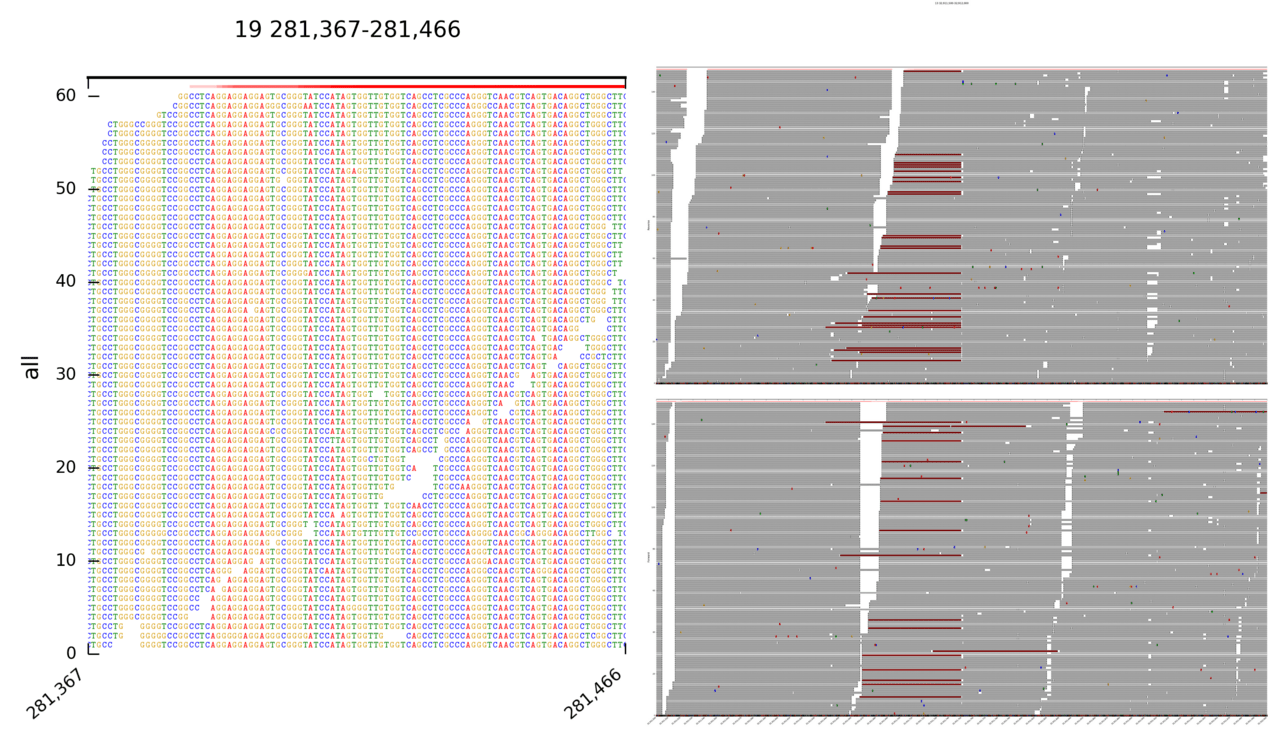

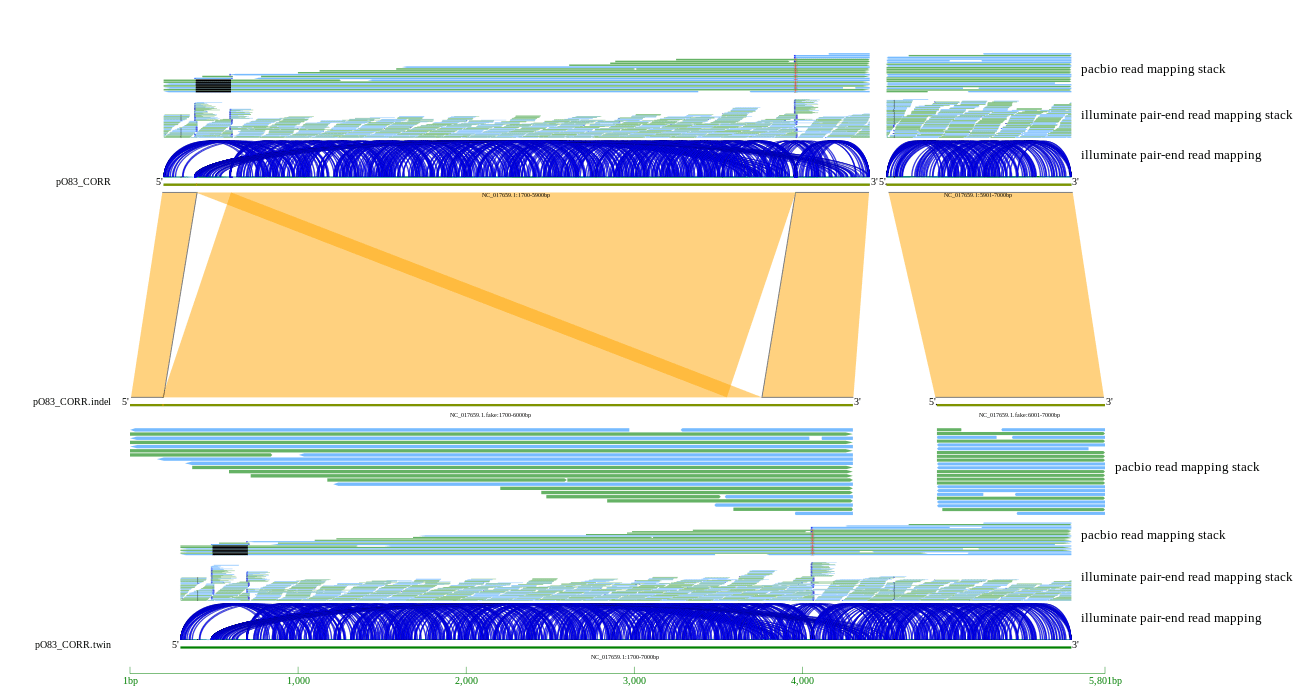
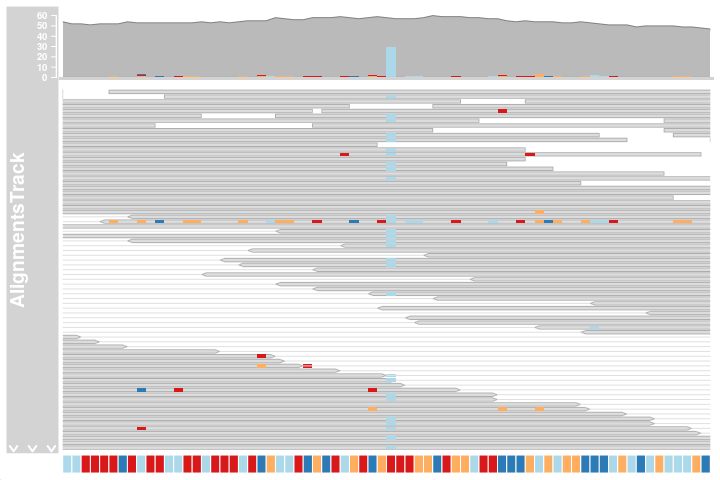
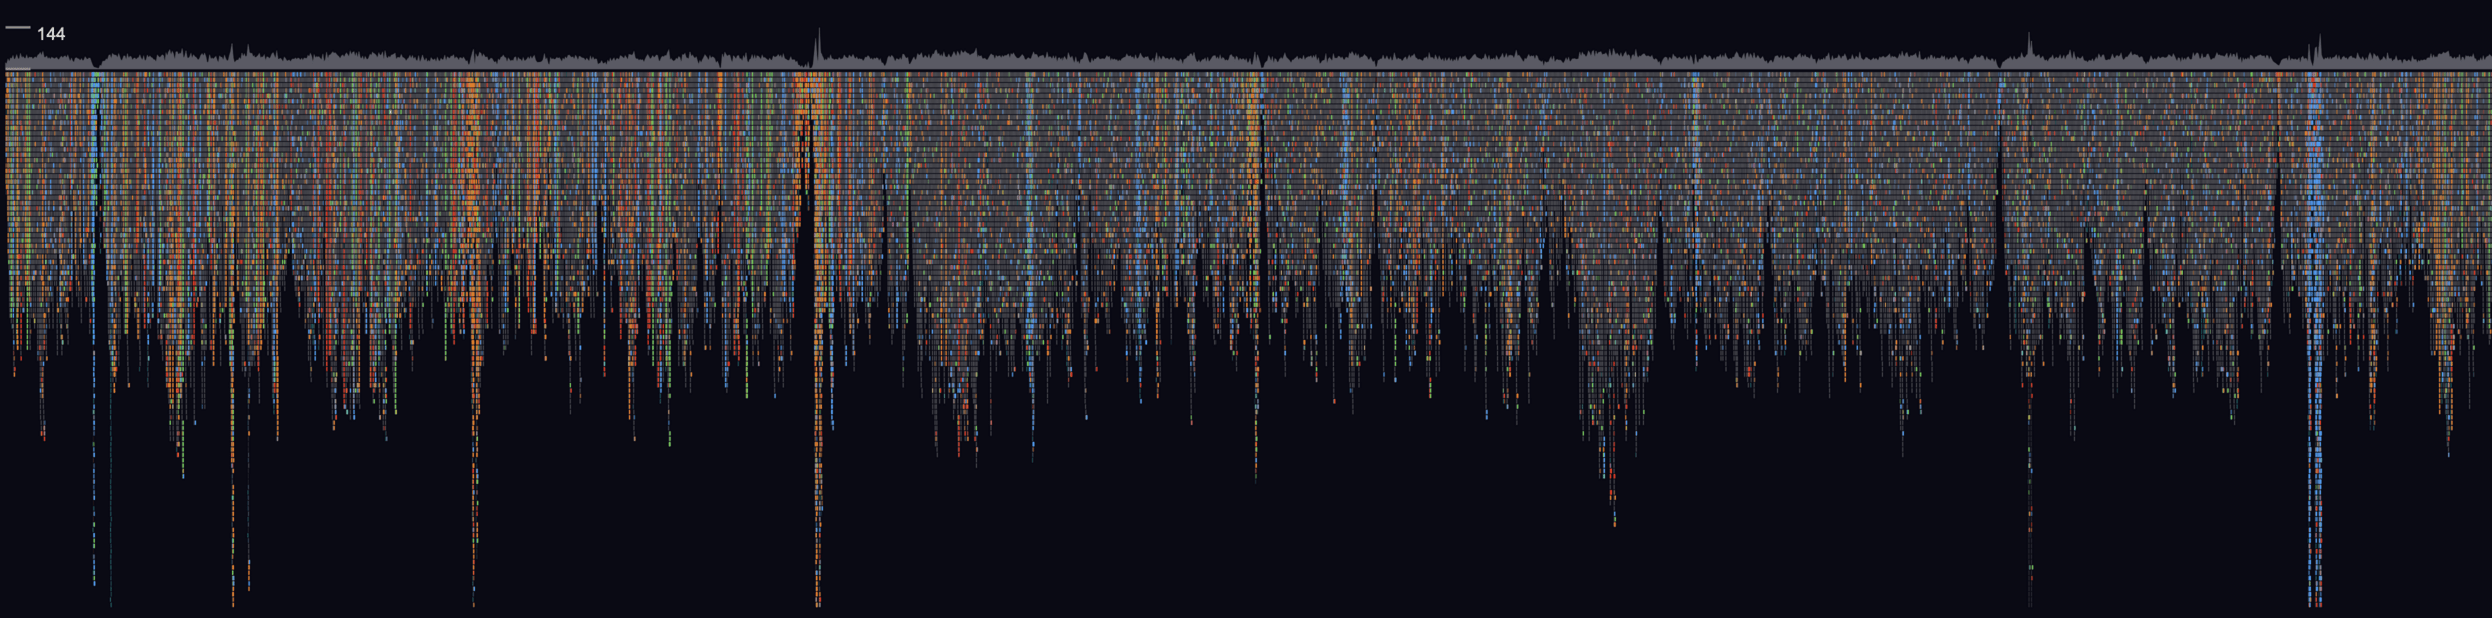
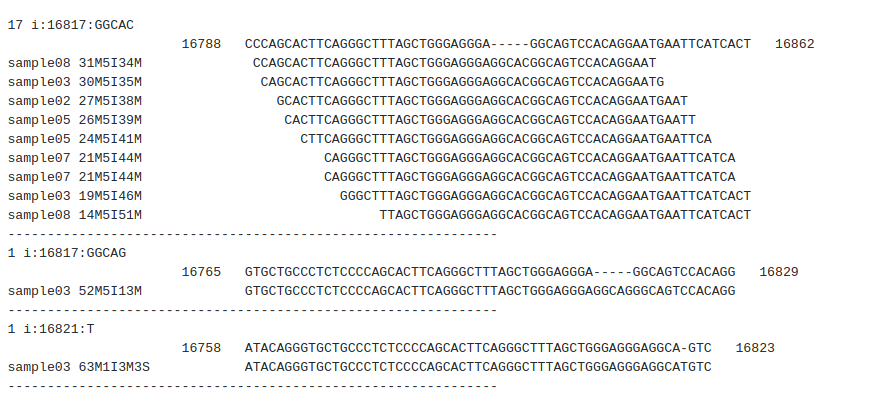
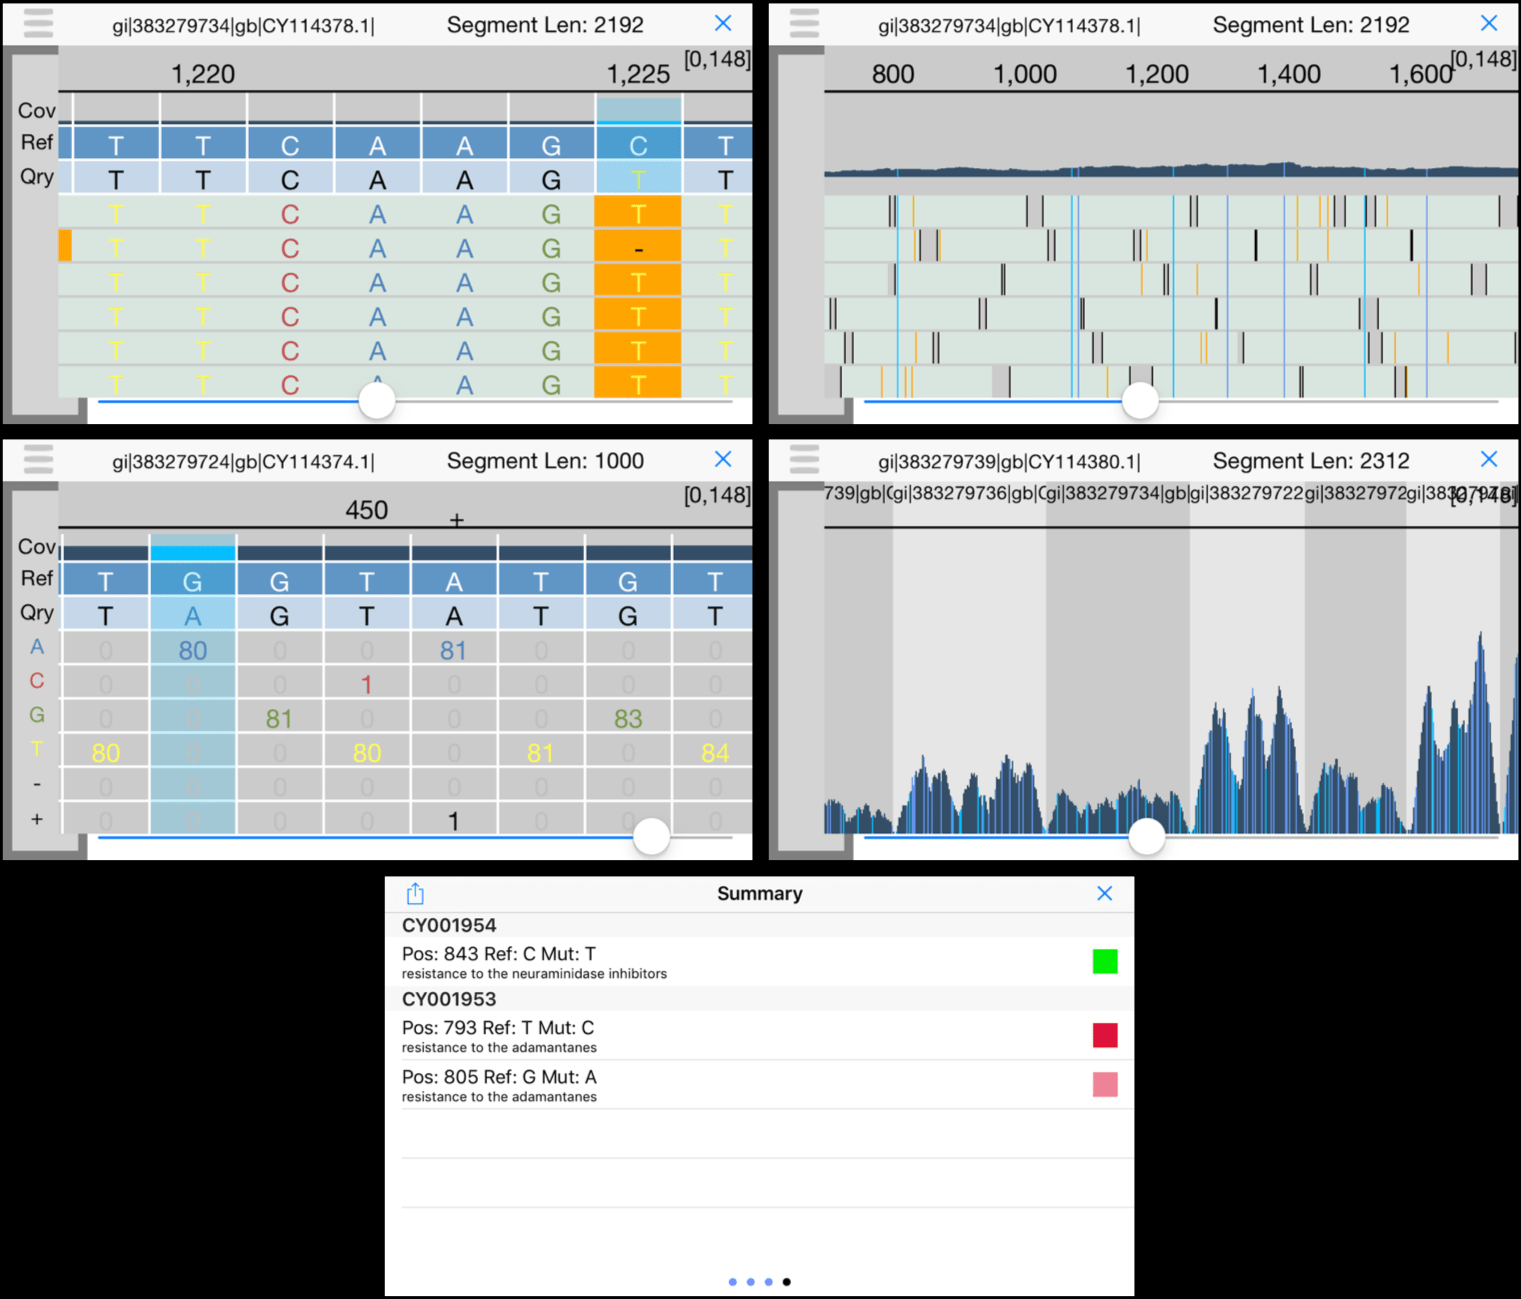
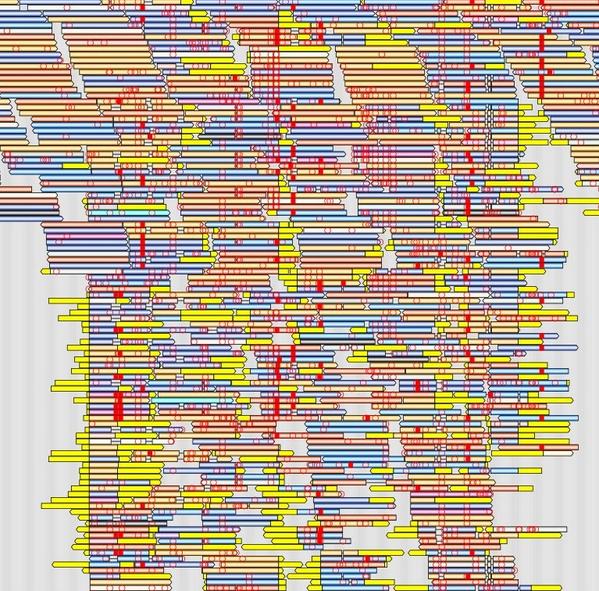
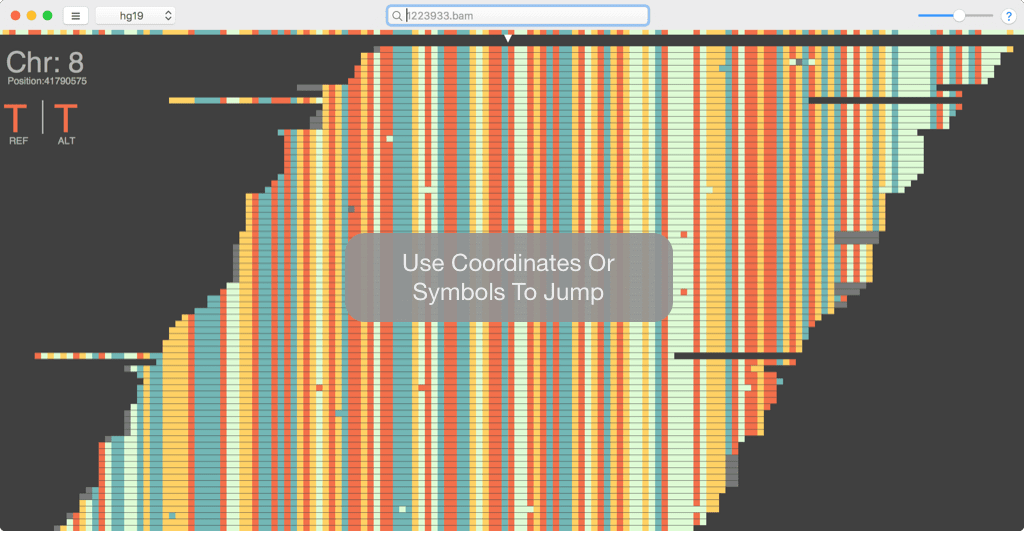
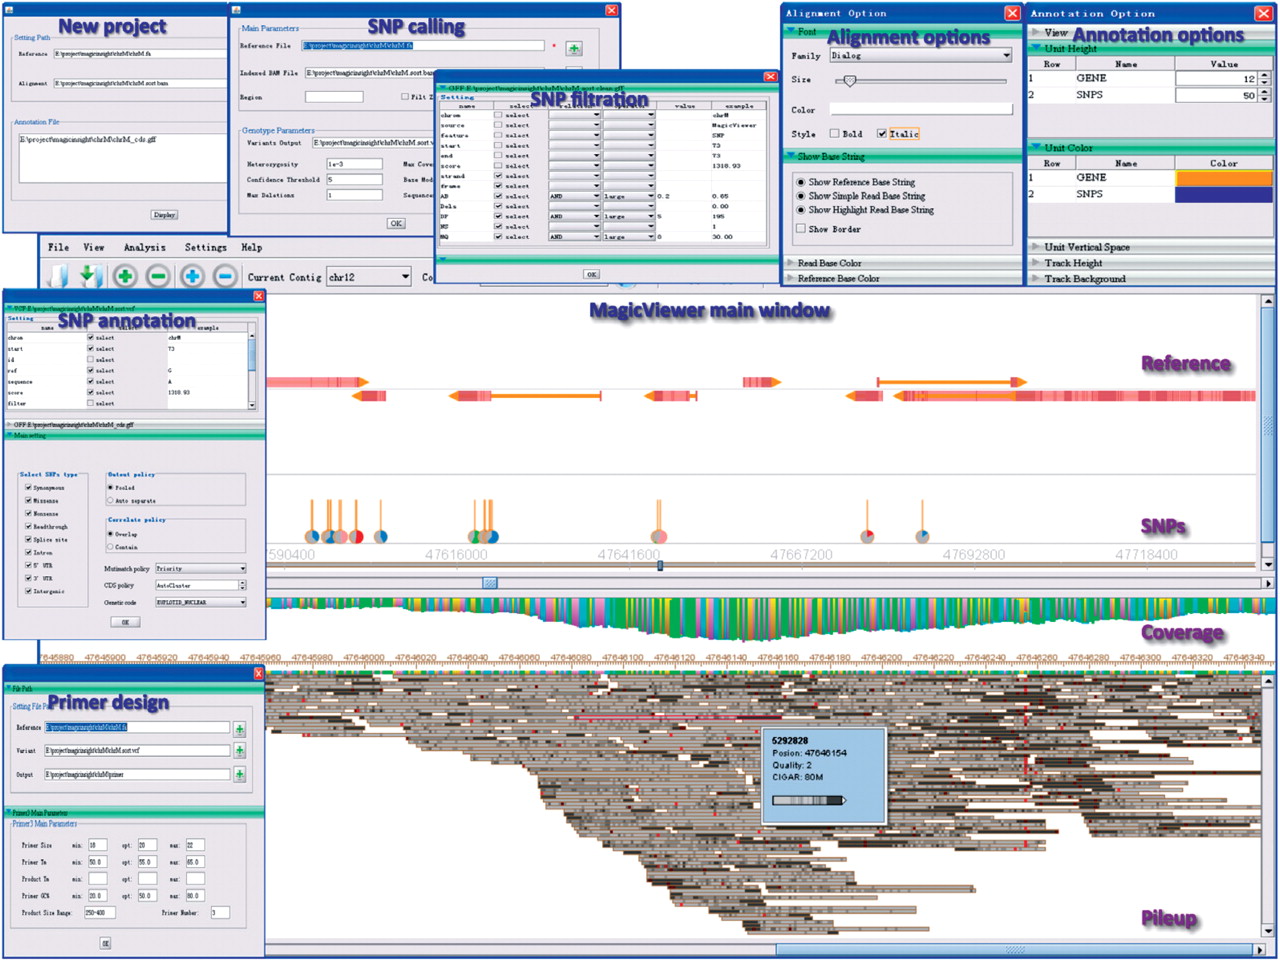
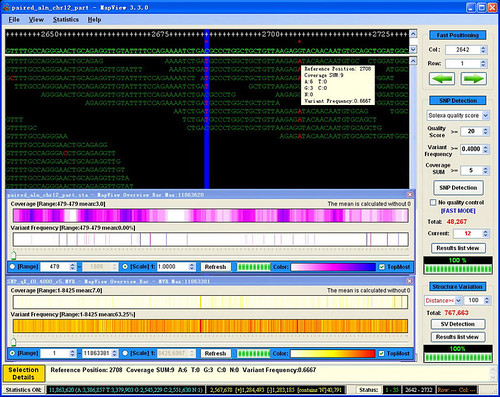
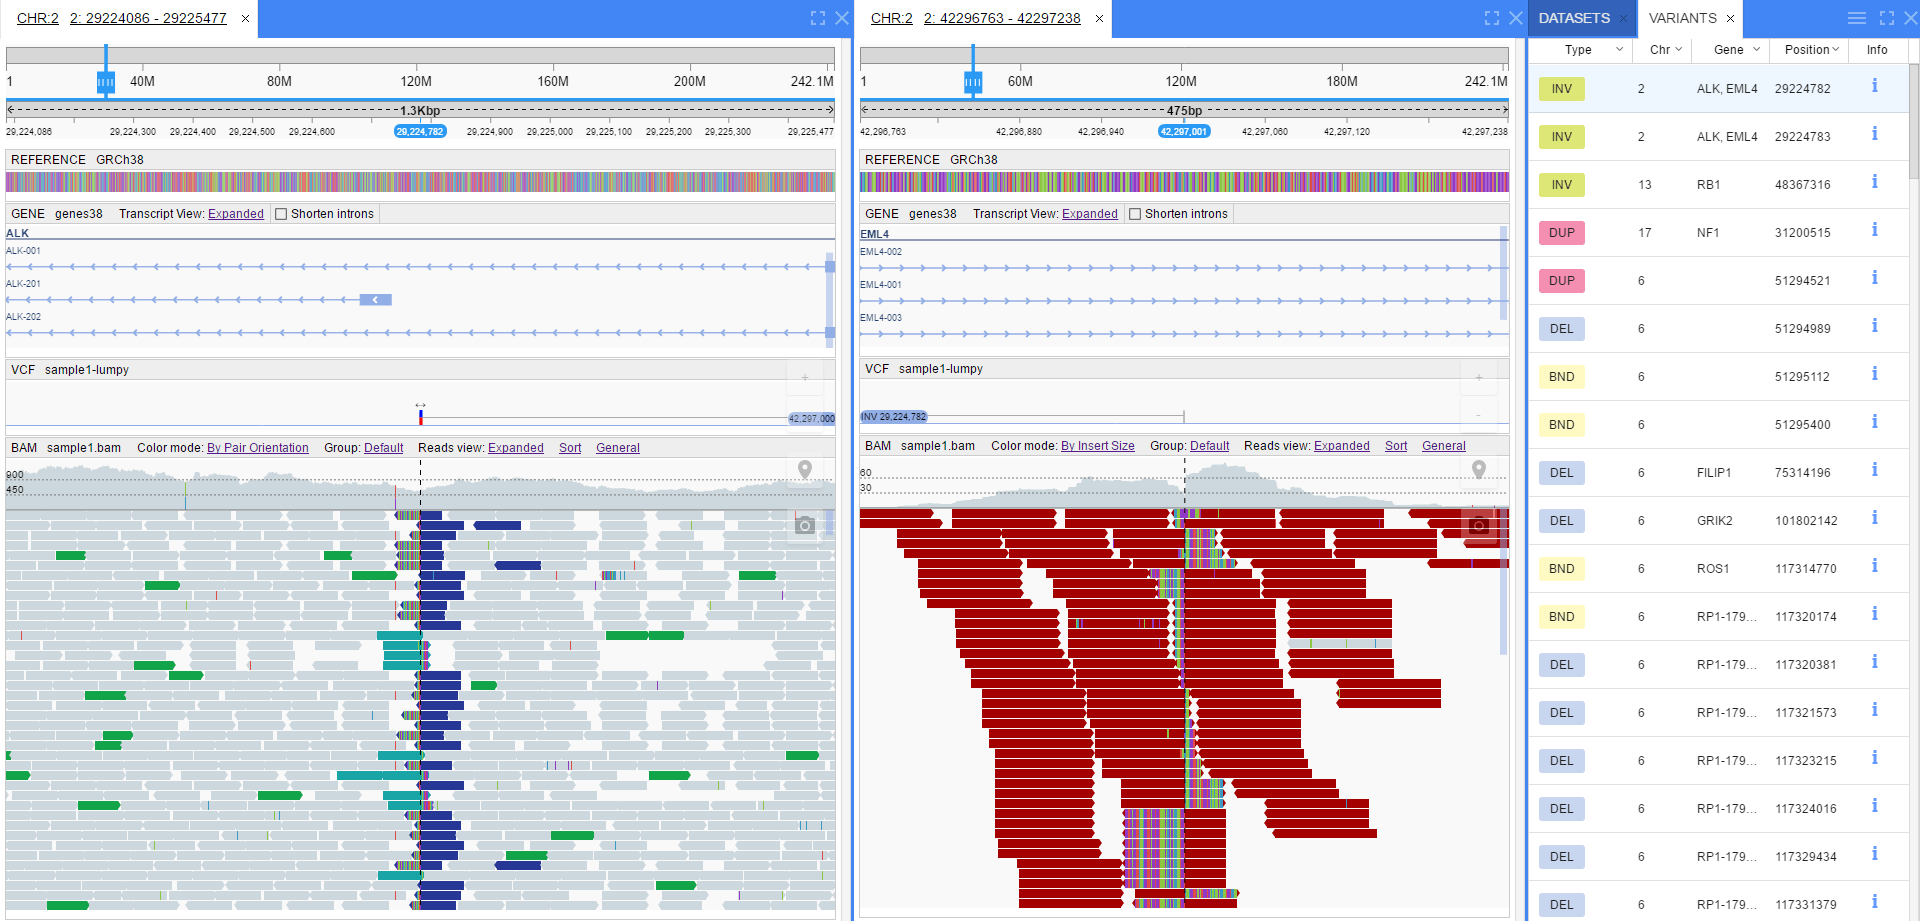
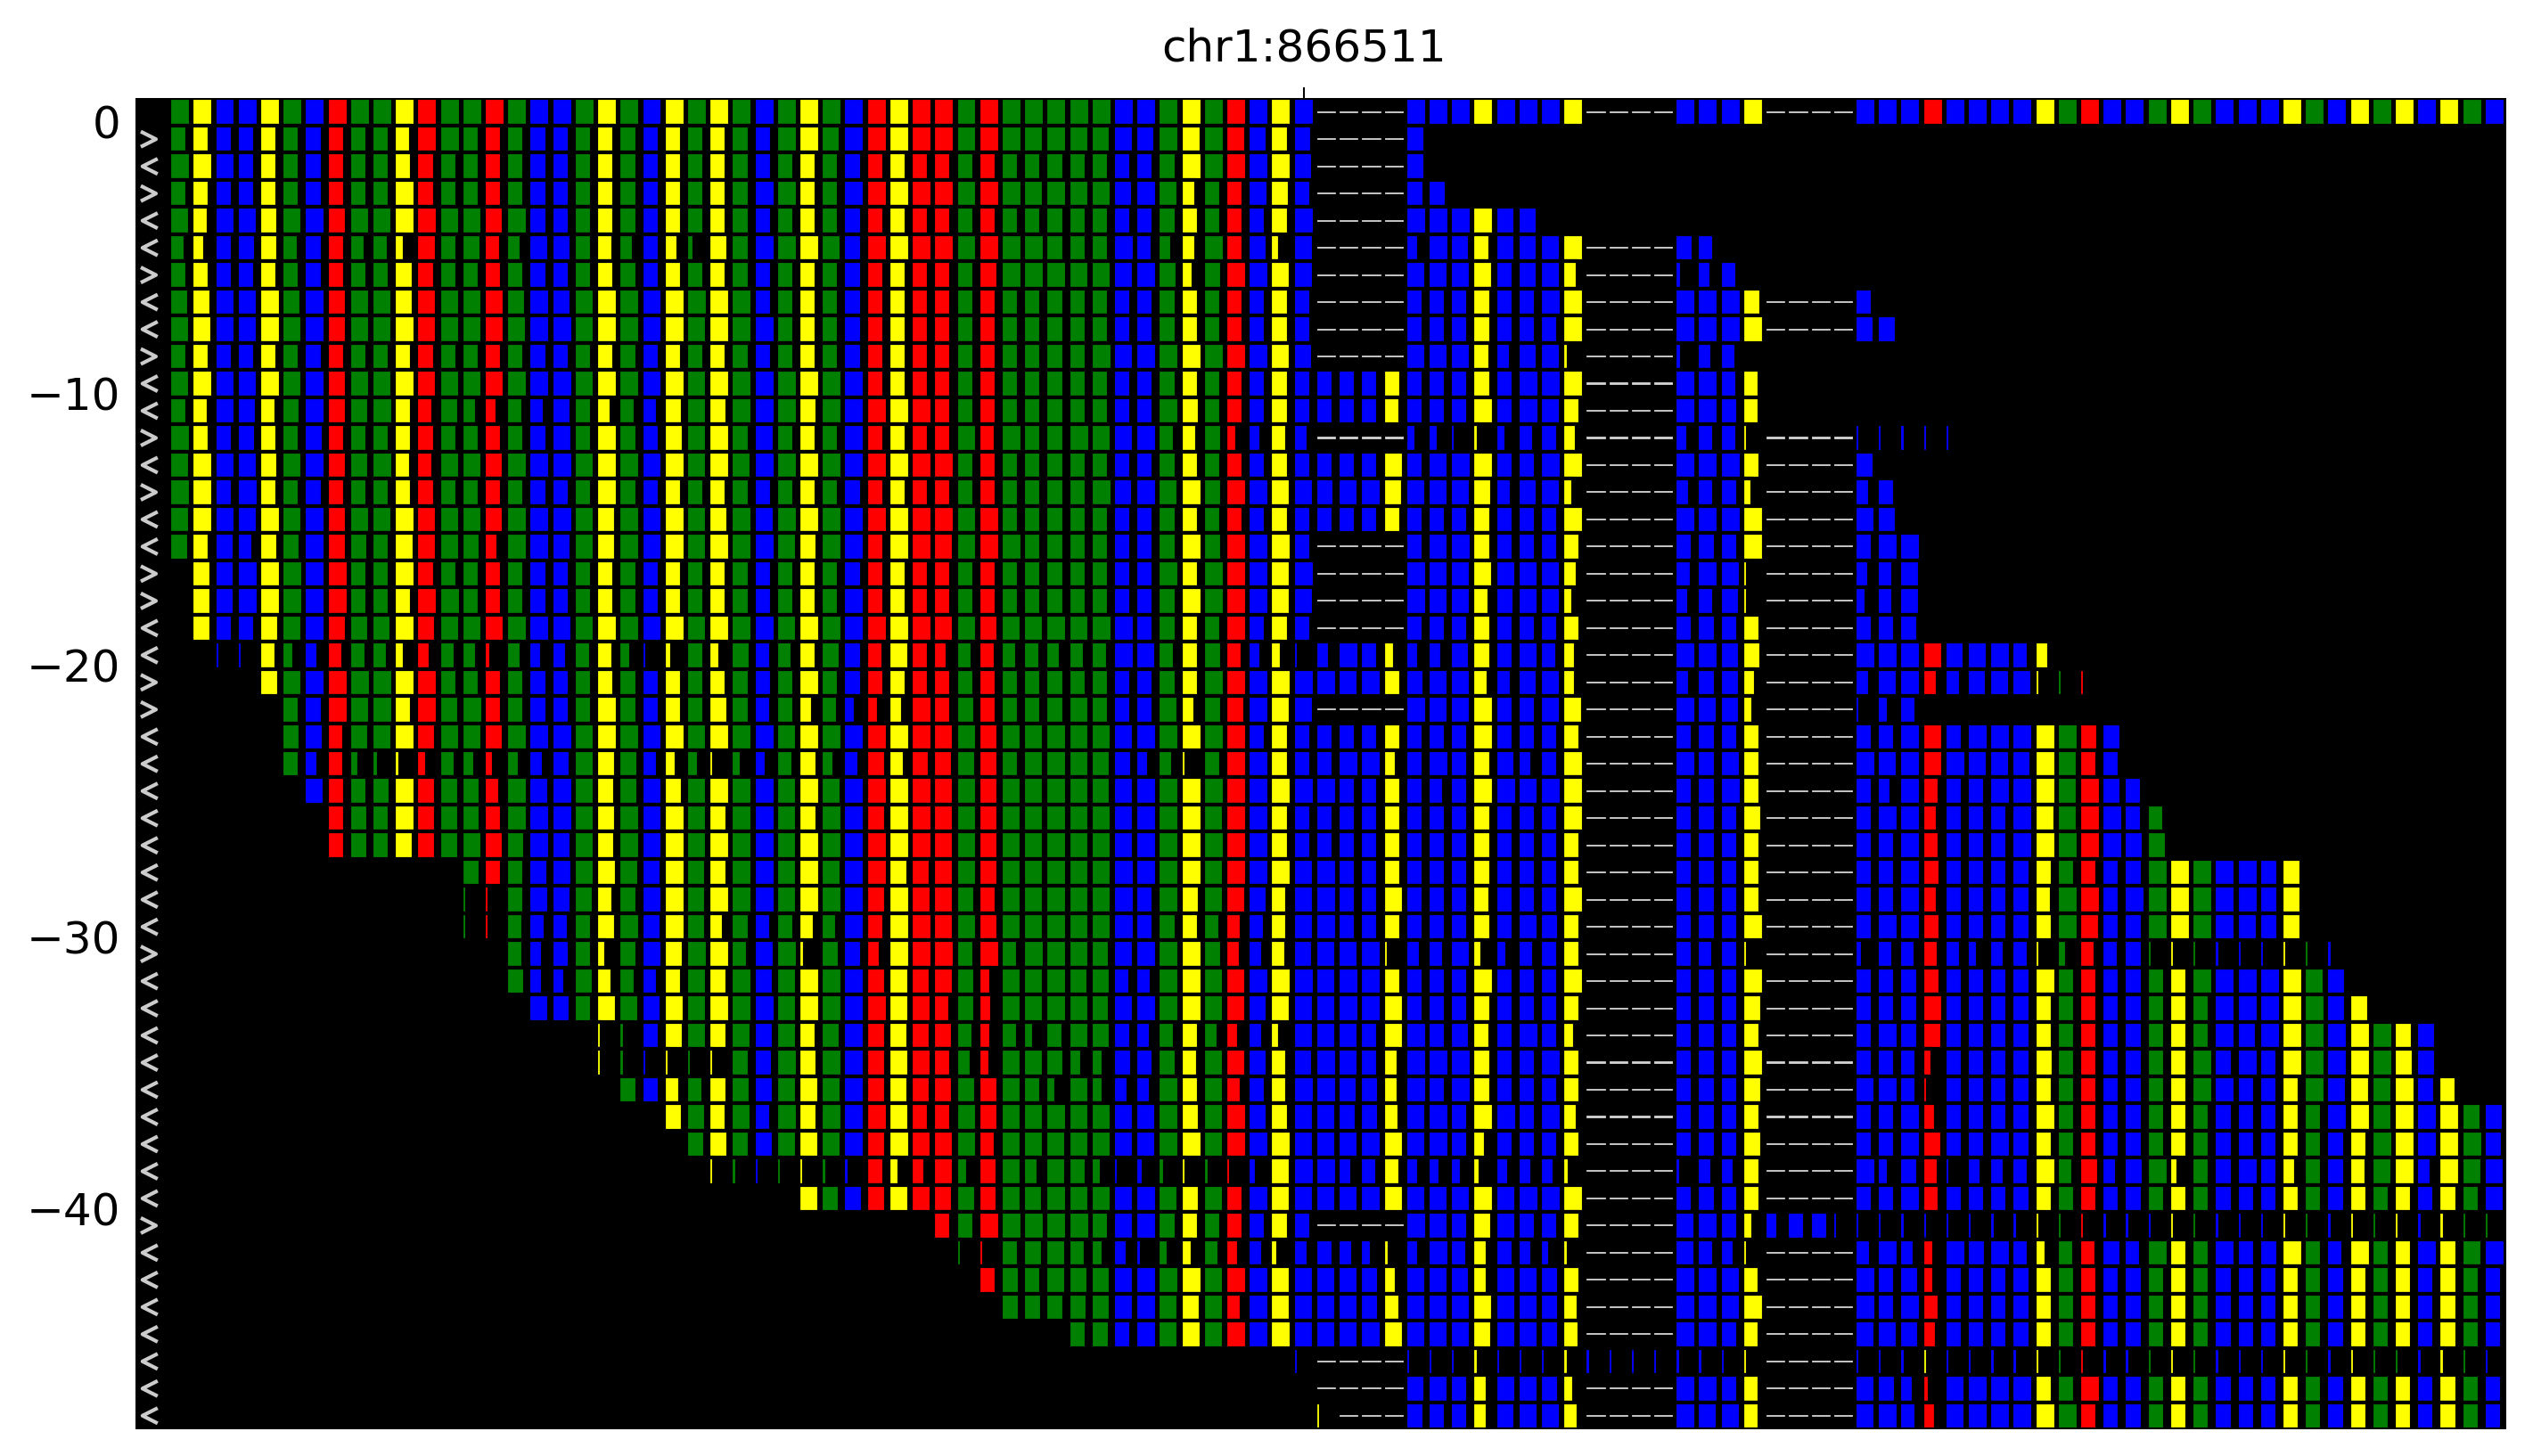
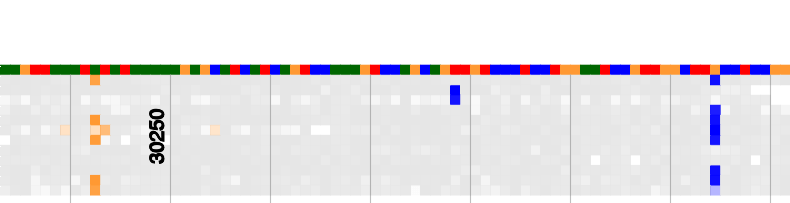
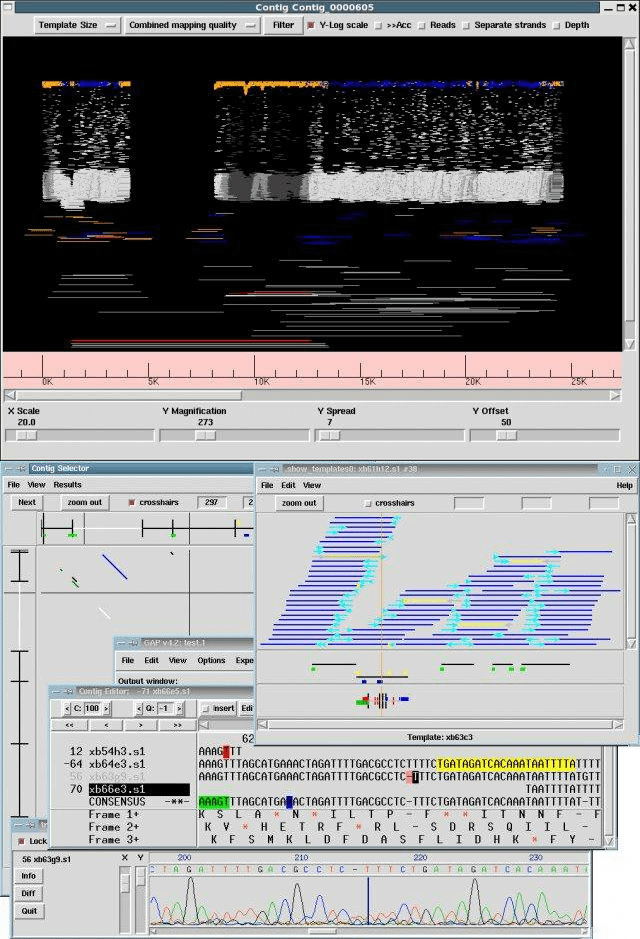
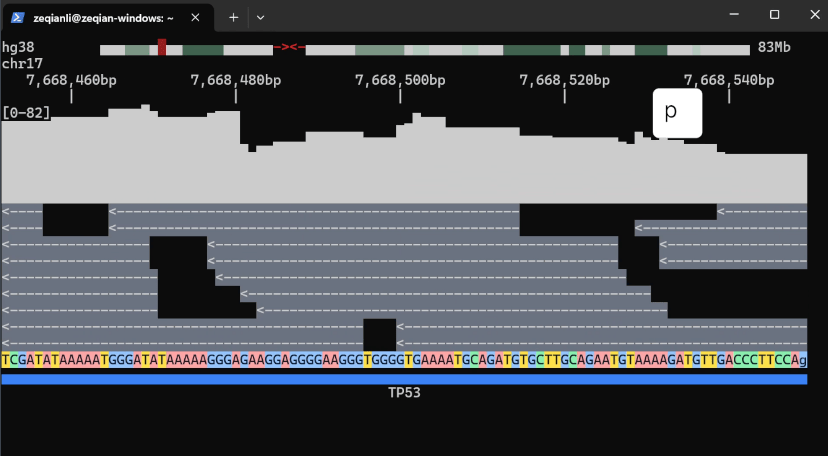
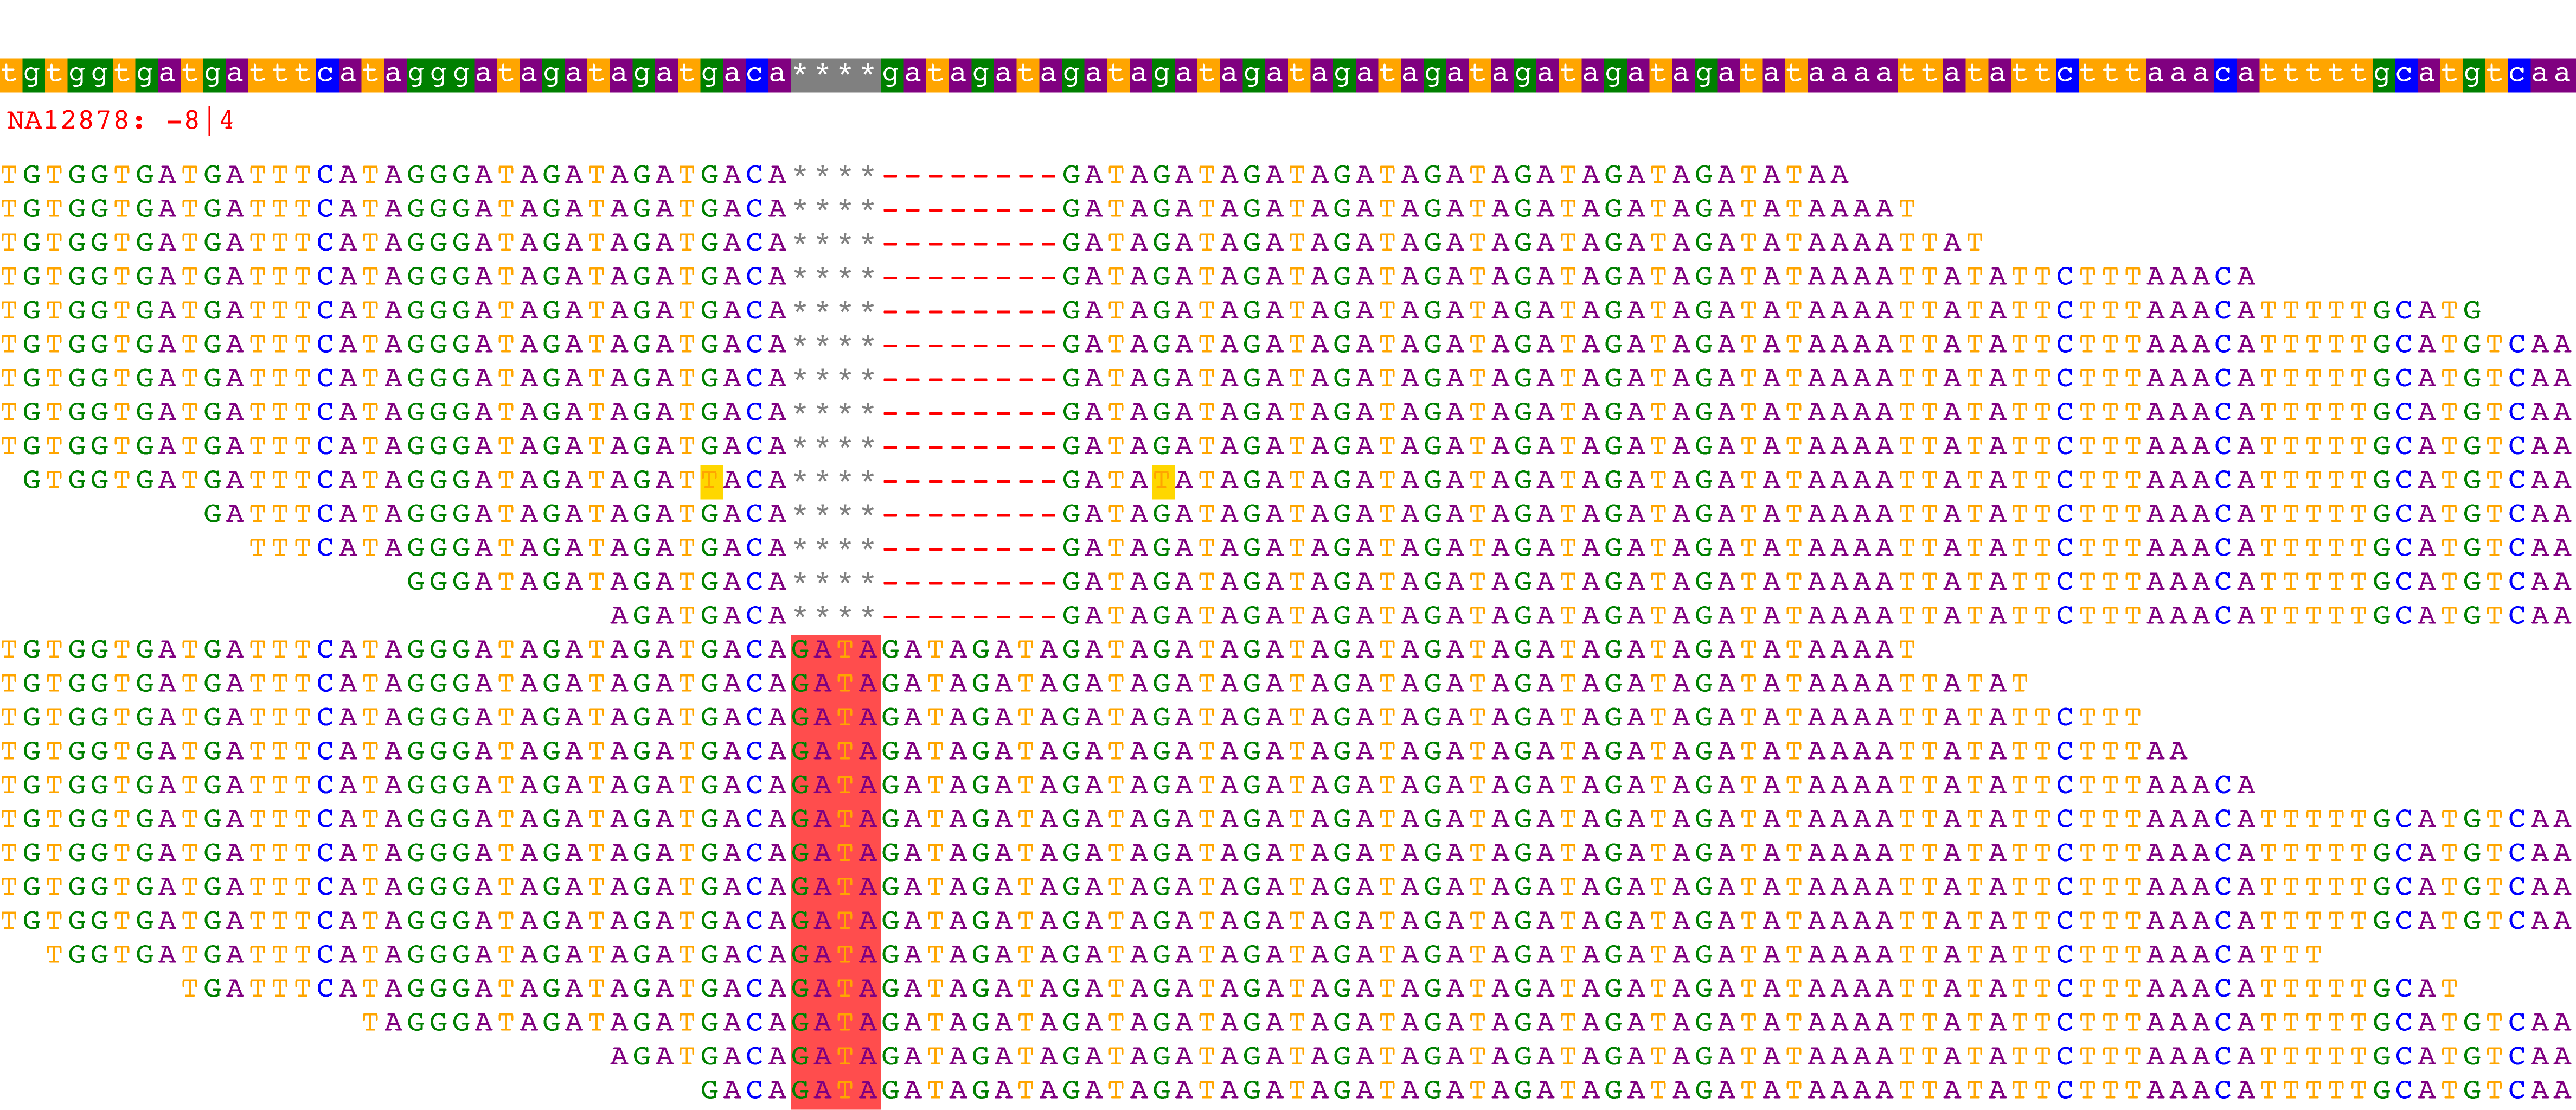
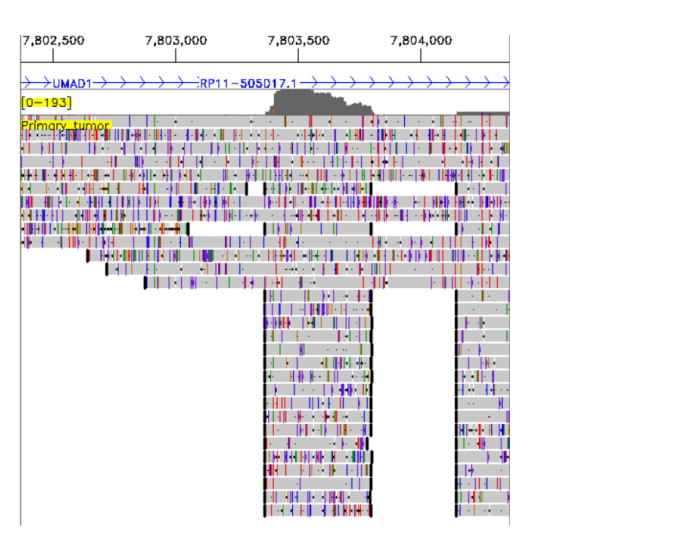
- GraphAlignmentViewer (img)
- miropeats (image from 2021 paper https://www.biorxiv.org/content/10.1101/2021.12.08.471837v1.full.pdf) (img)
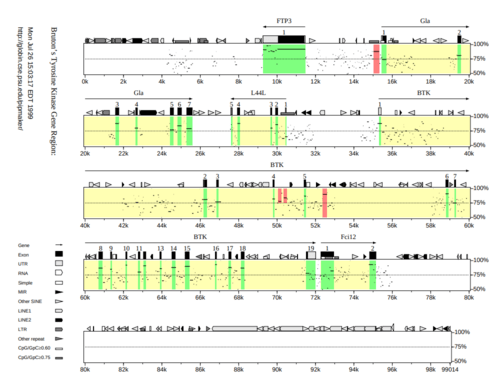
- PipMaker (See also MultiPipMaker http://pipmaker.bx.psu.edu/pipmaker/mpm-example/index.html) (img)
- REPAVER (img)
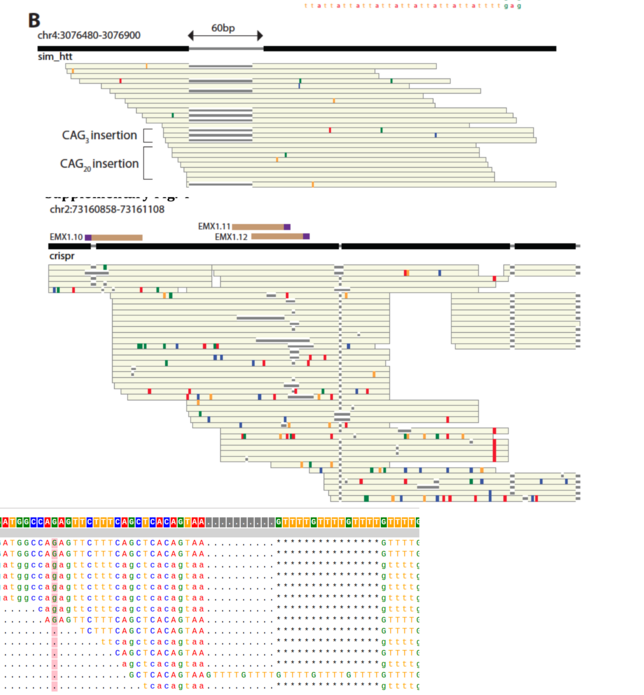
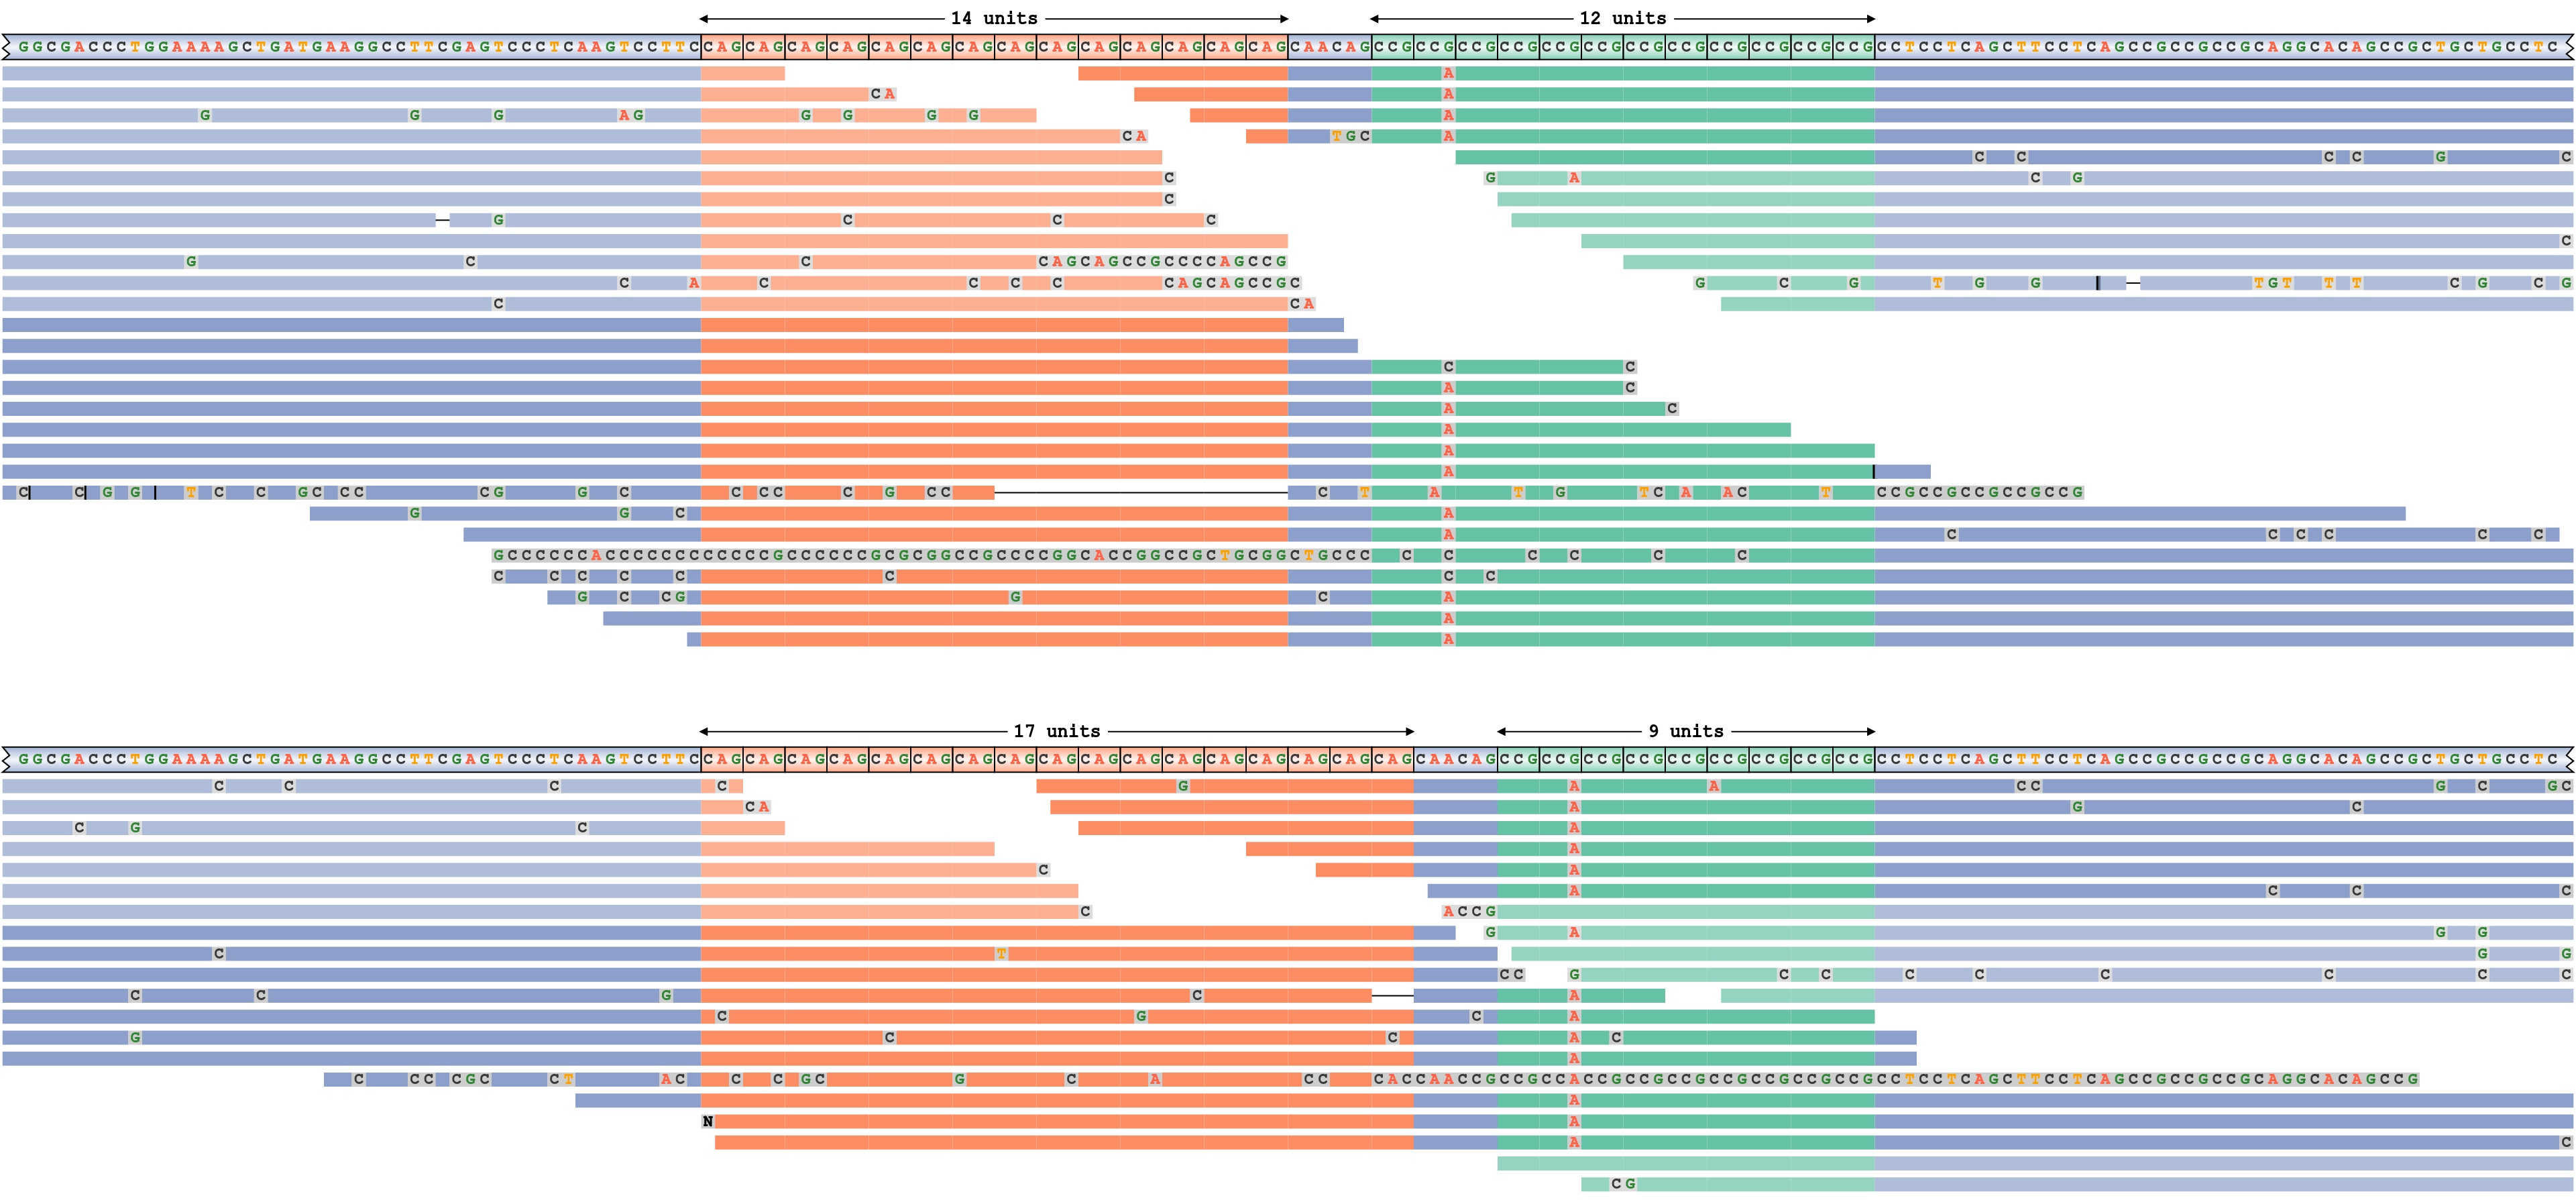
- REViewer (See also GraphAlignmentViewer, similar look and from illumina also) (img)
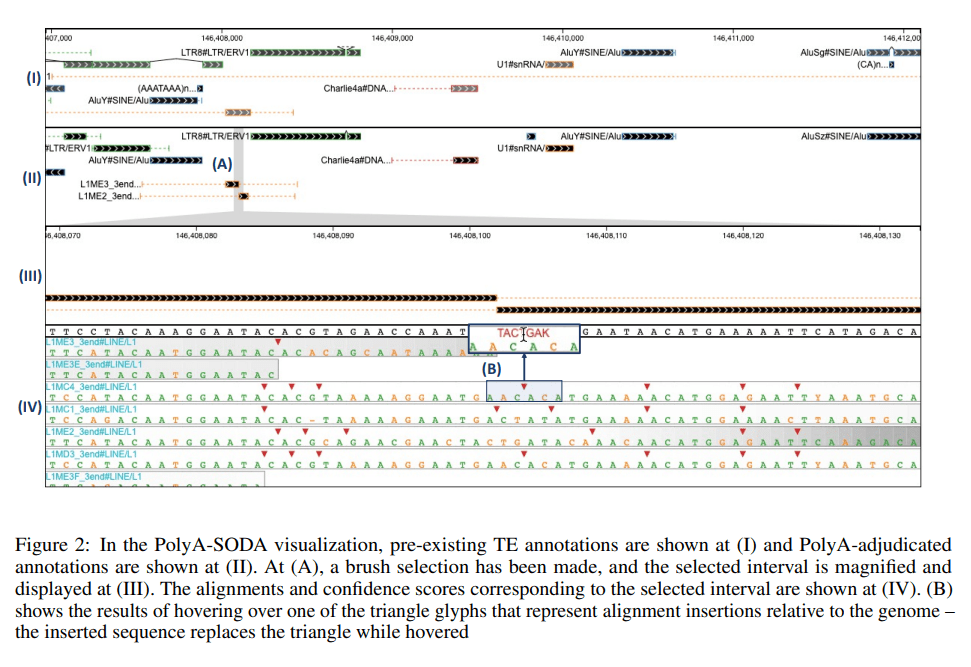
- SODA (Describes itself as a low-level library to create larger applications with) (img)
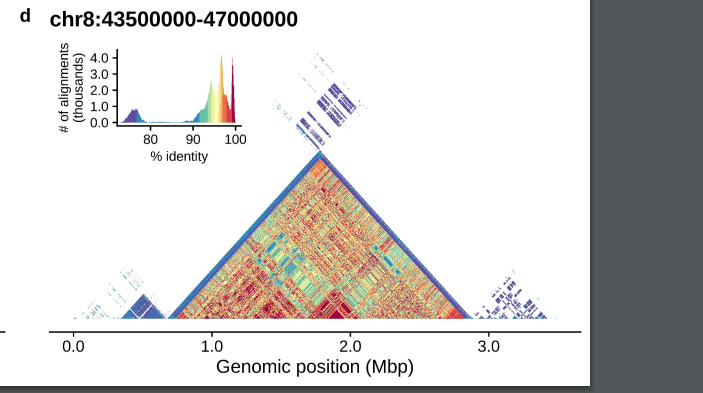
- StainedGlass (img)
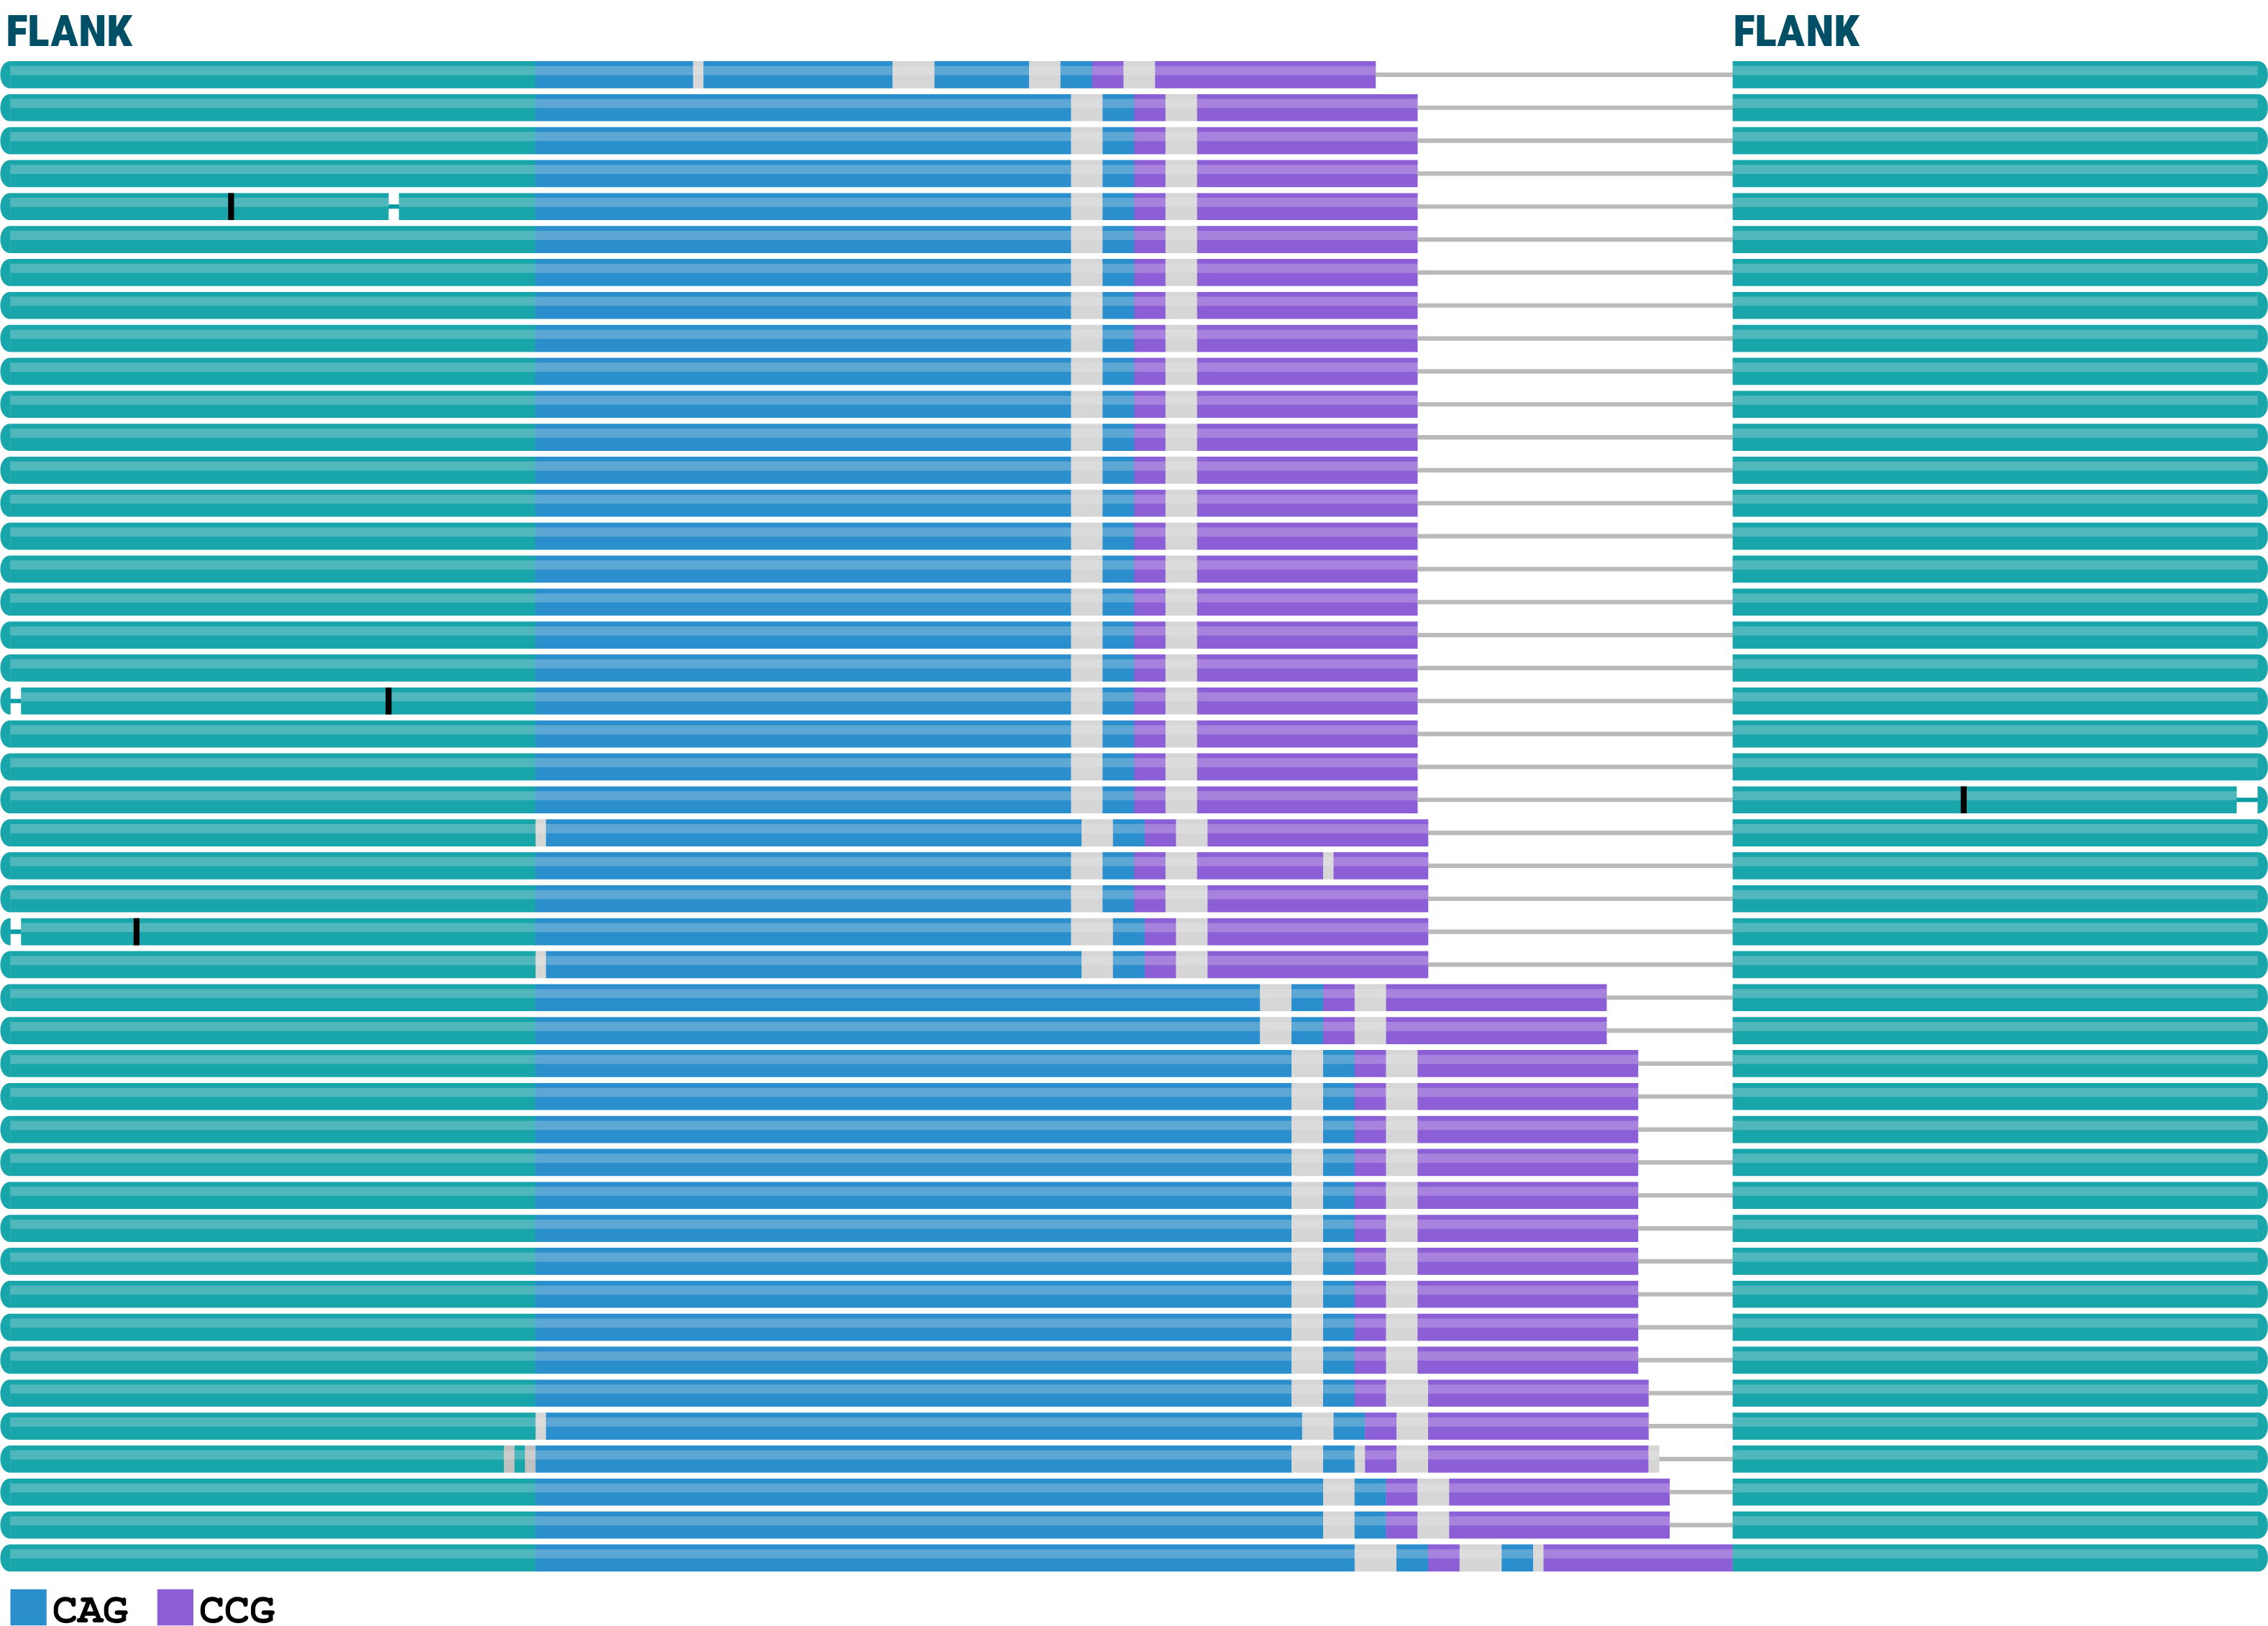
- TRVZ (TRGT tandem repeat genotyping visualizer) (img)
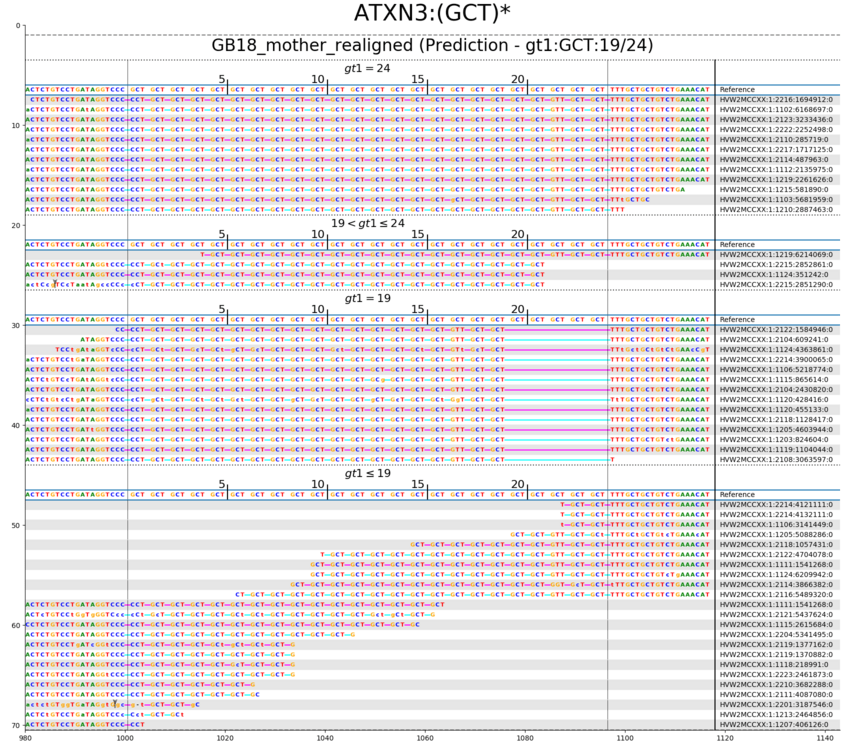
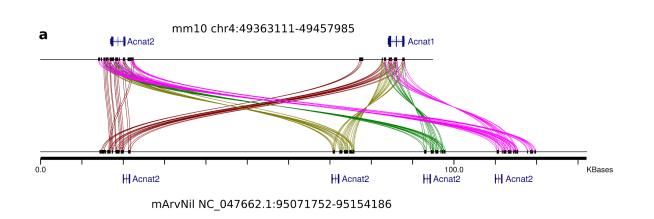
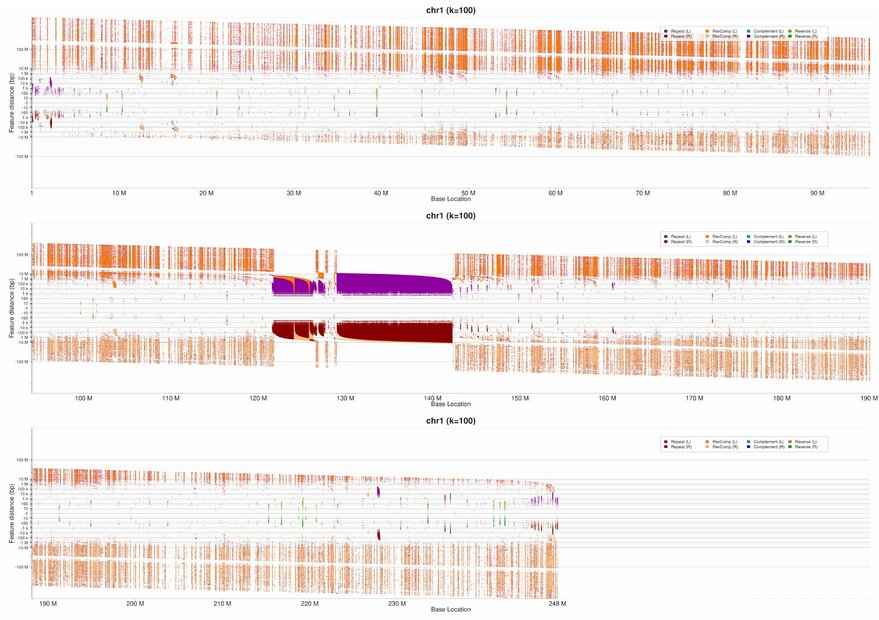
- ArchR (img)
- casper (img)
- copykat (img)
- gingko (img)
- MosaicCatcher pipeline (img)
- numbat (img)
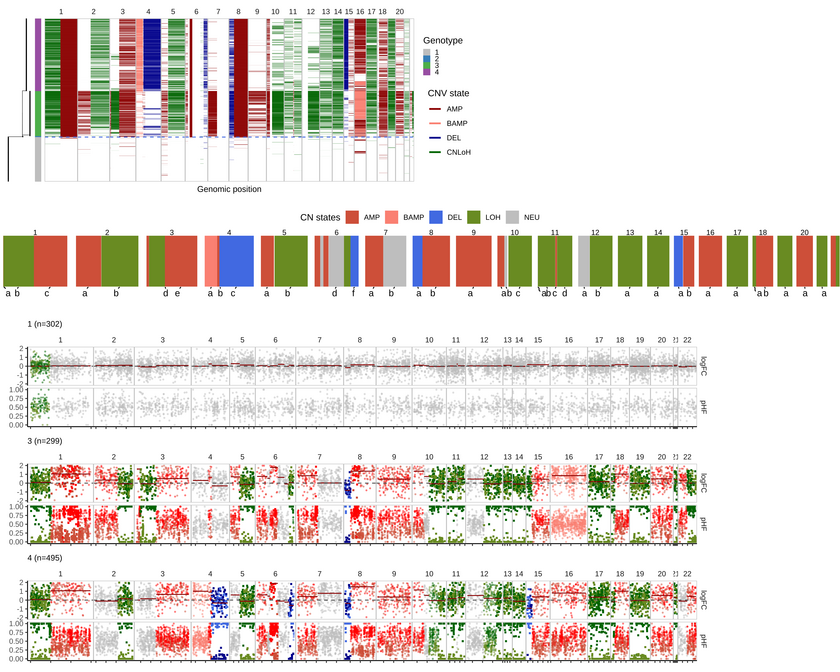
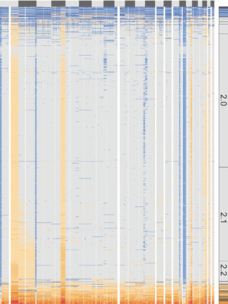
- scCNV_heatmap (img)
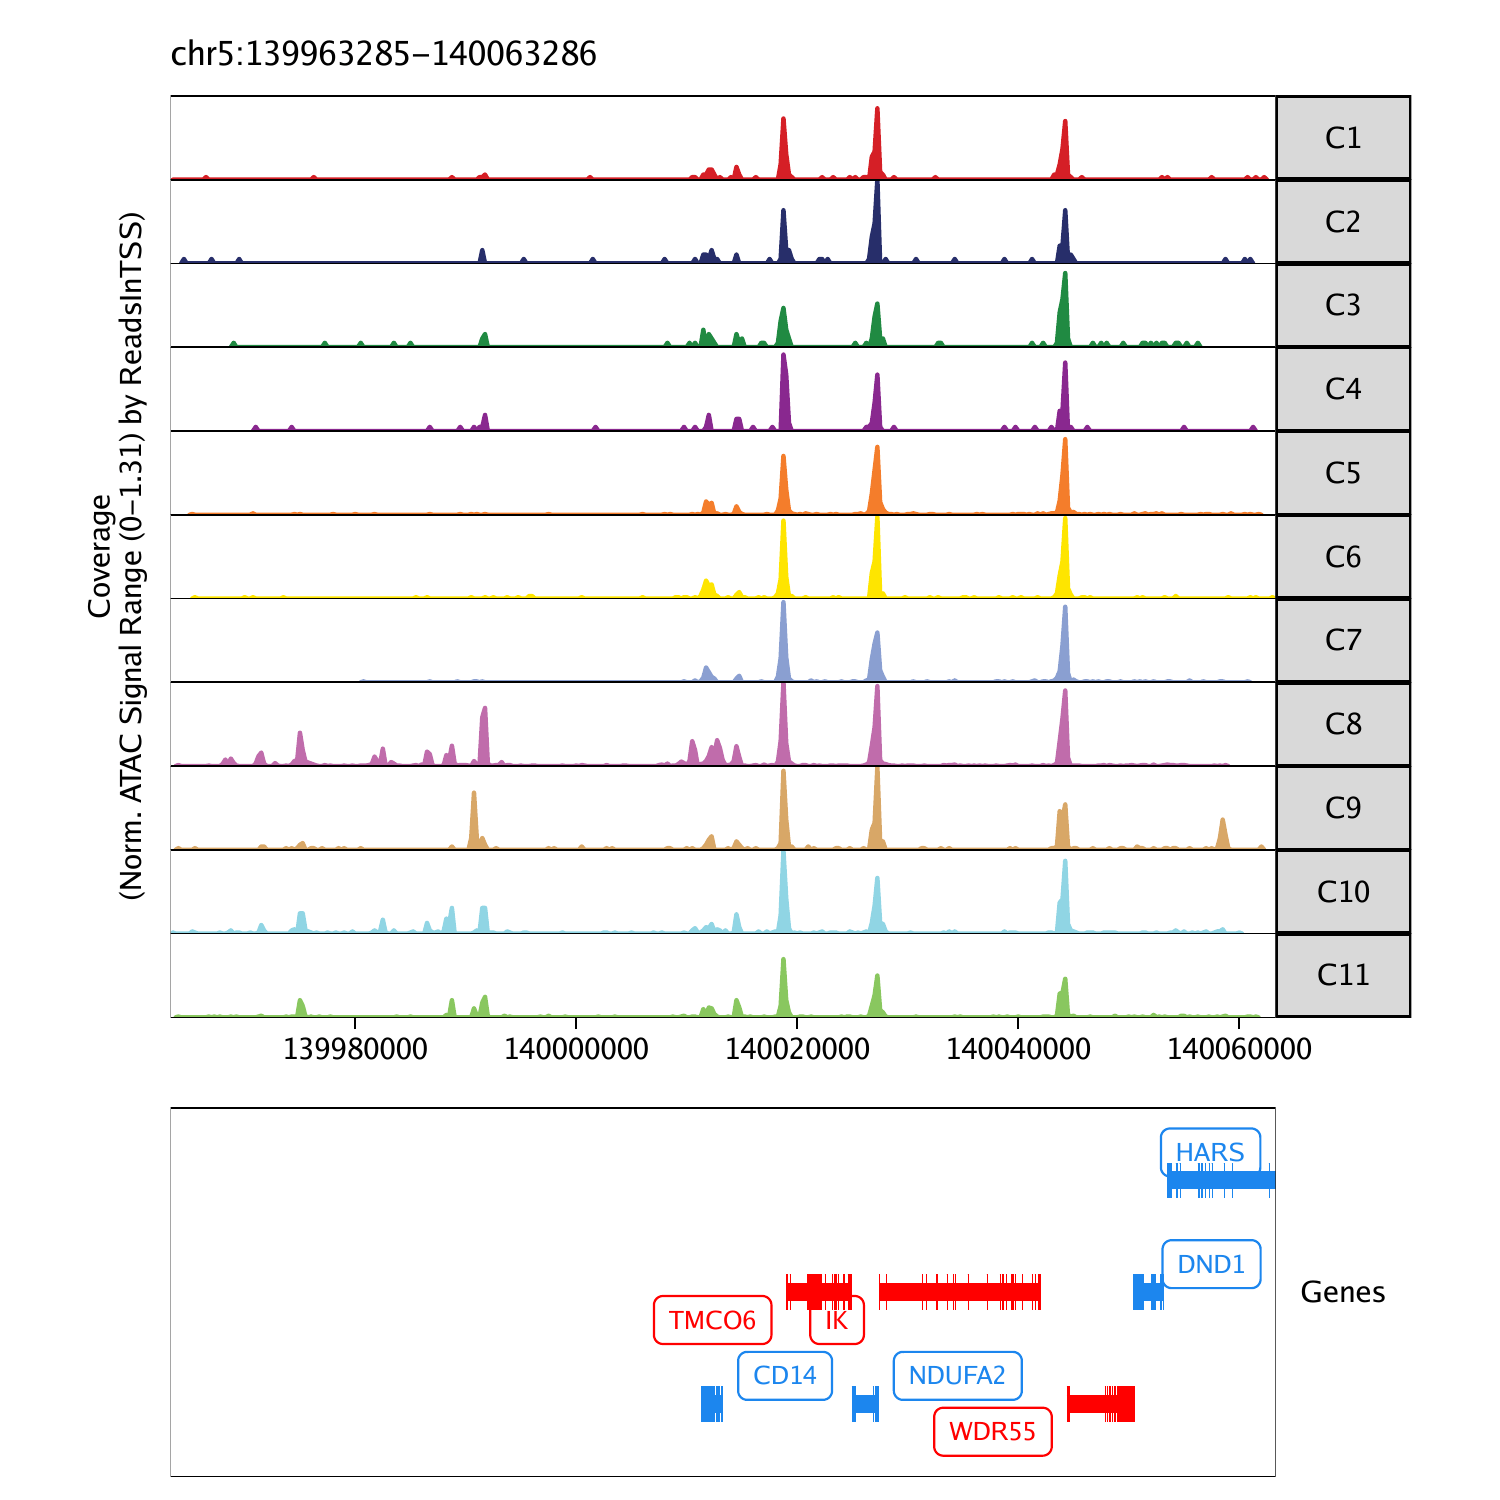
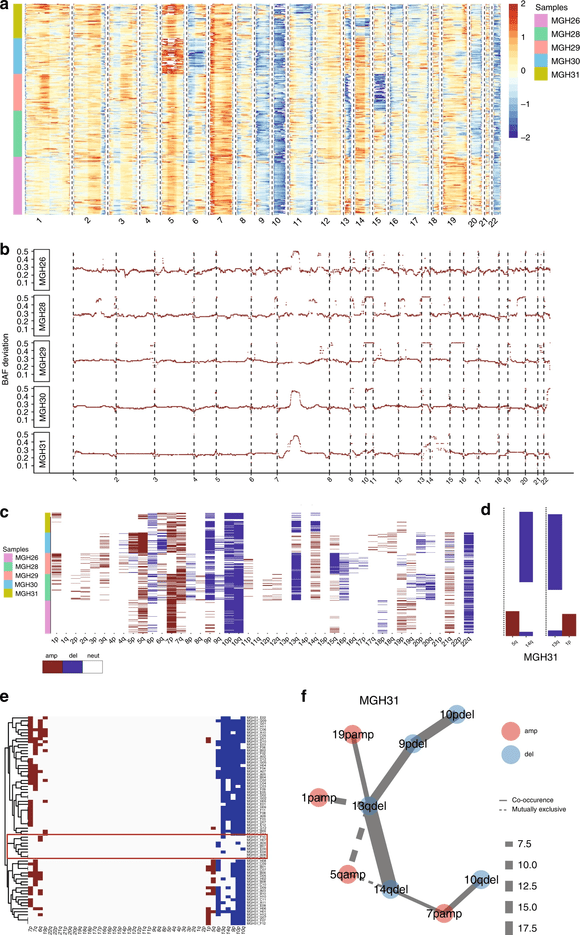

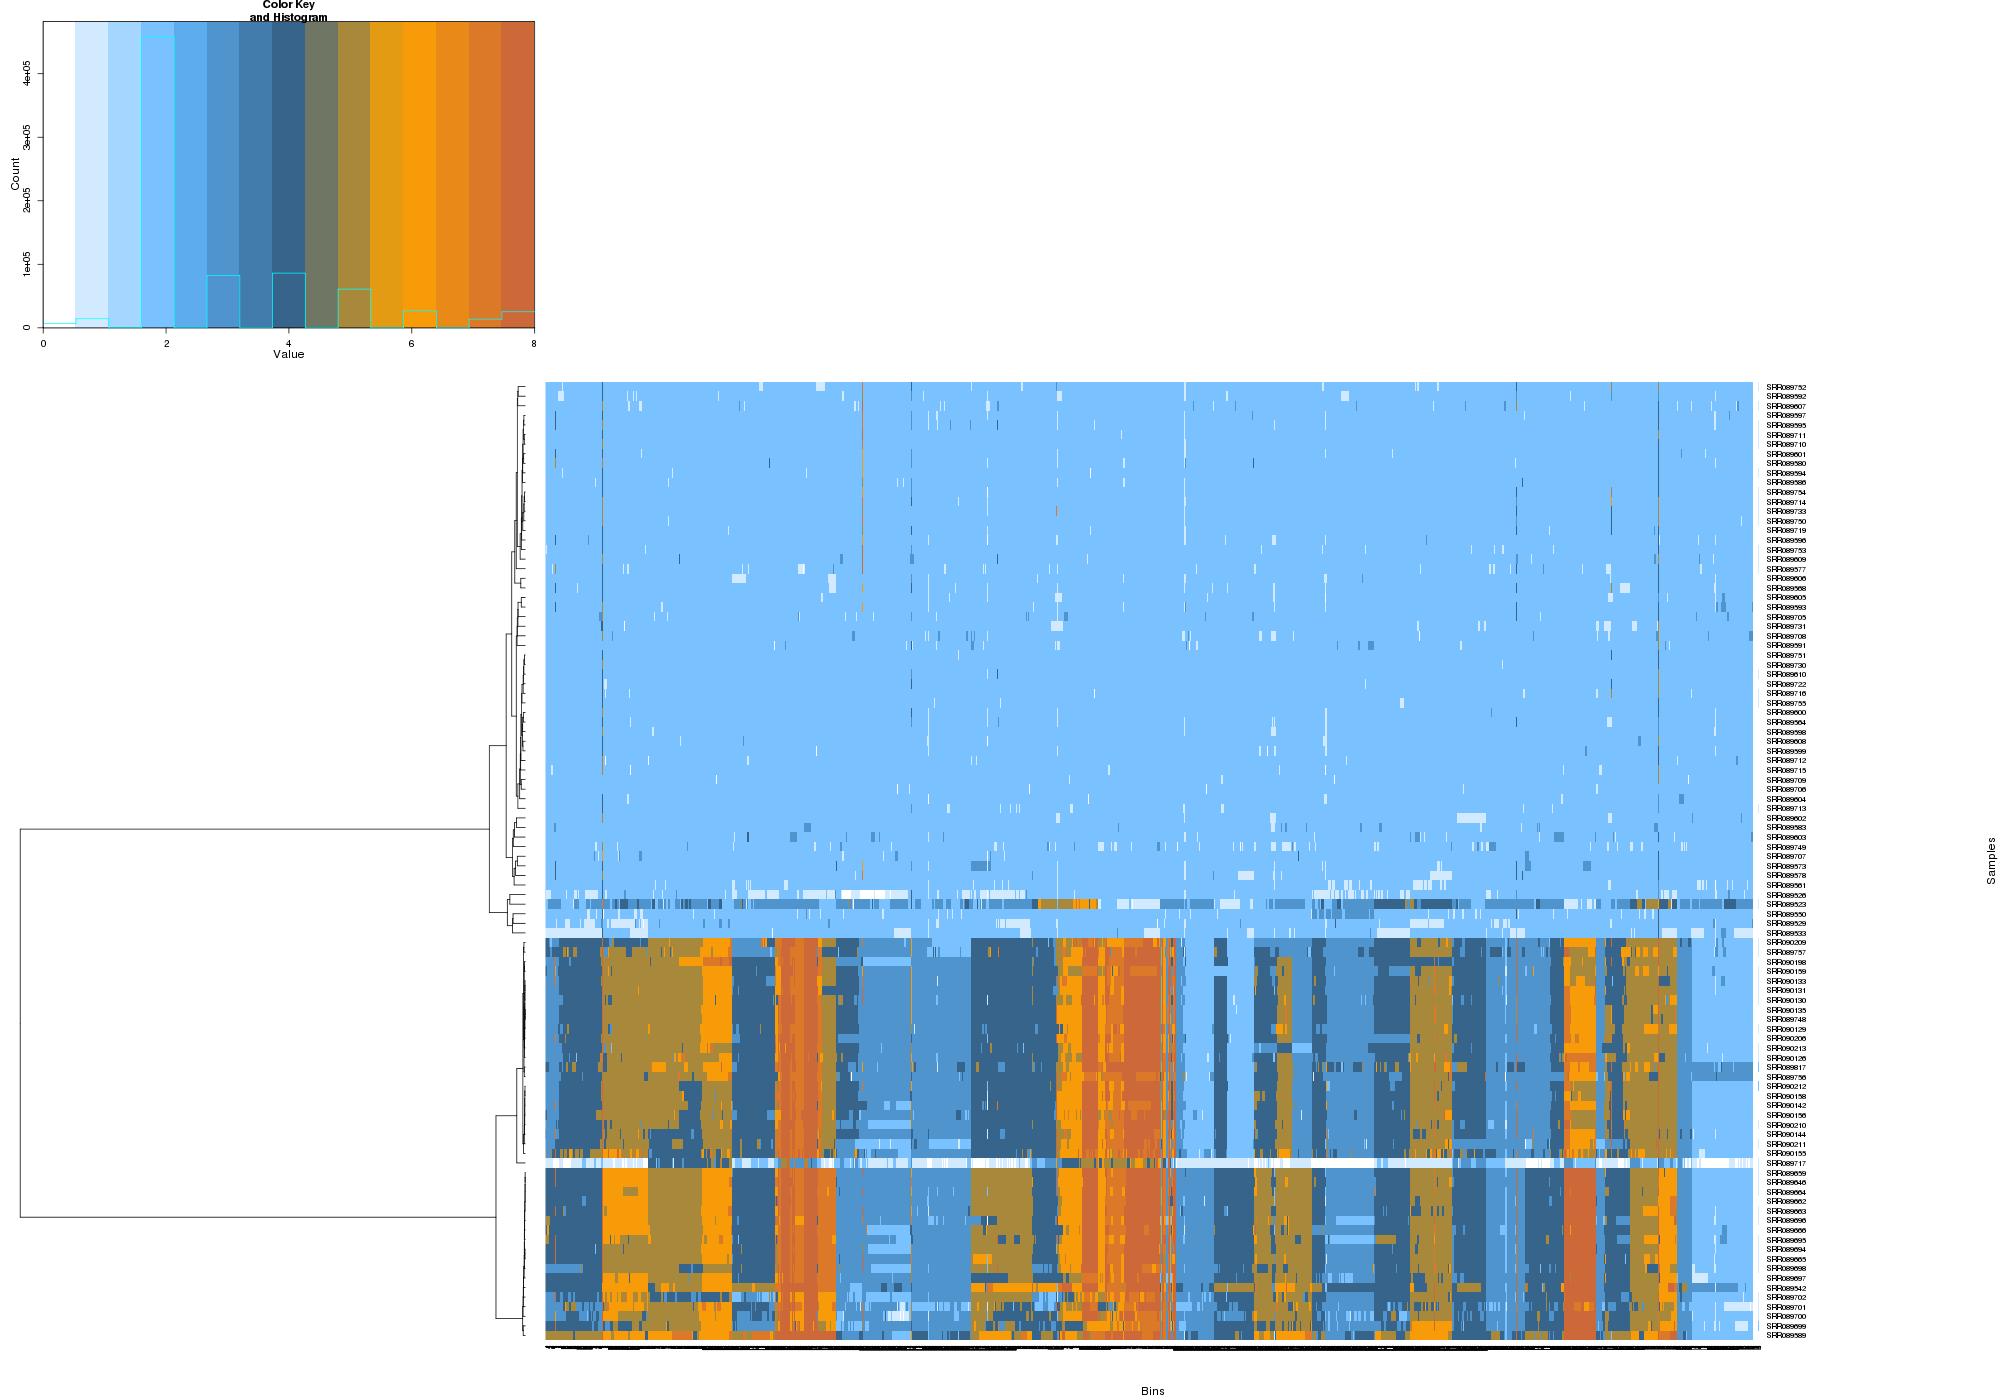
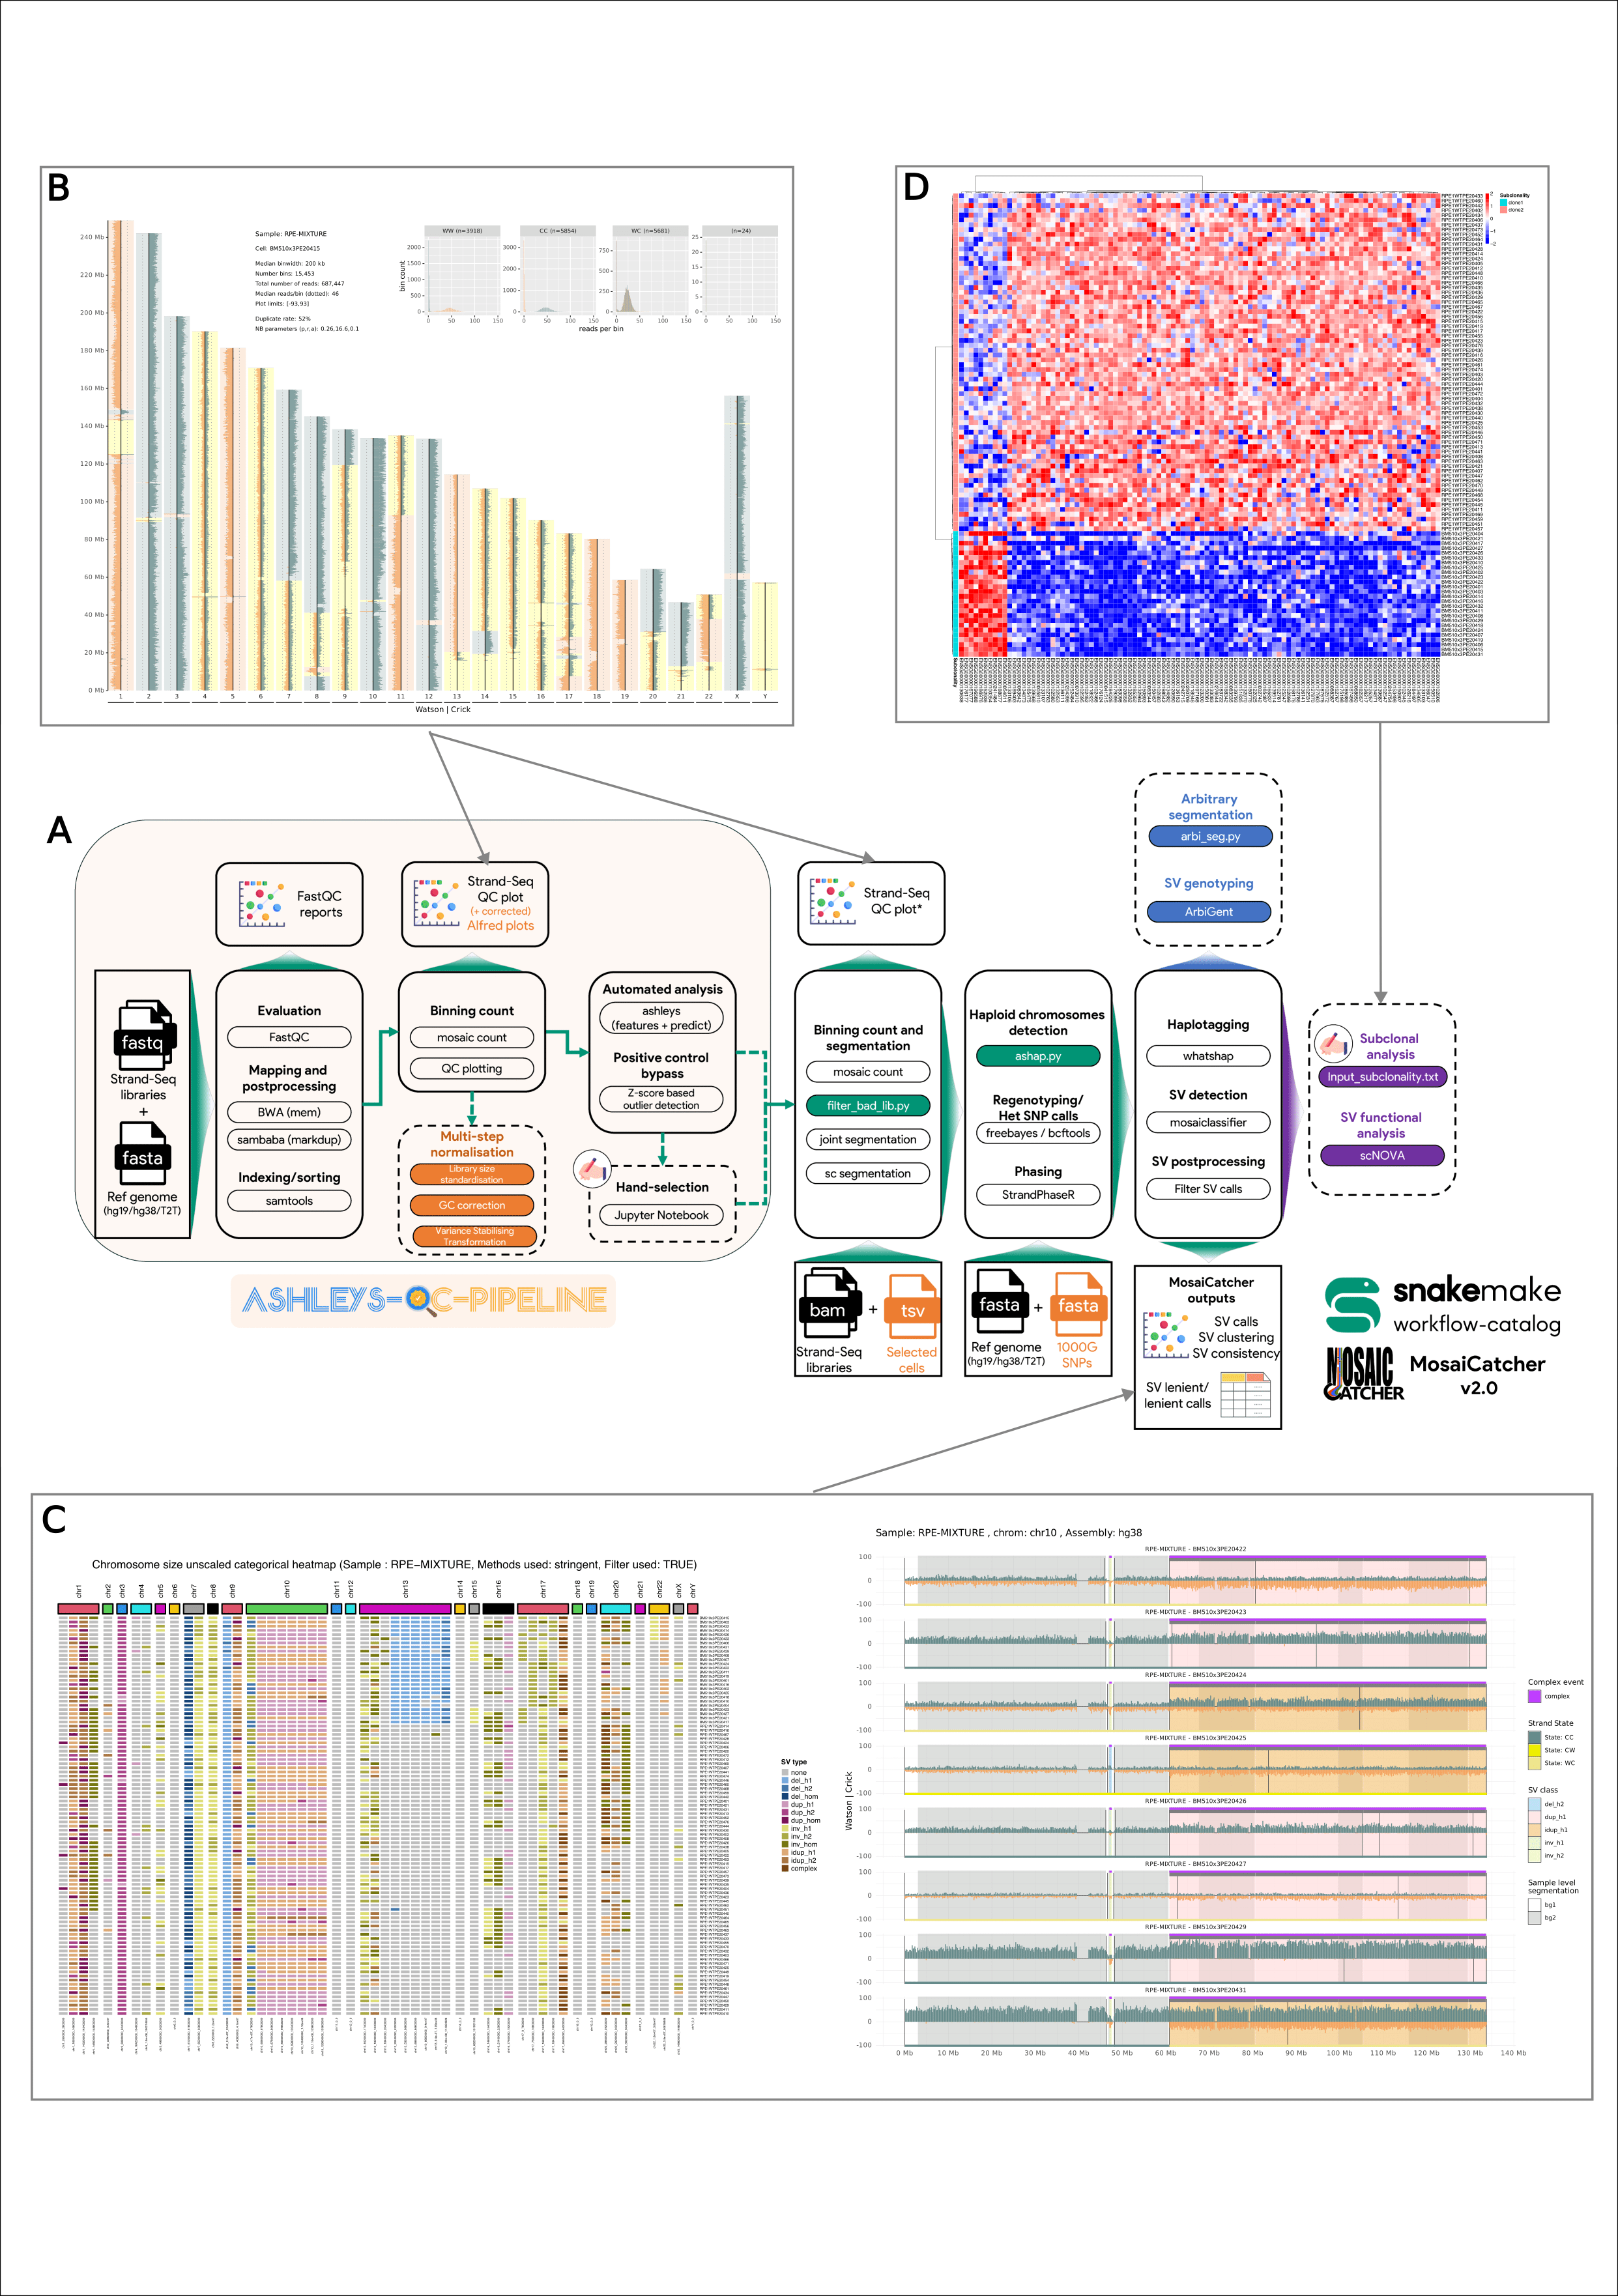
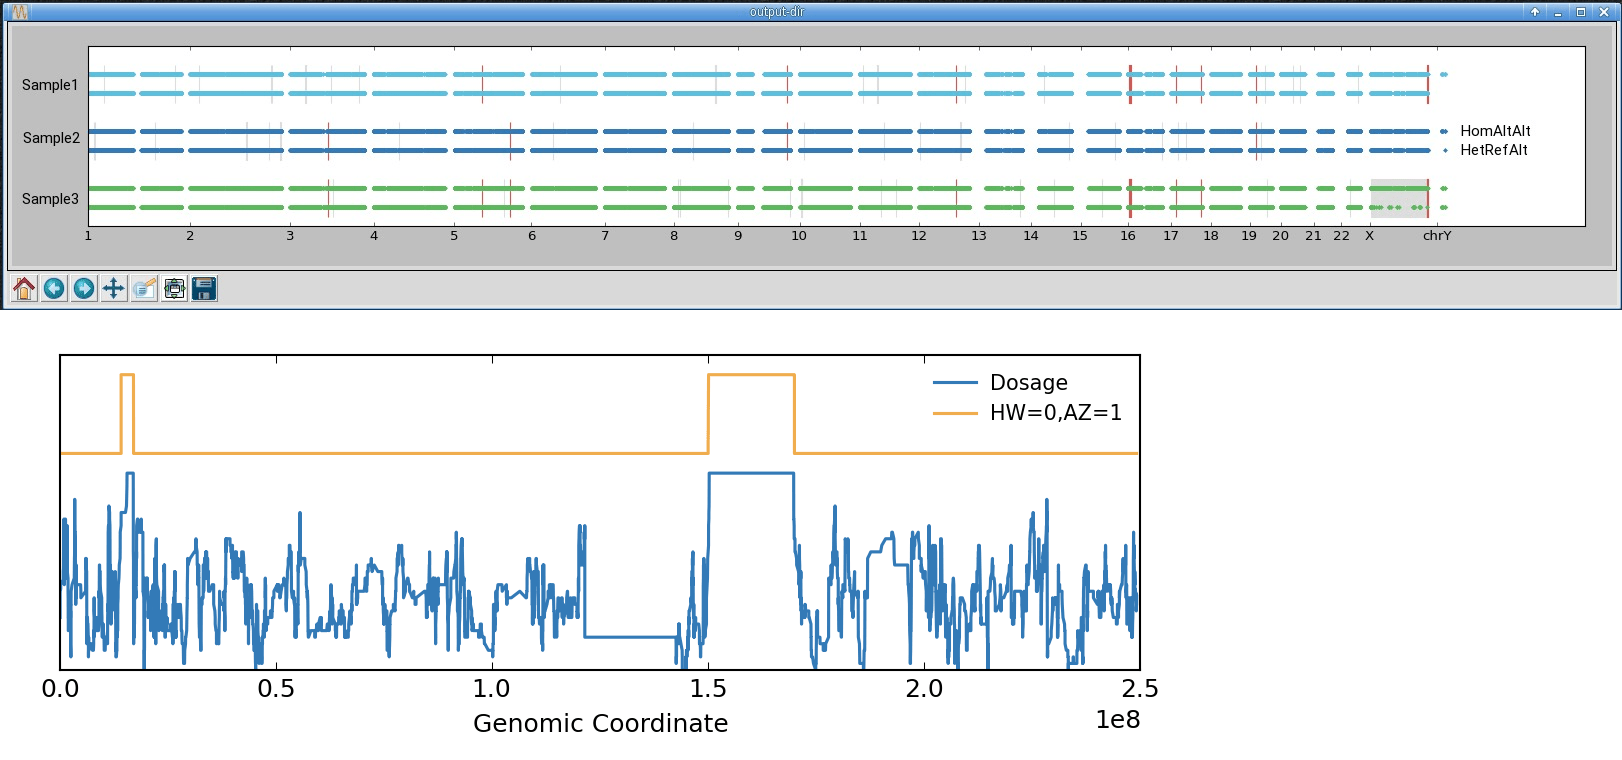
- bcftools roh (Plots runs of homozygosity, has interactive plot-roh.py helper too) (img)
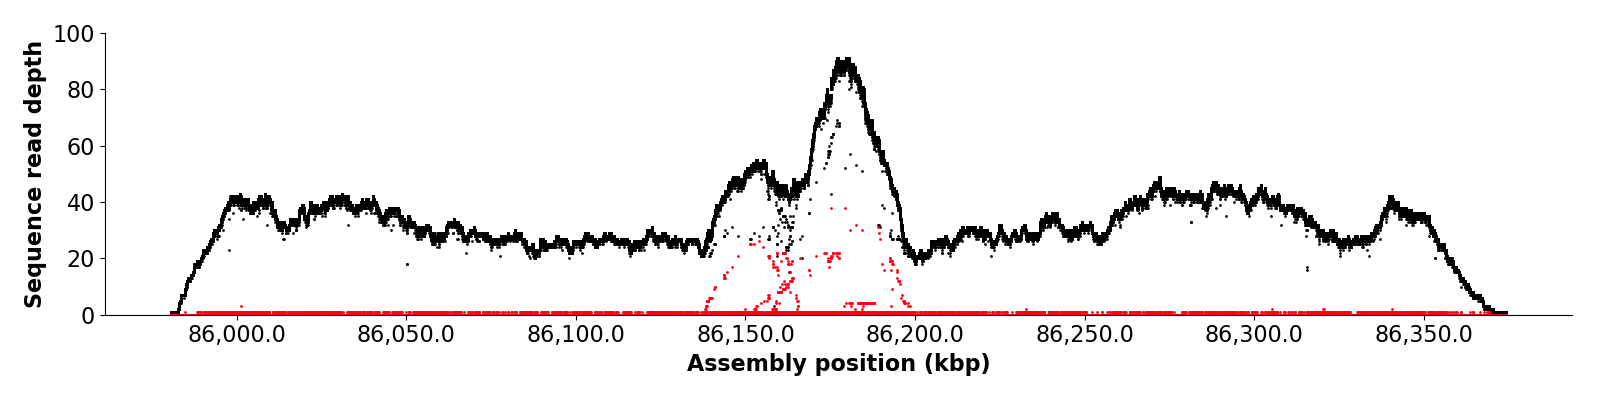
- NucFreq (img)
- phasius (img)
- snpit (img)
- vcfPlotein (img)
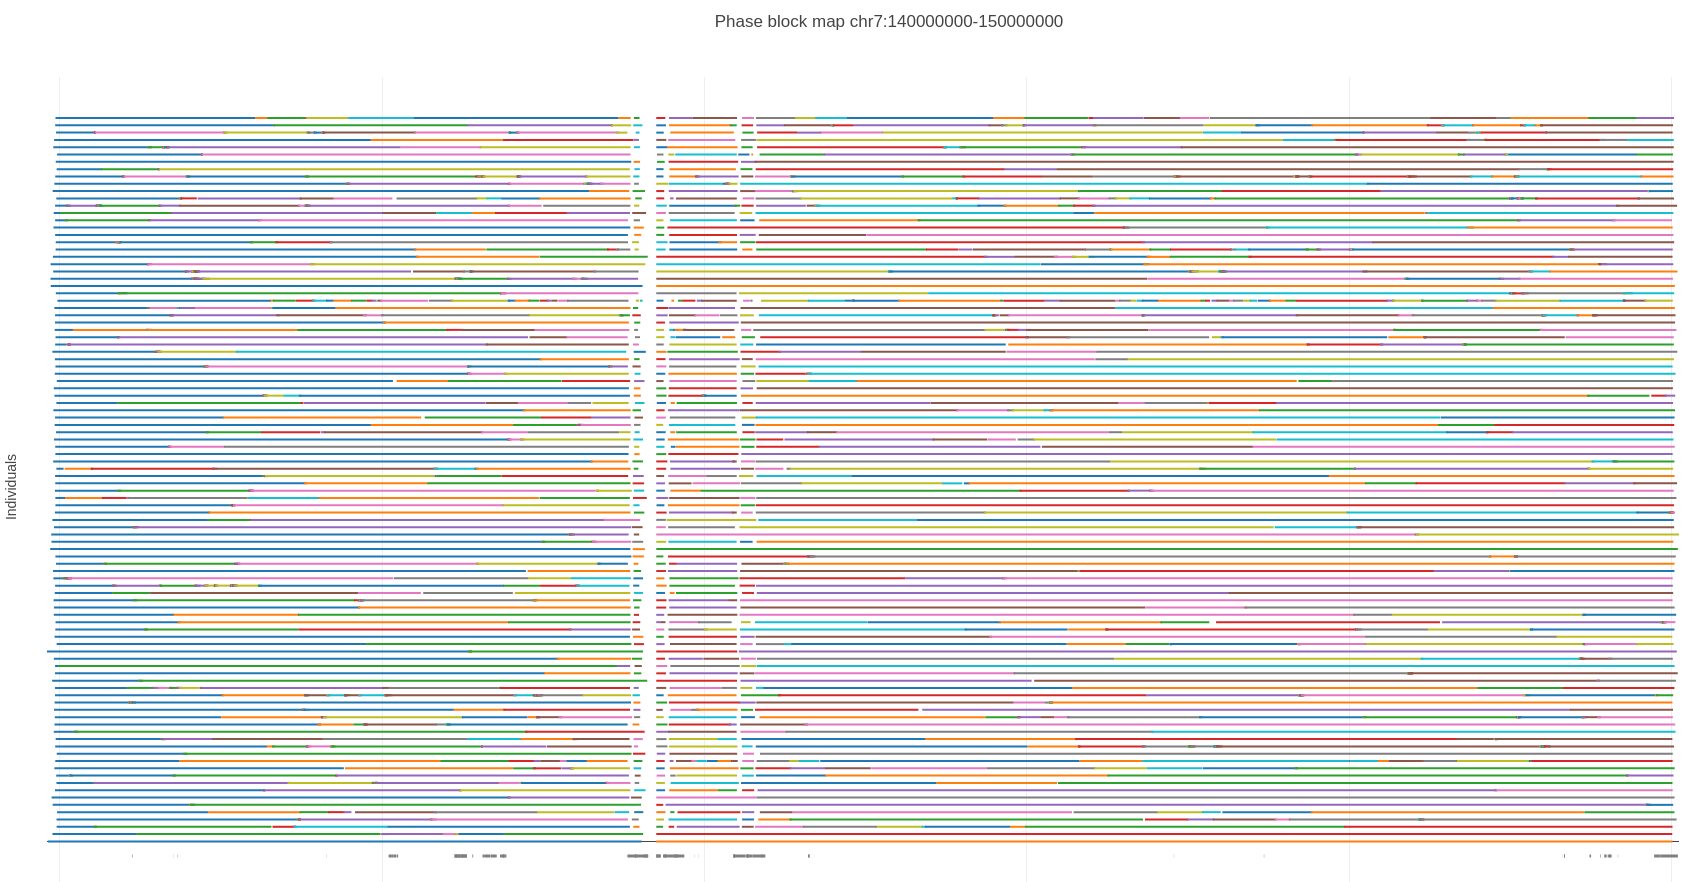
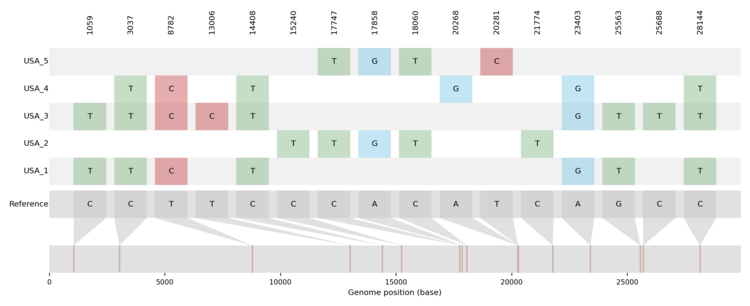
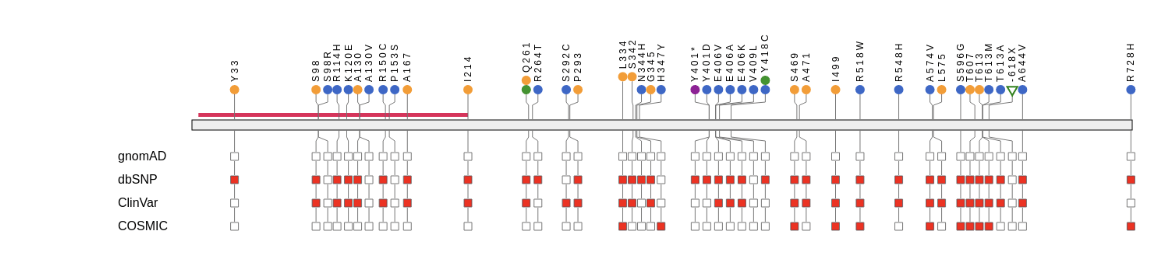
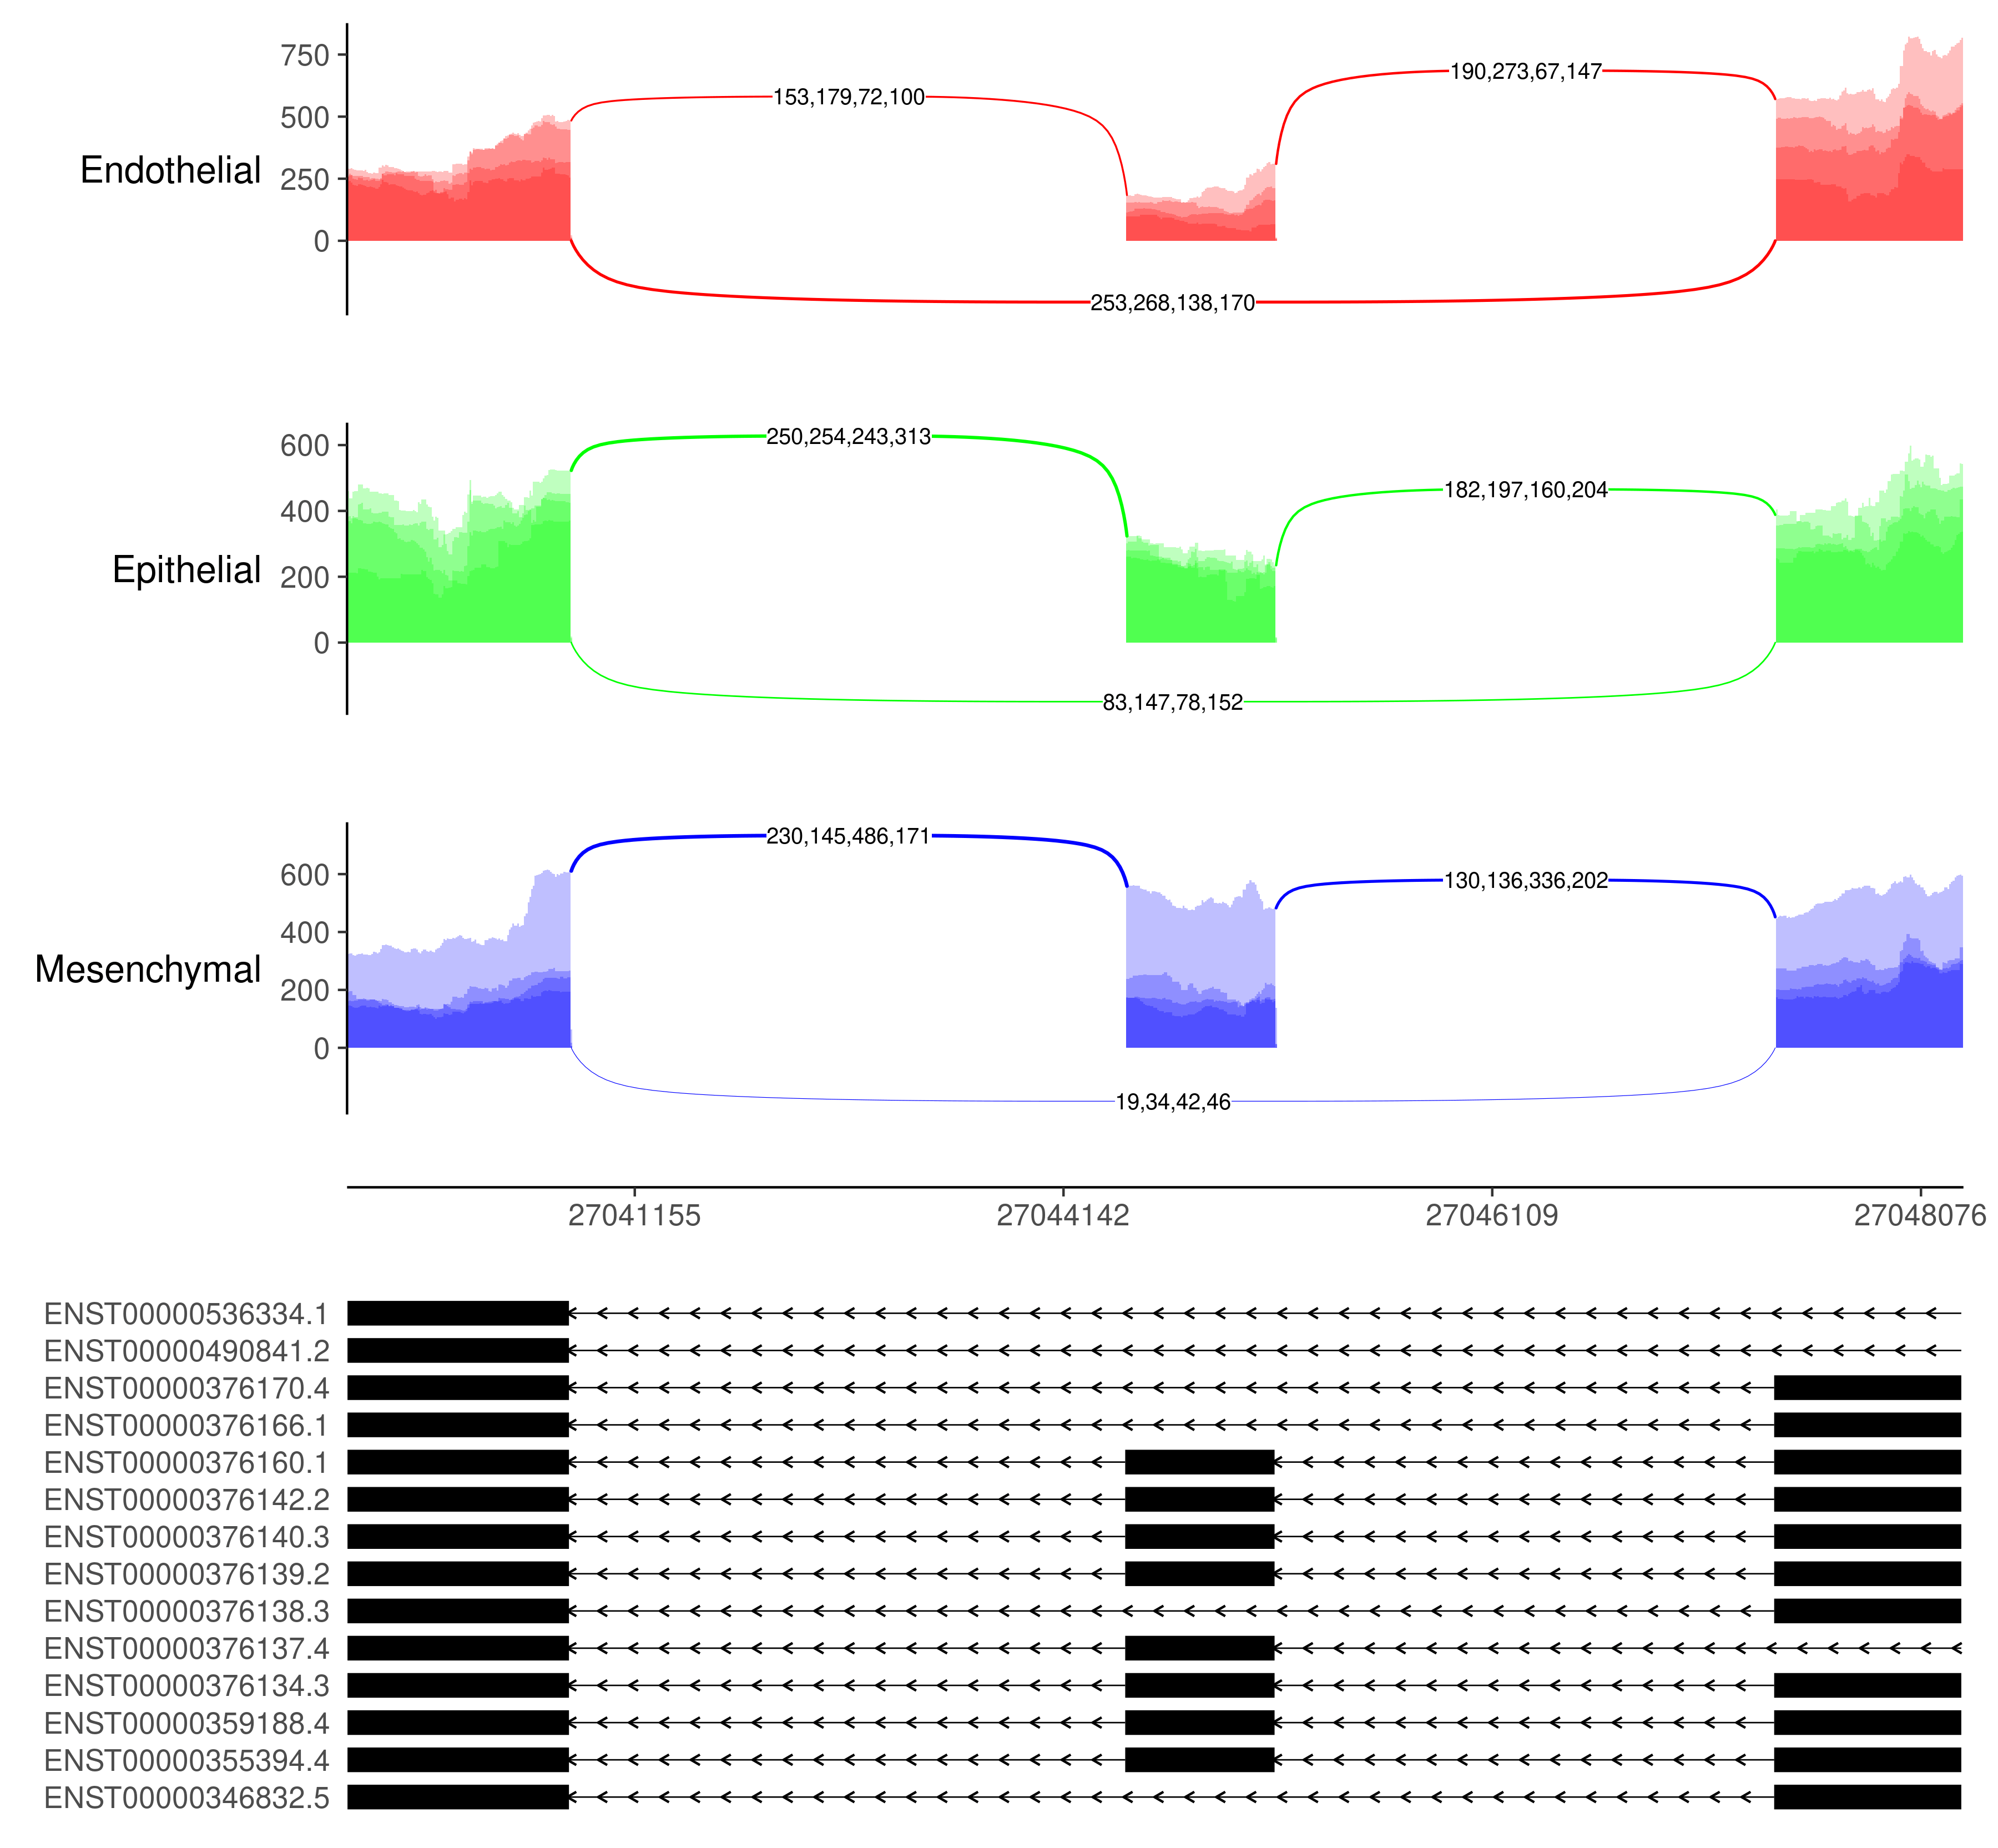
- IsoVis (img)
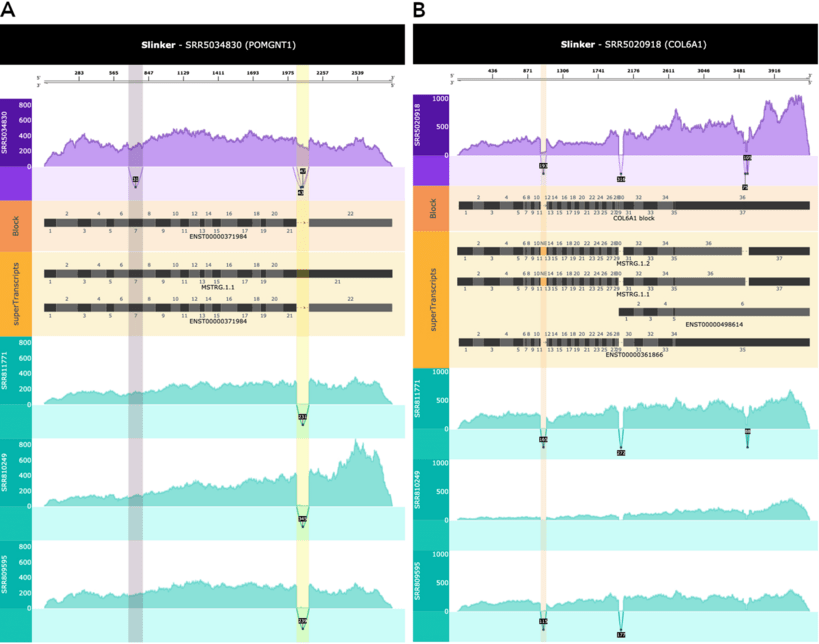
- Slinker (See also, clinker (gene fusion software)) (img)
- Spliceclust (img)
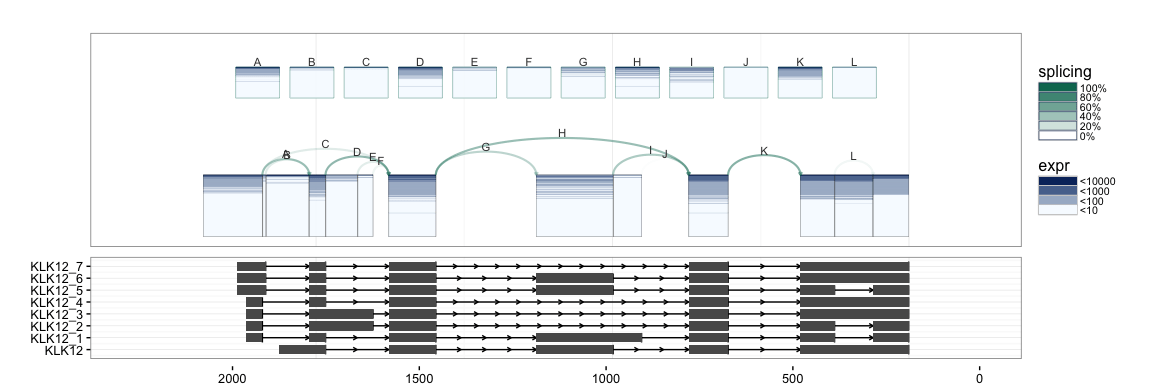
- splicejam (img)
- Vials
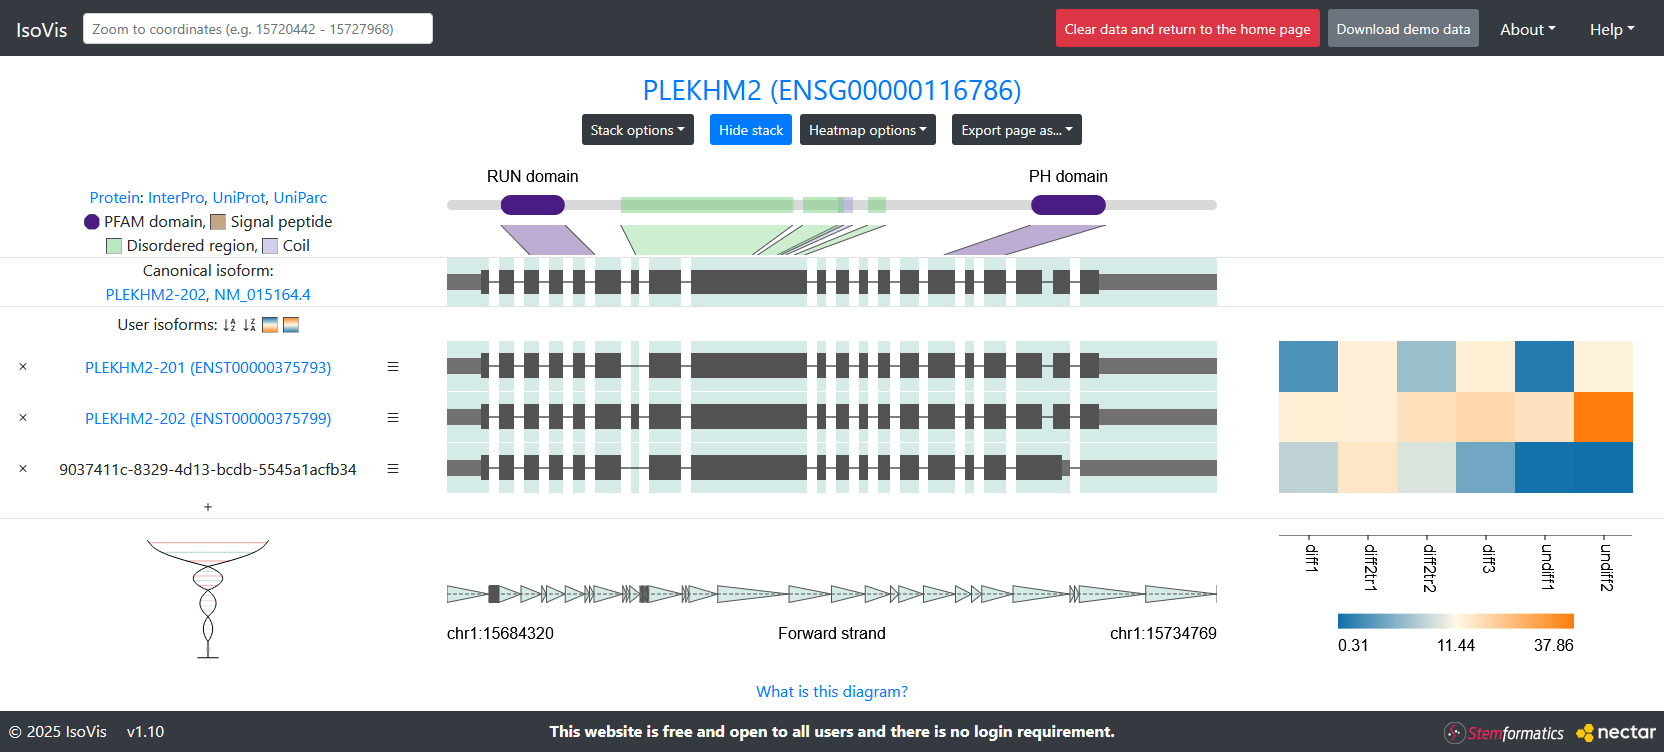
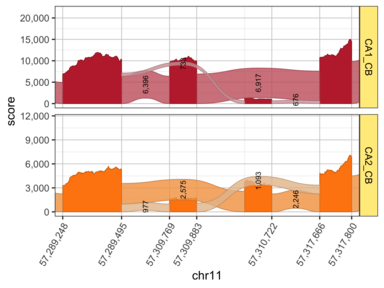
- 10x genomics - Loupe (img)
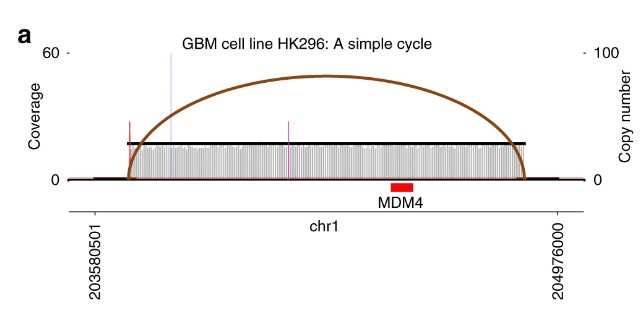
- AmpliconArchitect (The term amplicon refers essentially to extrachromosomal DNA in cancer) (img)
- asgart (img)
- bigly (img)
- Bionano (img)
- CLC Genomics workbench (img)
- Genome STRiP (img)
- GenomeView (img)
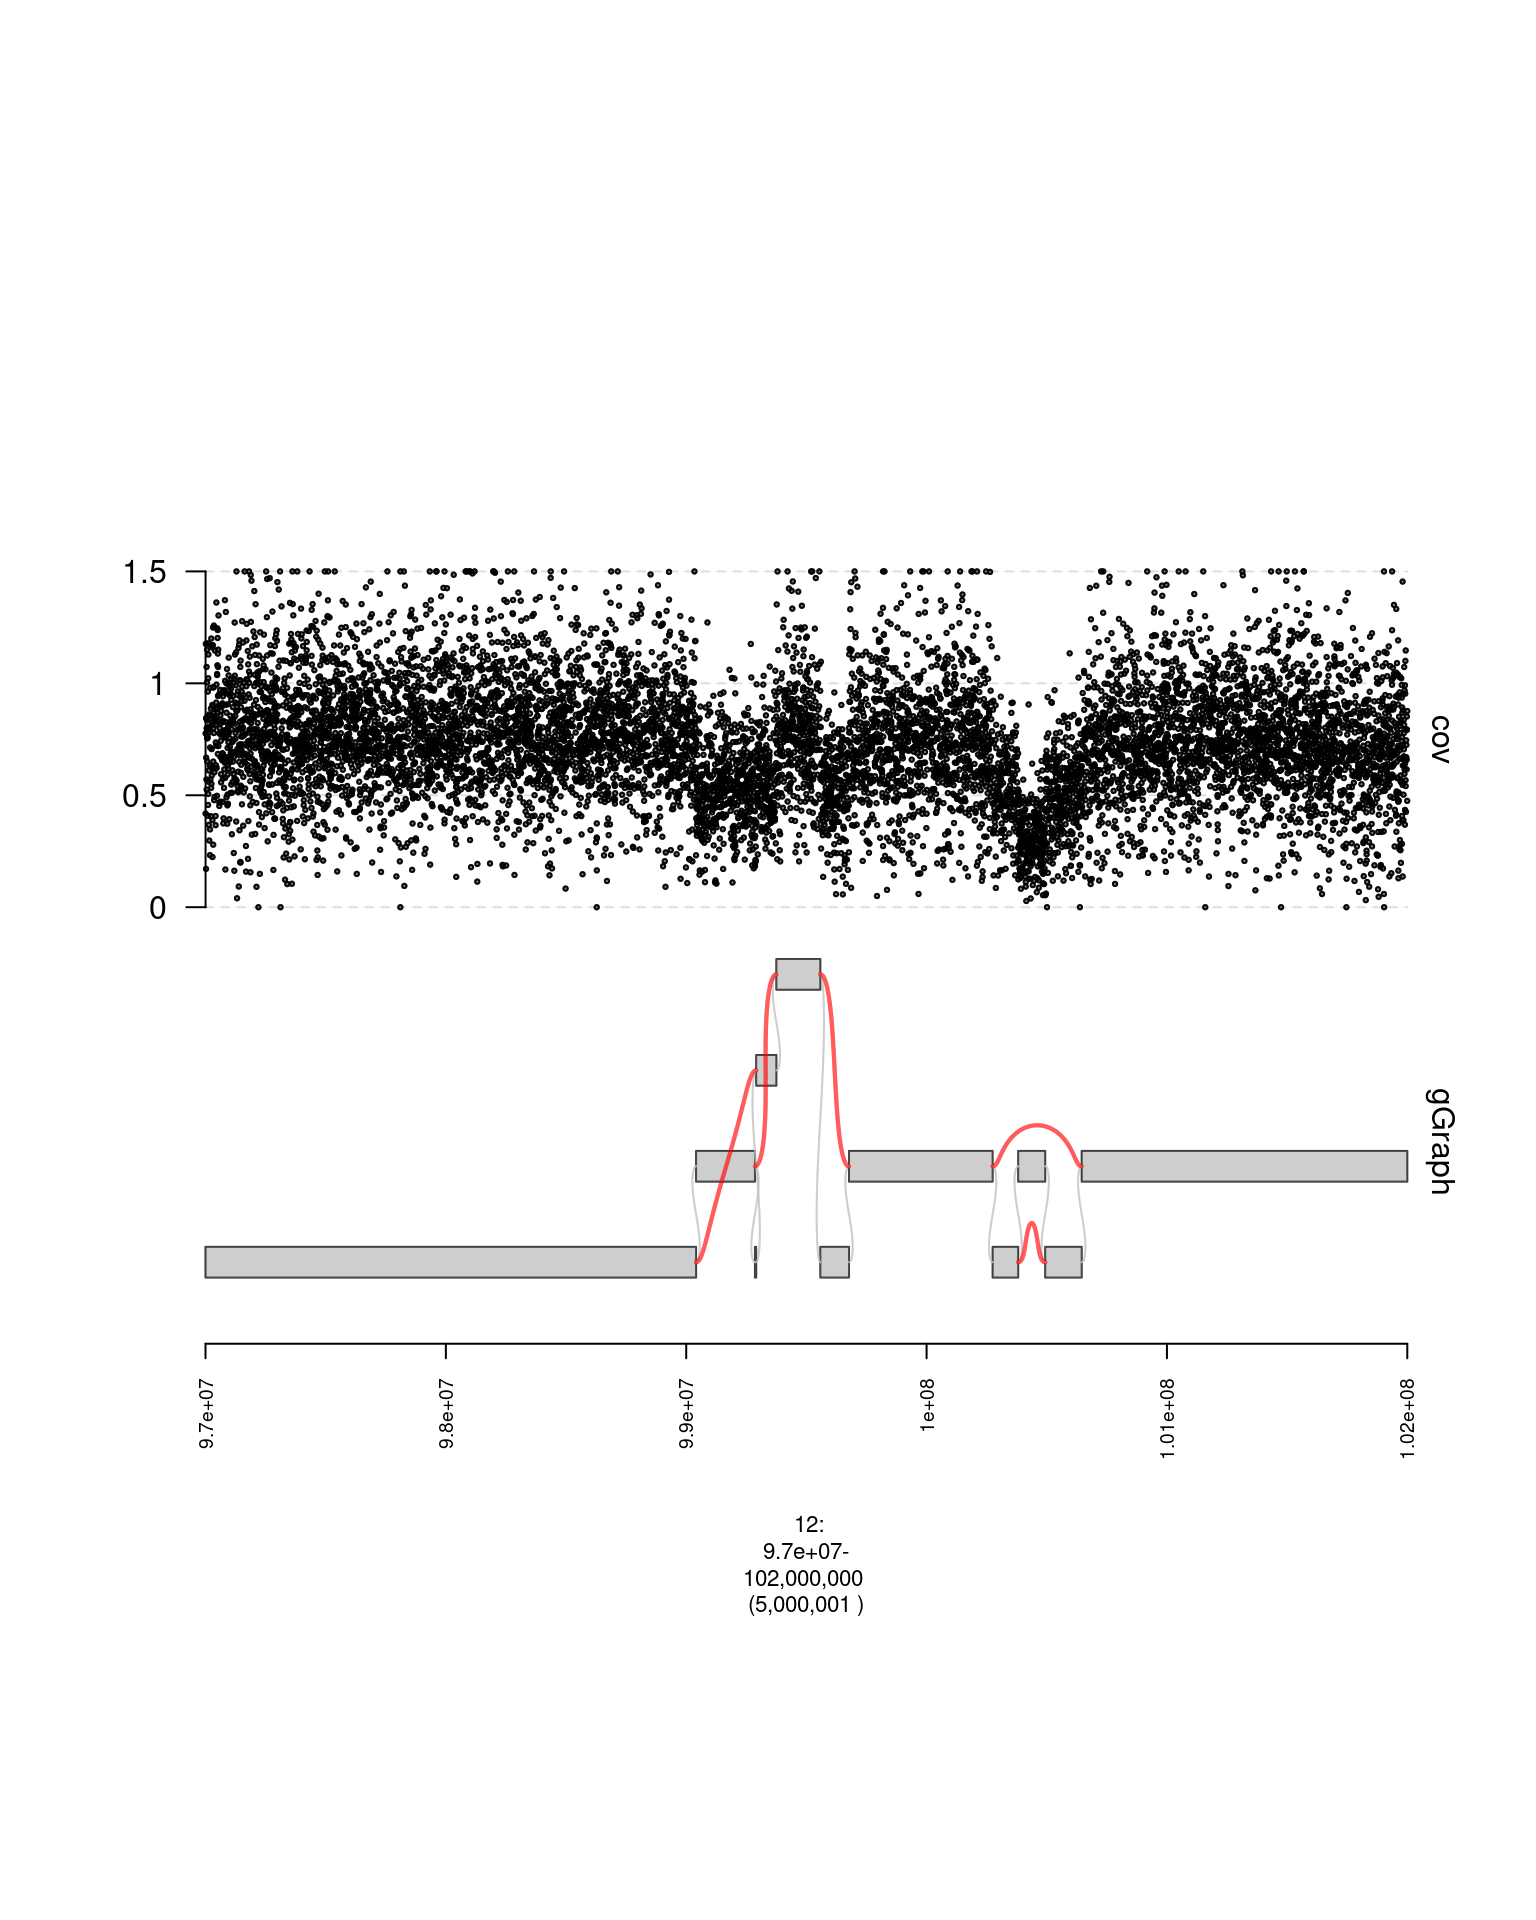
- gGnomes (img)
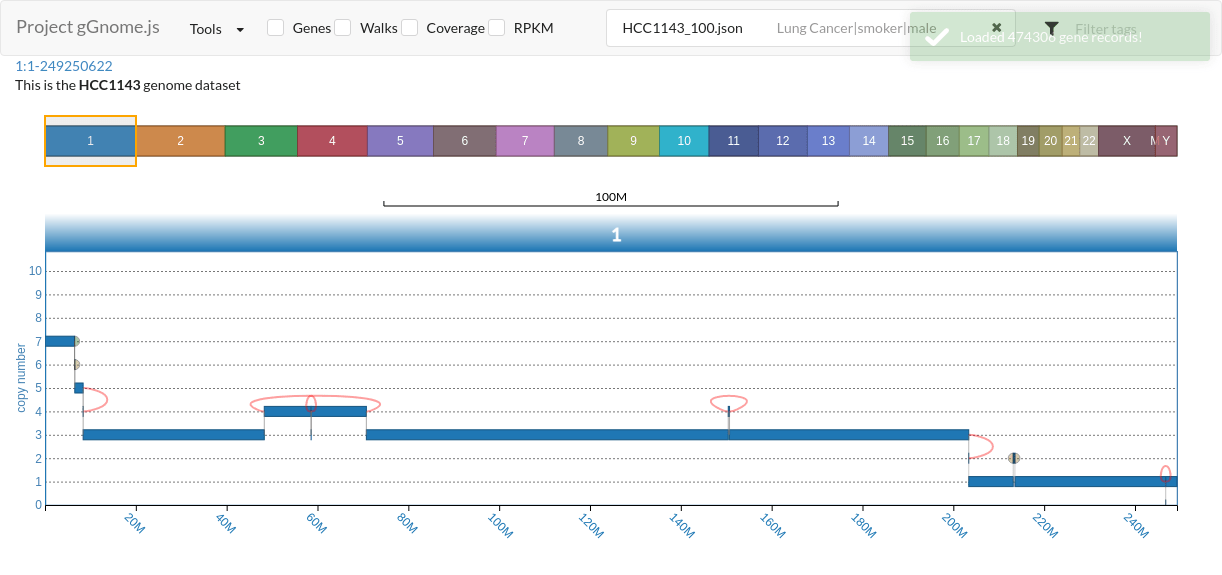
- gGnomes.js (img)
- Gremlin (img)
- InGAP-SV (img)
- Introgression browser (img)
- LINX (part of the PURPLE/GRIDSS/LINX pipeline) (img)
- NeoLoopFinder (img)
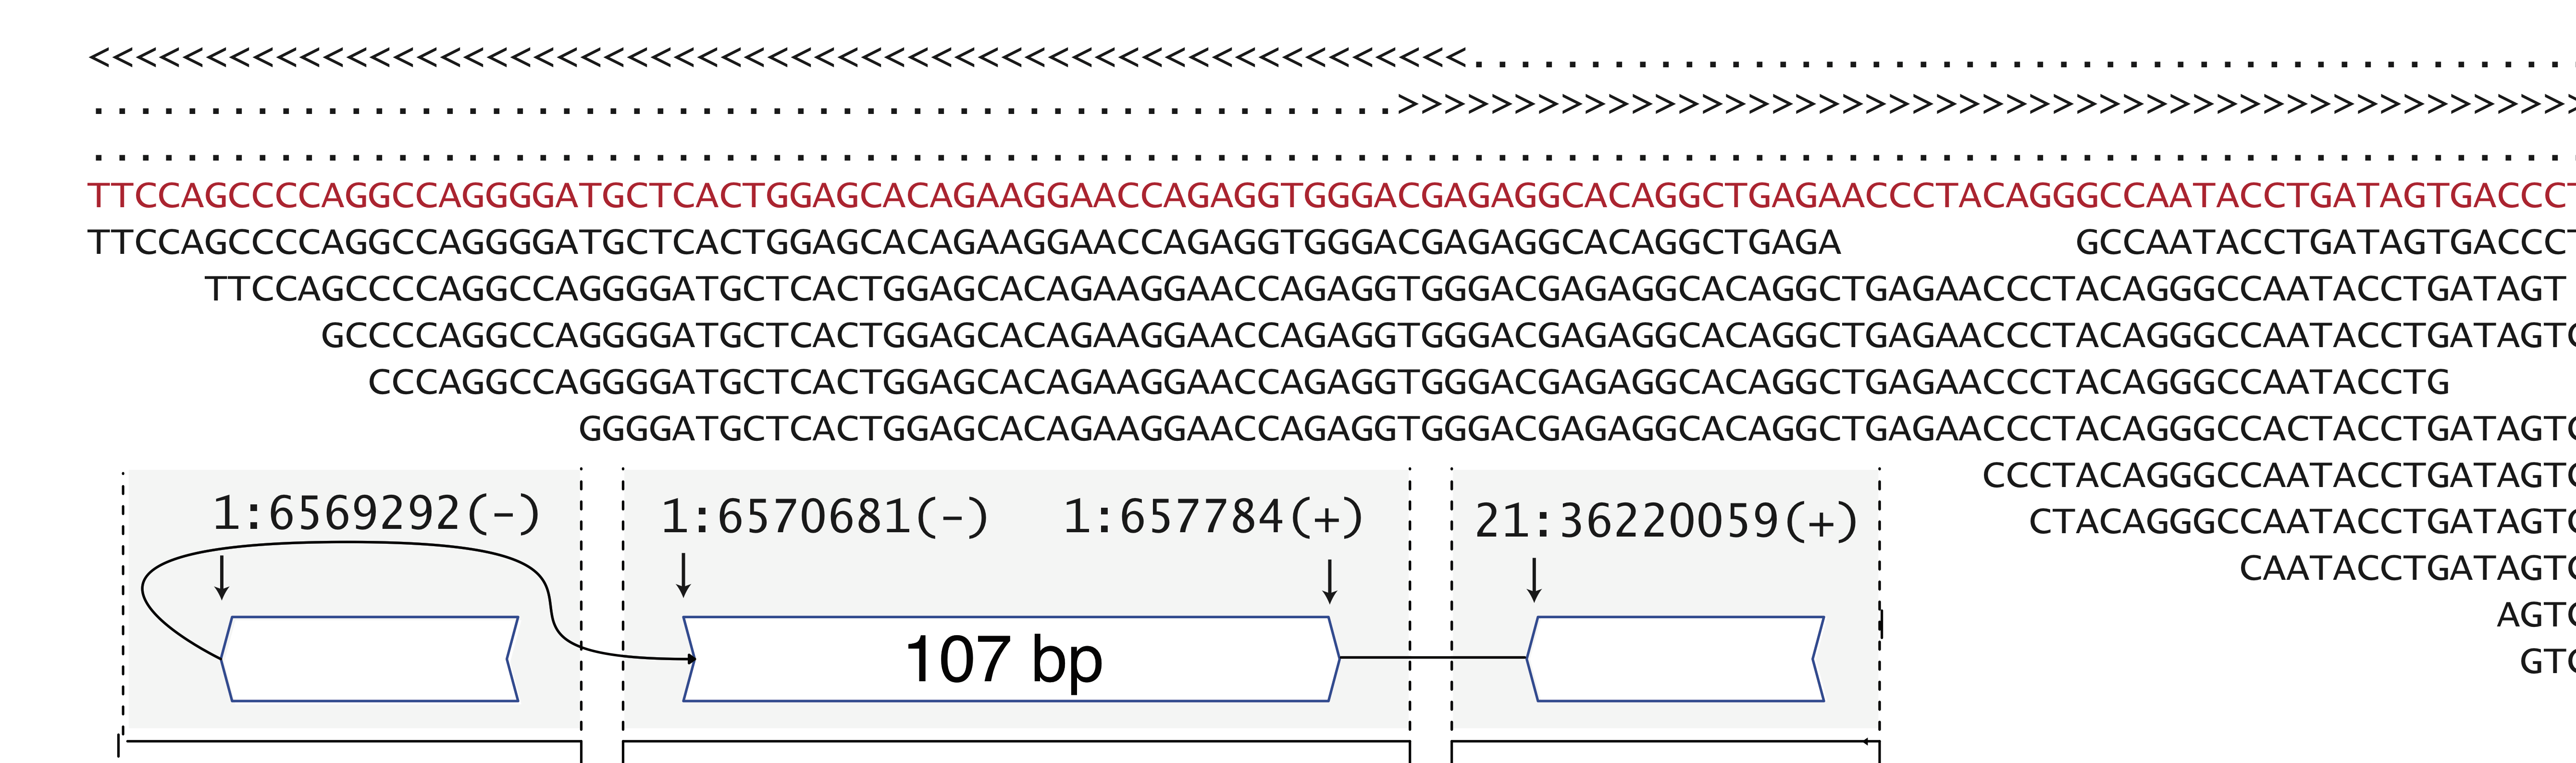
- Pairoscope (img)
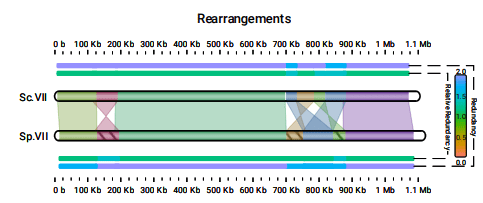
- plotsr (see also https://github.com/schneebergerlab/syri) (img)
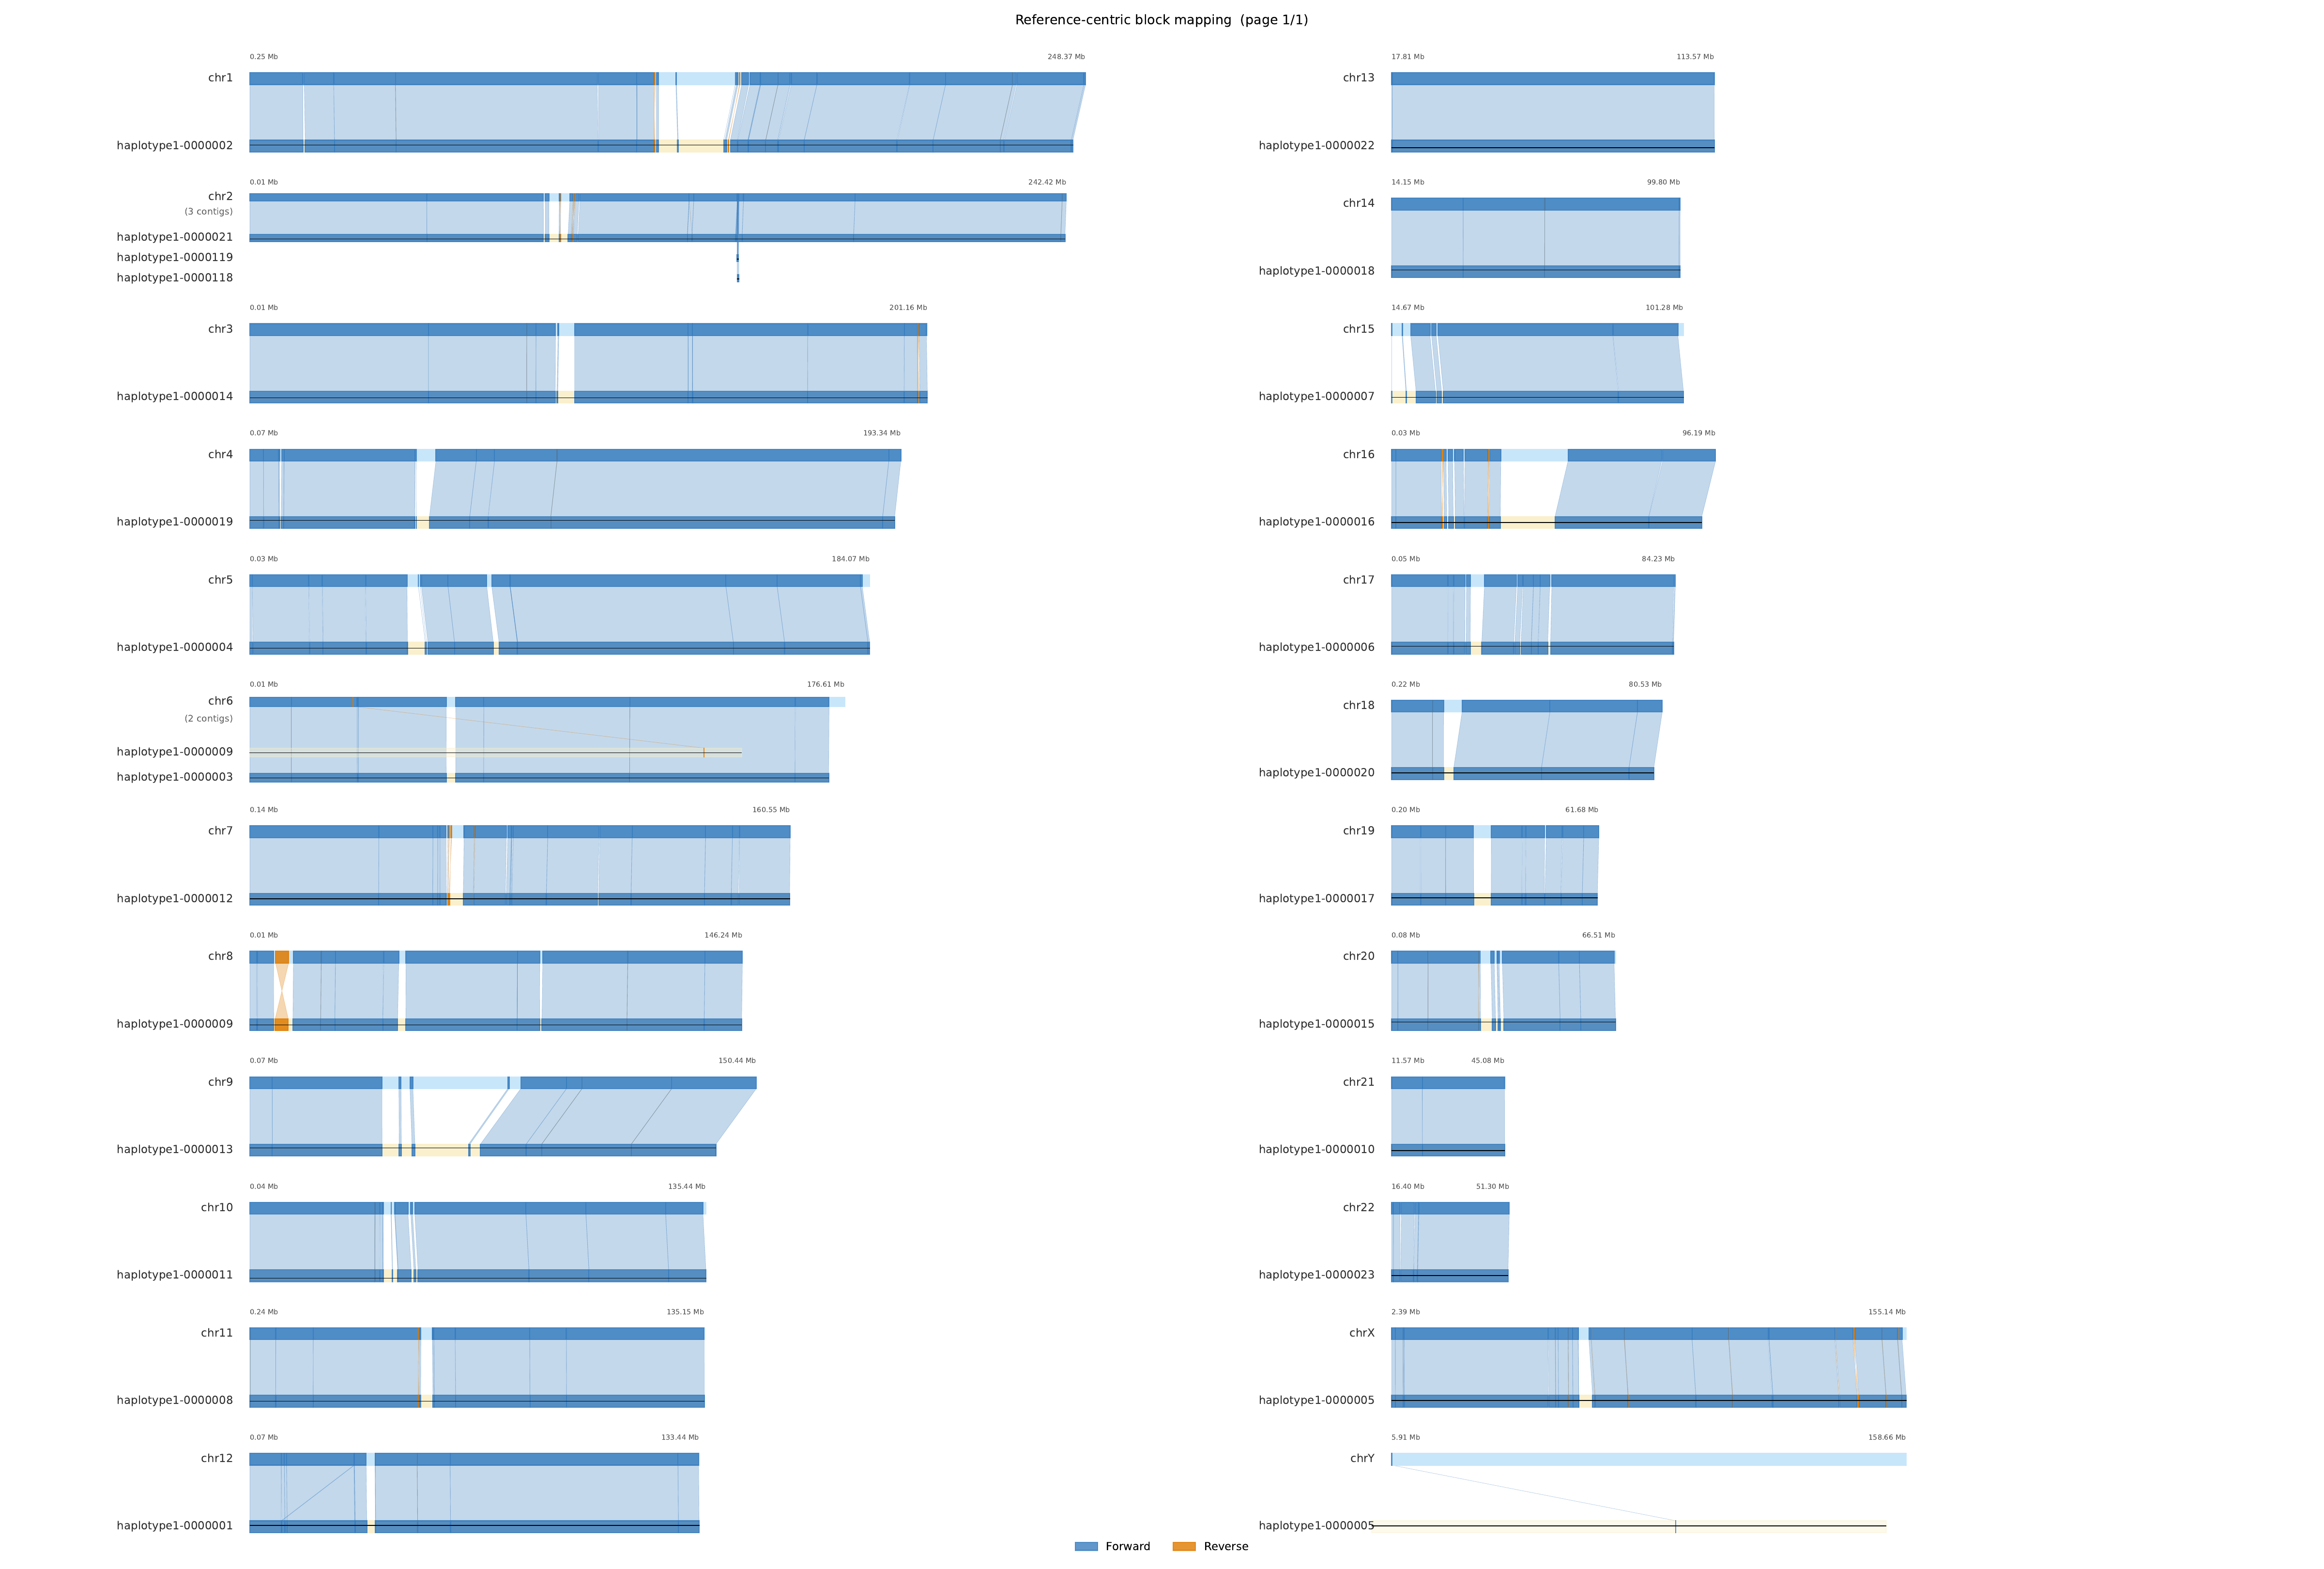
- QUAAK (Quick Unique k-mer Assembly Assessment Kit. Uses unique k-mers to compare reference and query genomes, building synteny blocks to assess assembly completeness and flag large structural variations. Outputs reference-centric block-mapping plots. Sample image from https://s3-us-west-2.amazonaws.com/human-pangenomics/index.html?prefix=submissions/76E3F239-A9A6-4B6B-840F-B49053807394--R3_verkko-v2.3.2_hybrid_assembly_qc/HG00146/quaak/) (img)
- ReConPlot (img)
- Ribbon (img)
- Samplot (img)
- SMRT View (wiki page https://github.com/PacificBiosciences/DevNet/wiki/SMRT-View) (img)
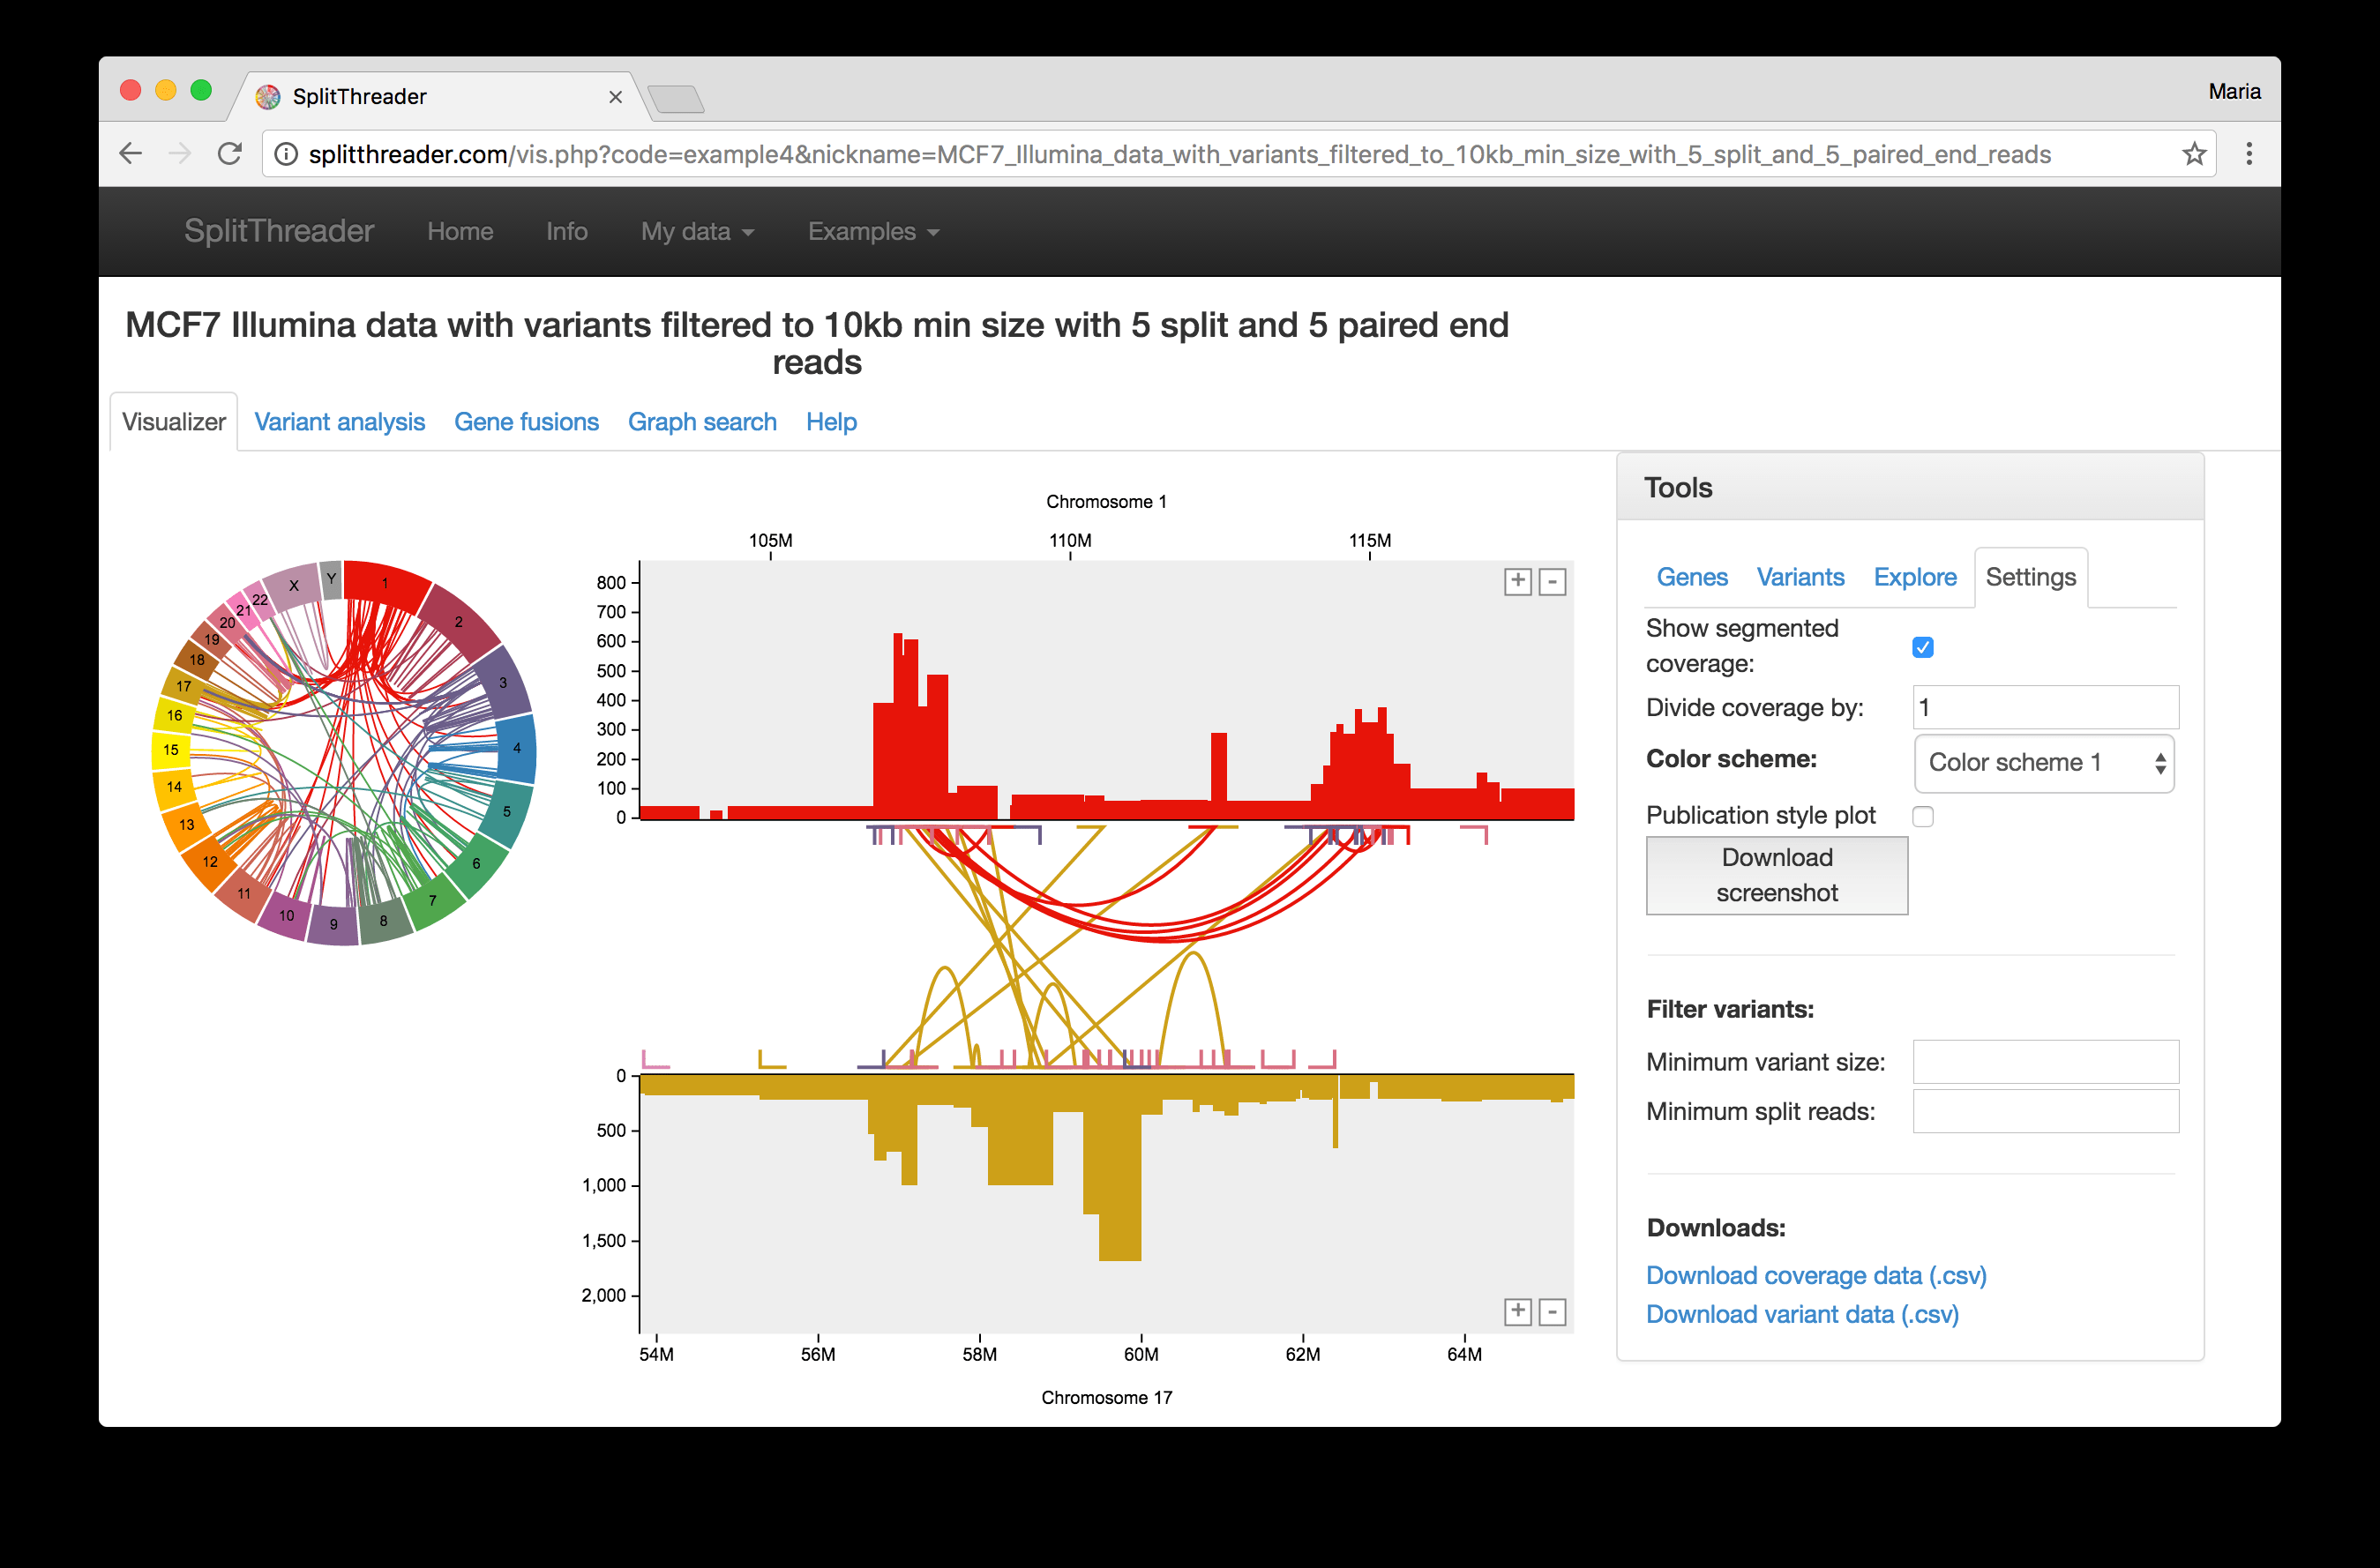
- SplitThreader (img)
- SvABA (img)
- SVhawkeye (img)
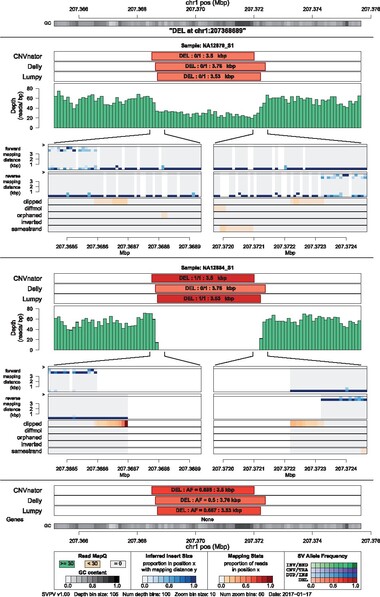
- SVPV (img)
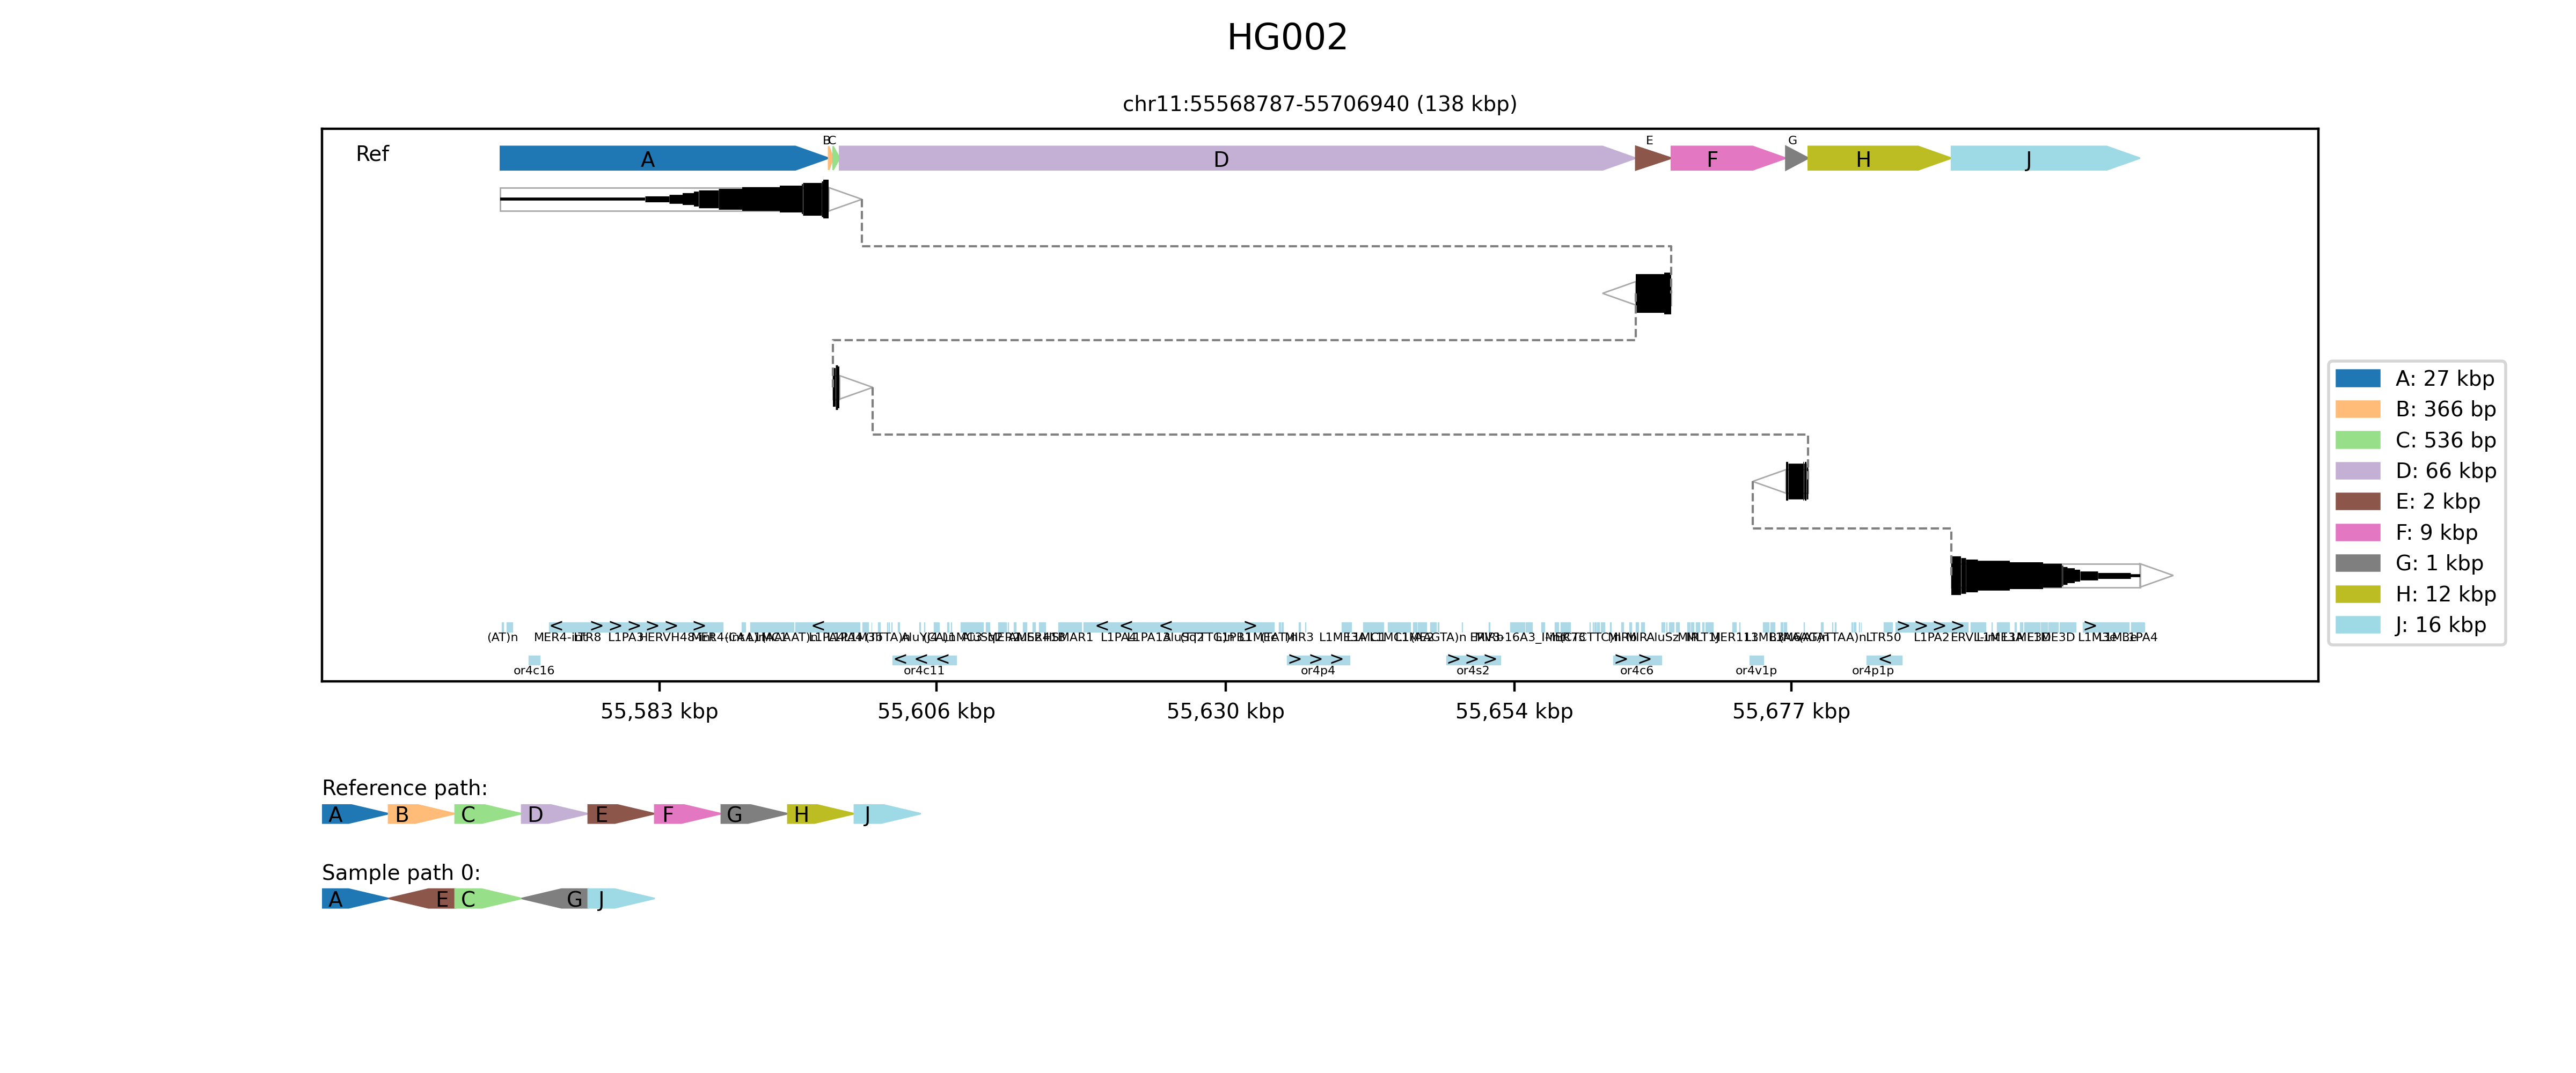
- SVTopo (img)
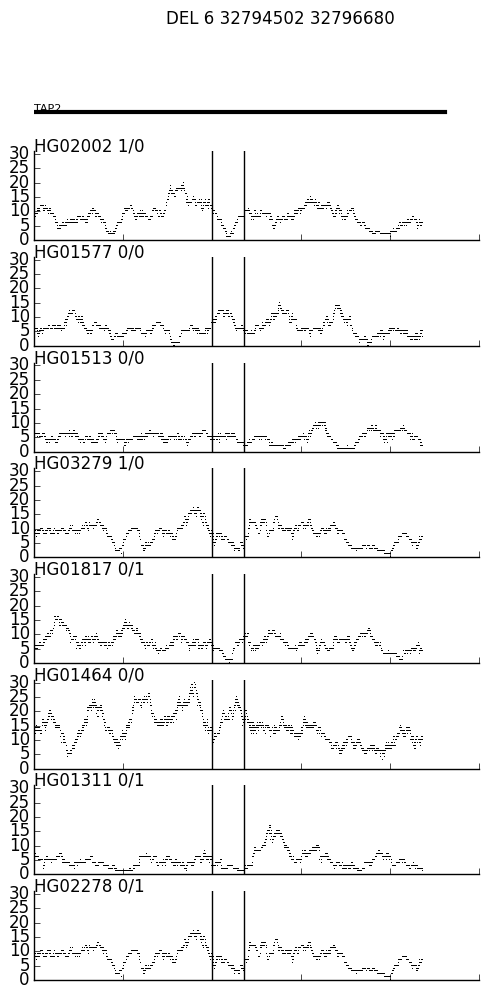
- svv (img)
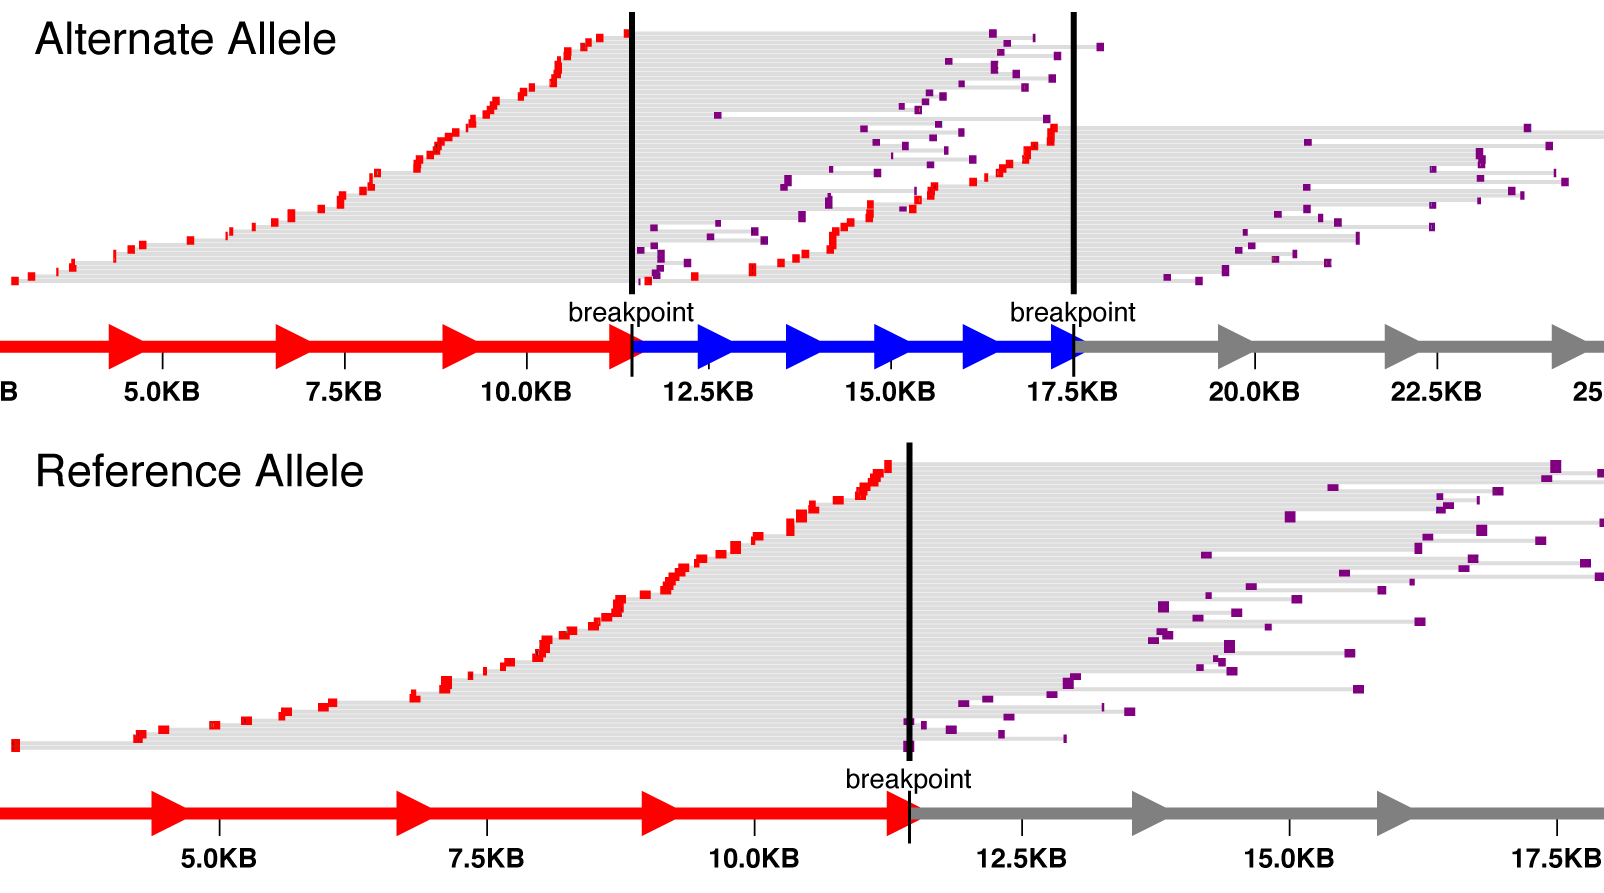
- svviz (img)
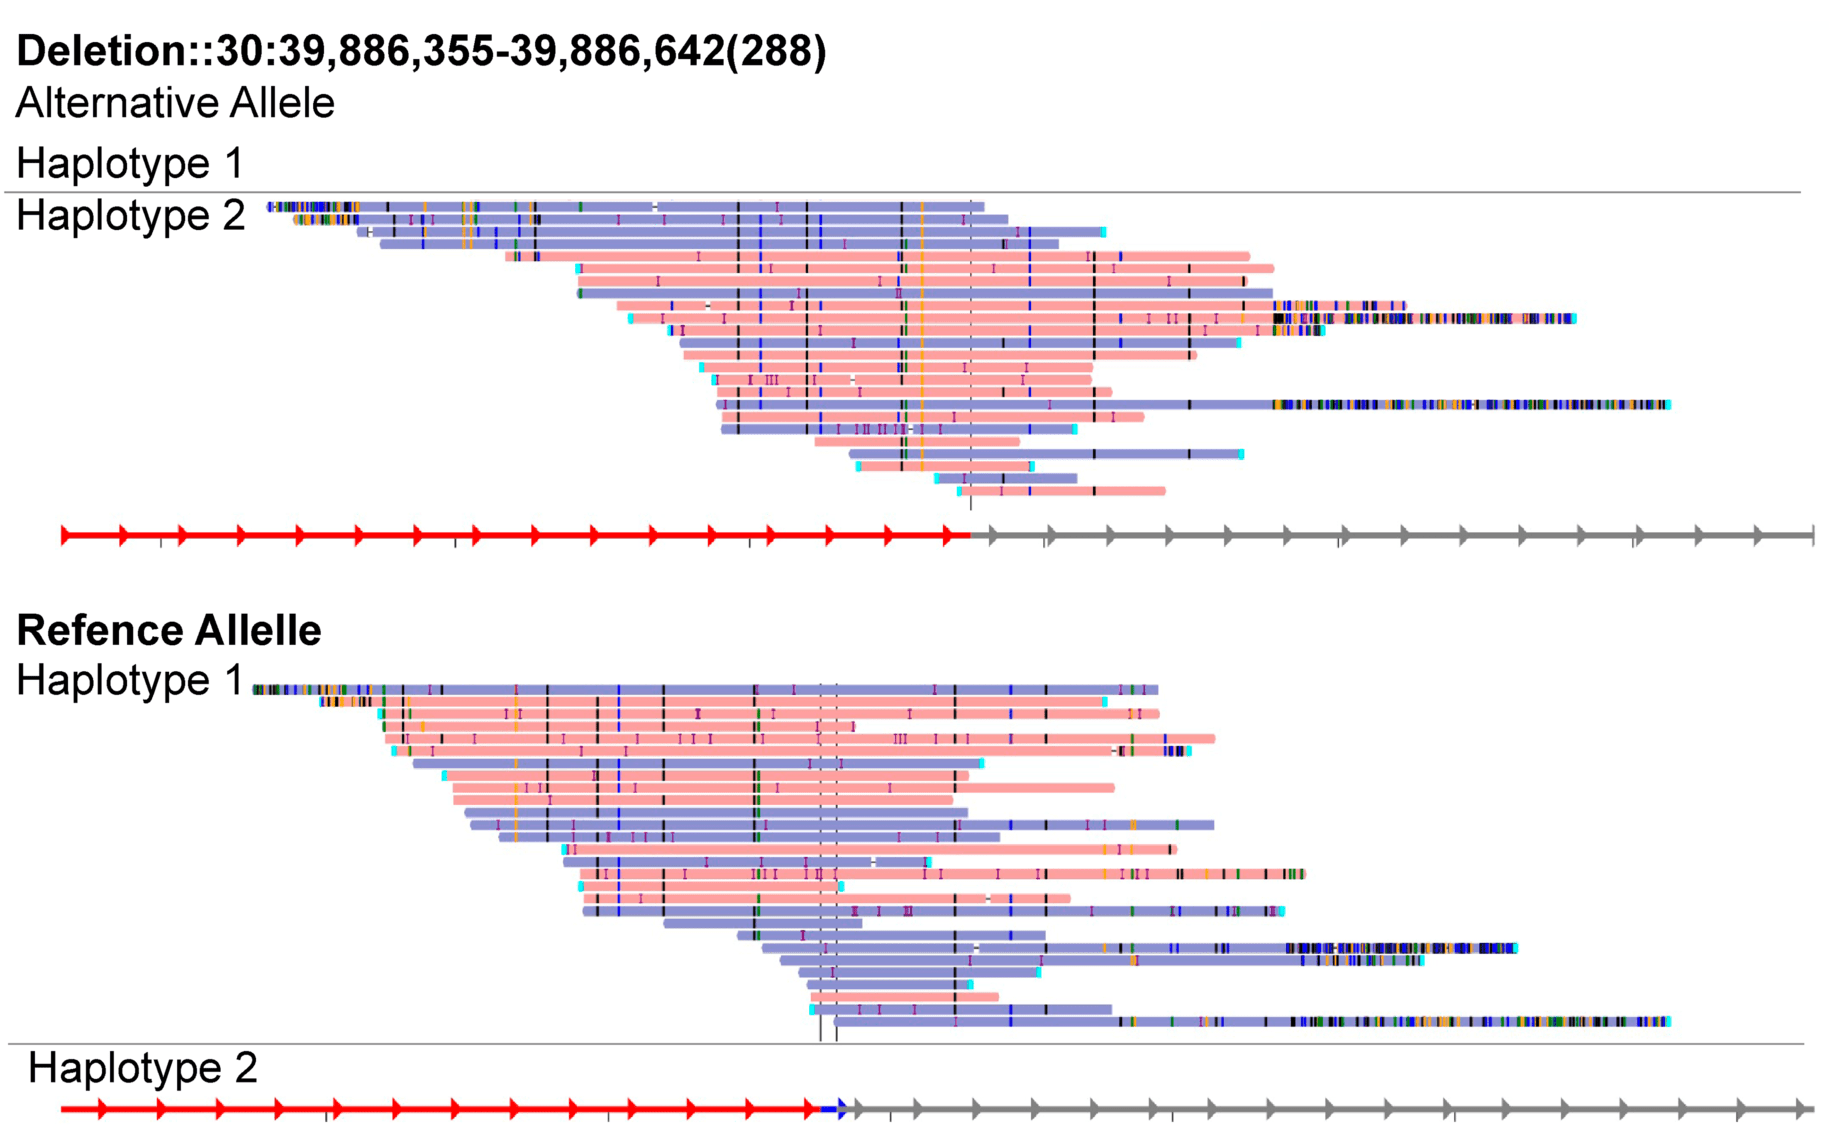
- svviz2 (img)
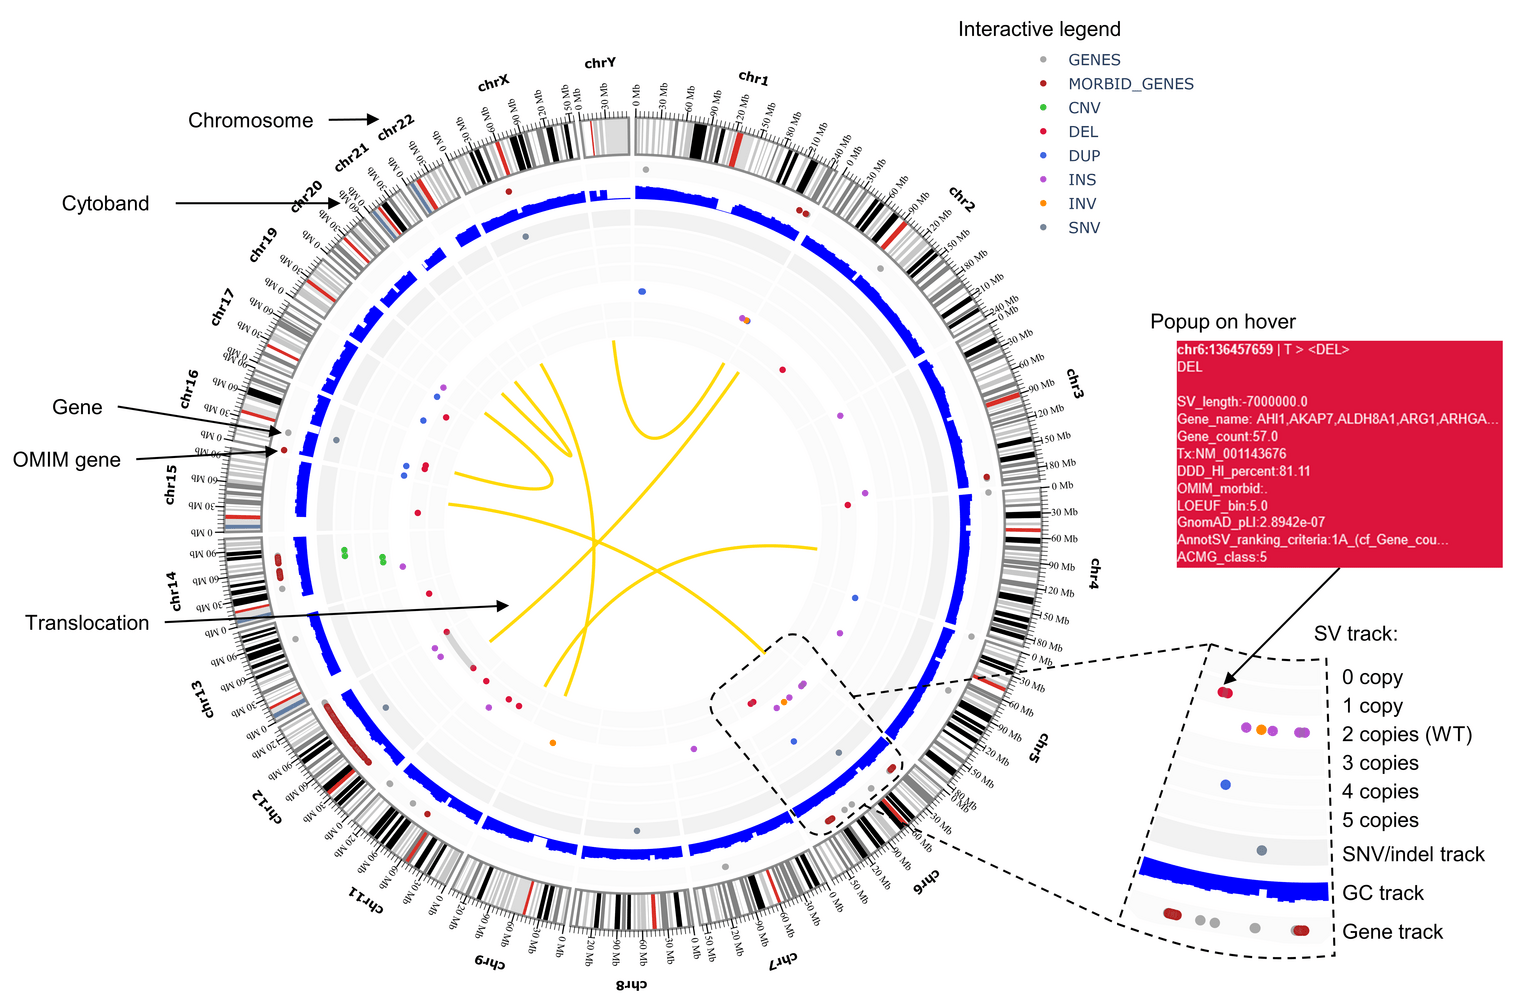
- vcf2circos (Based on PCircos https://github.com/CJinny/PCircos) (img)

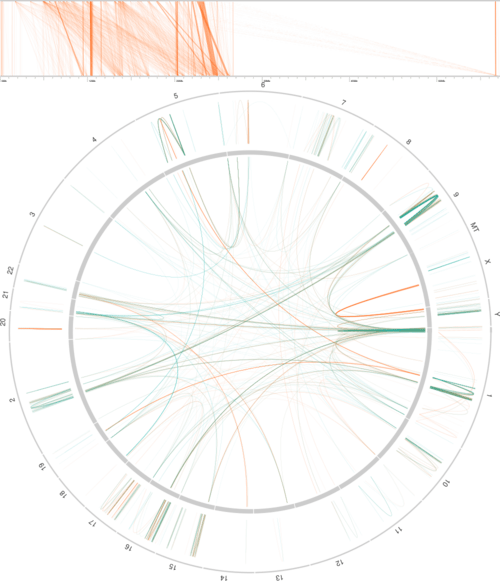
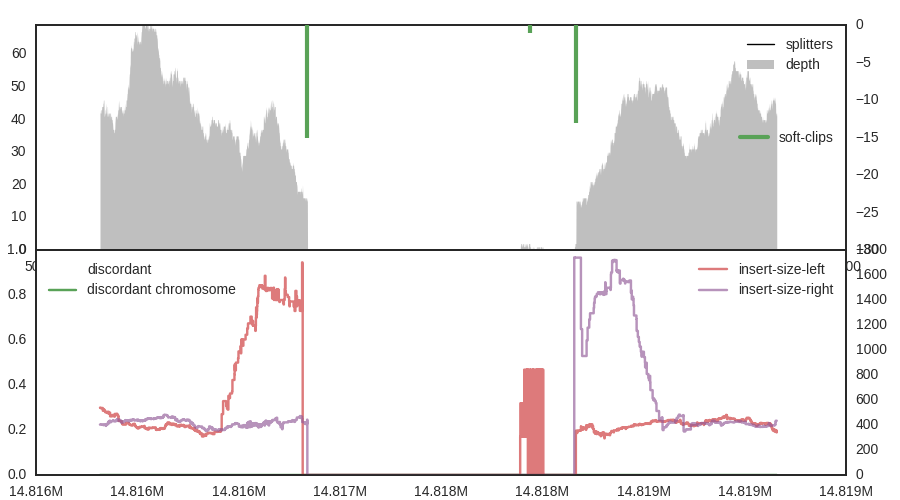
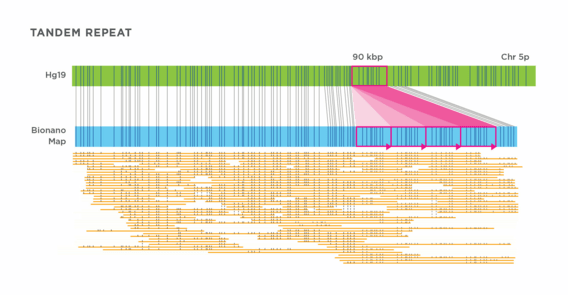
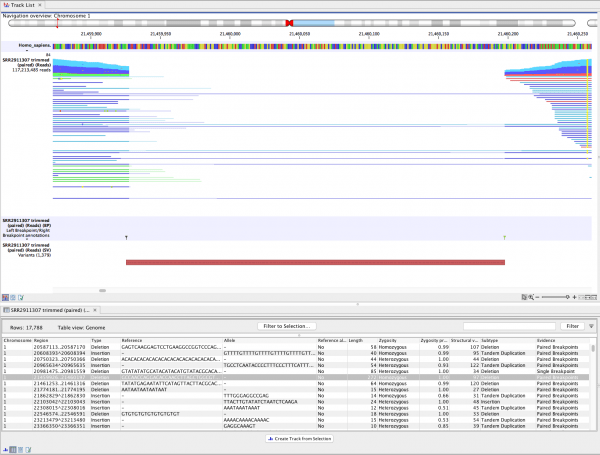
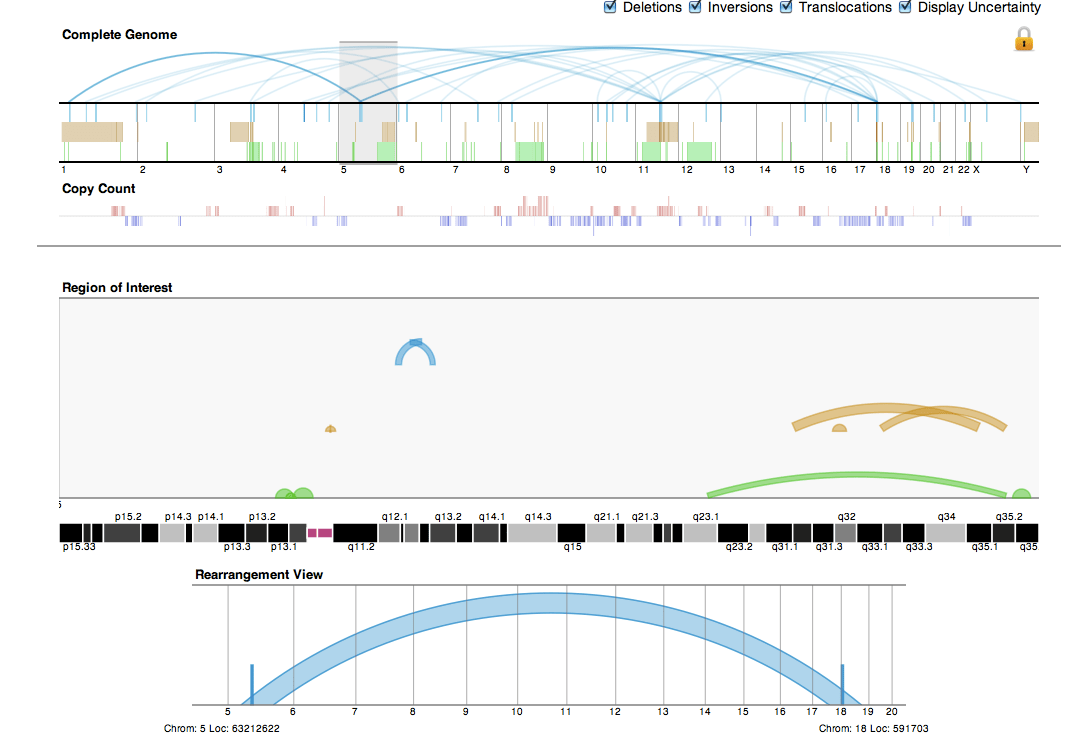
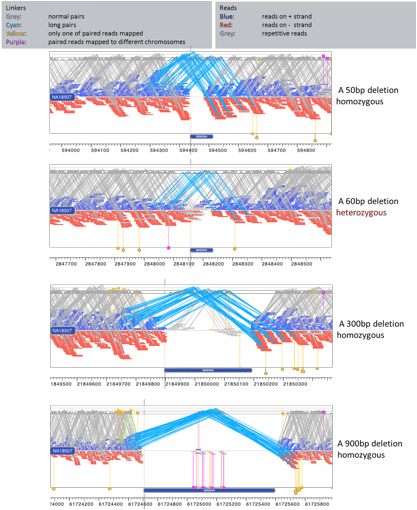
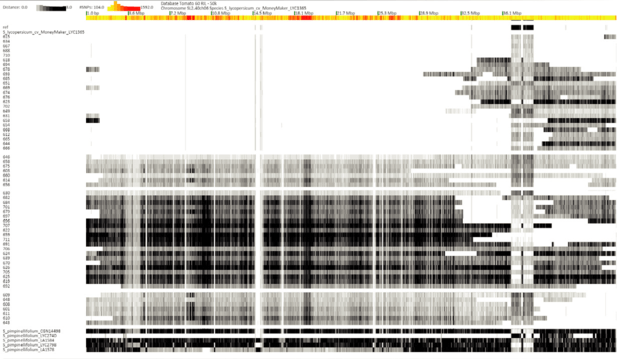
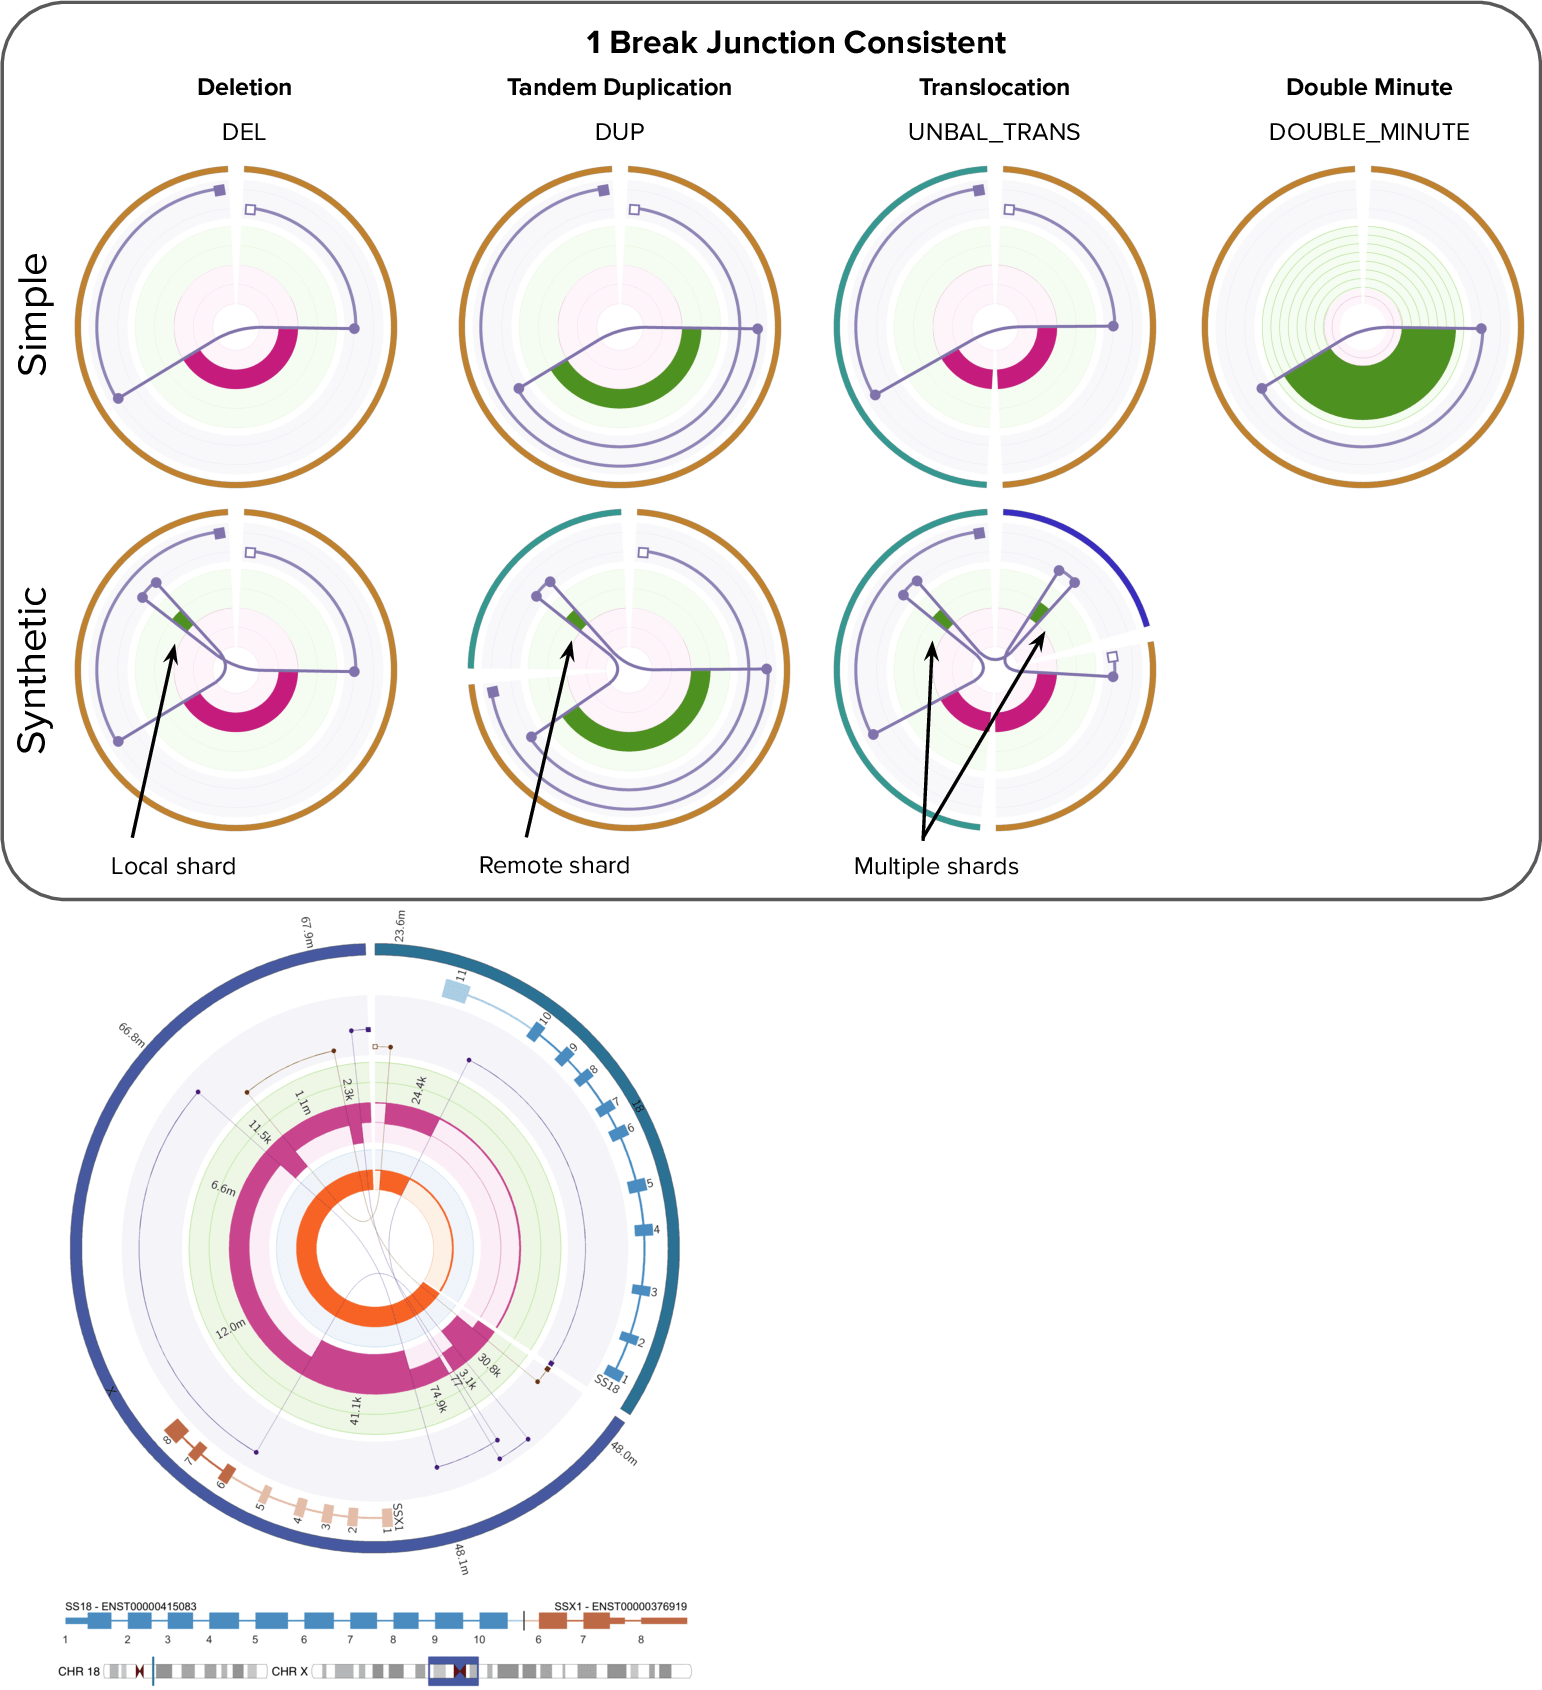
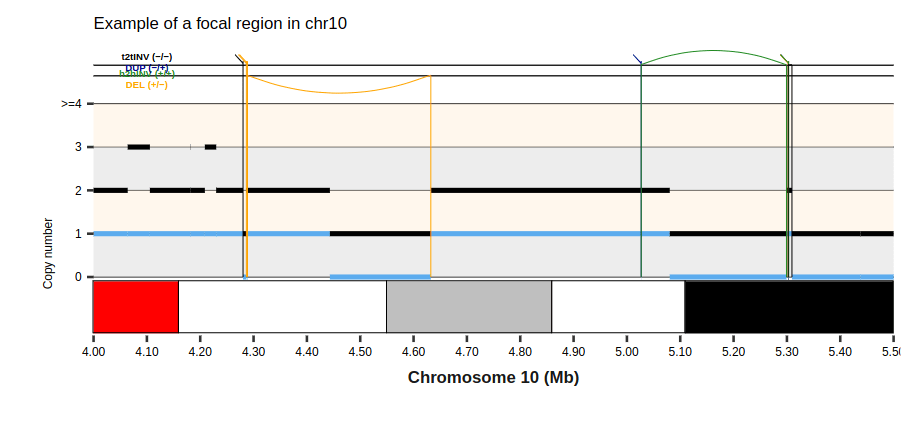
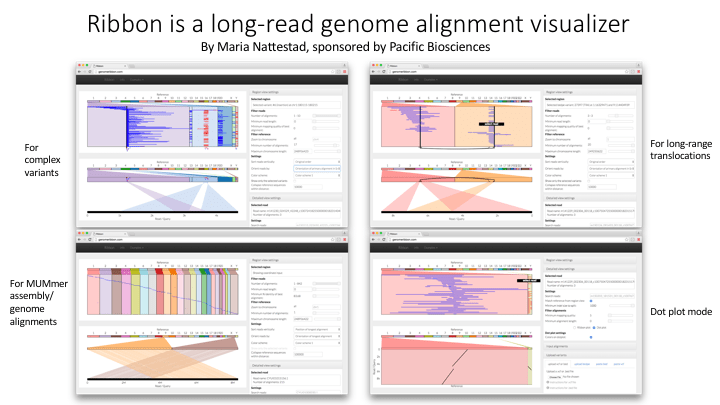
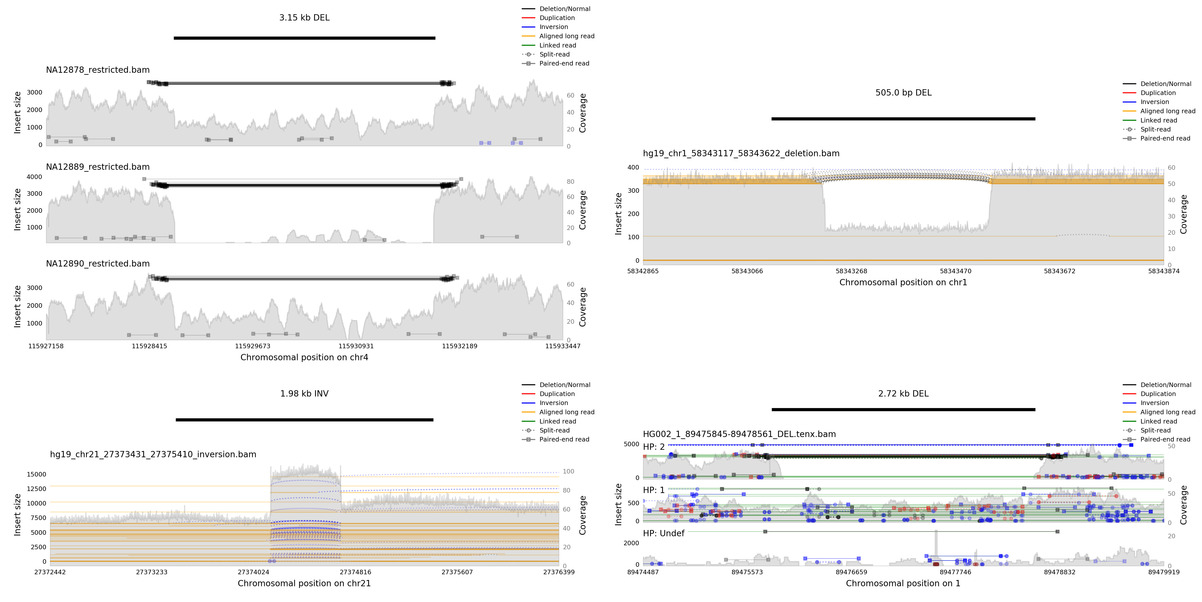
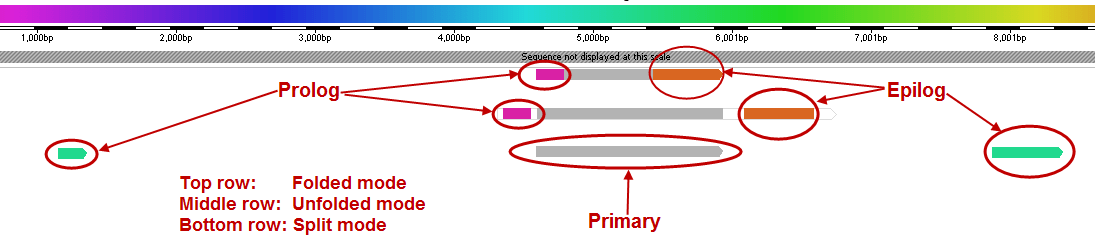

- AccuSyn (img)
- Aequatus (img)
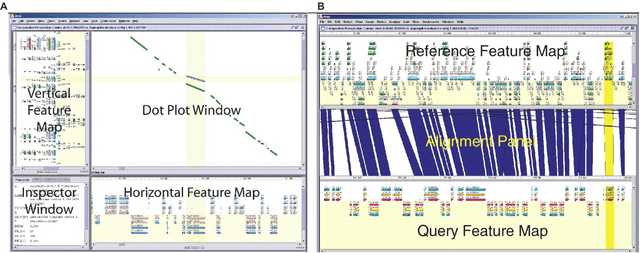
- Artemis comparison tool (ACT) (img)
- AutoGraph (img)
- Cinteny (img)
- CrowsNest (img)
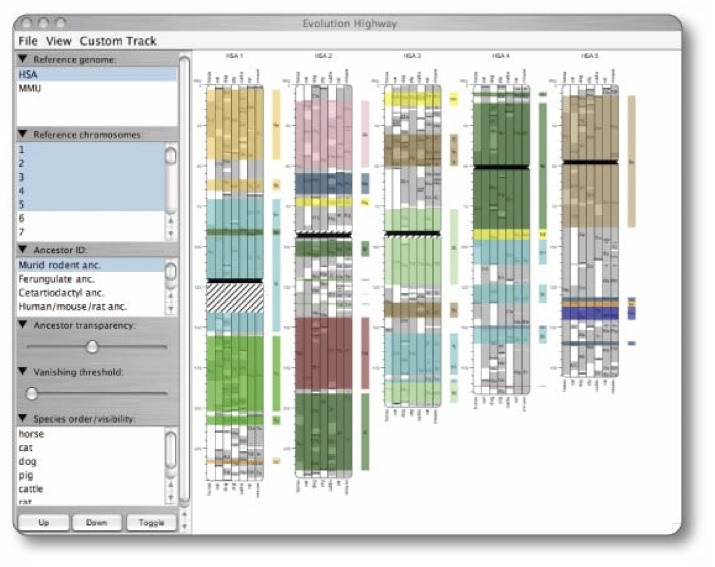
- EvolutionHighway (The 'evolutionary highway' image type is reproduced in some other packages e.g. https://github.com/marta-fb/syntenyPlotteR, paper https://doi.org/10.1126/science.1111387) (img)
- GBrowse_syn (img)
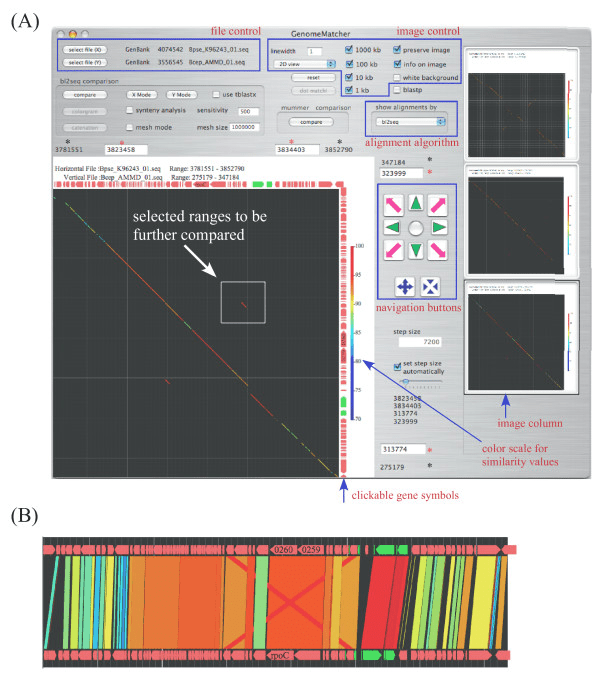
- GenomeMatcher (img)
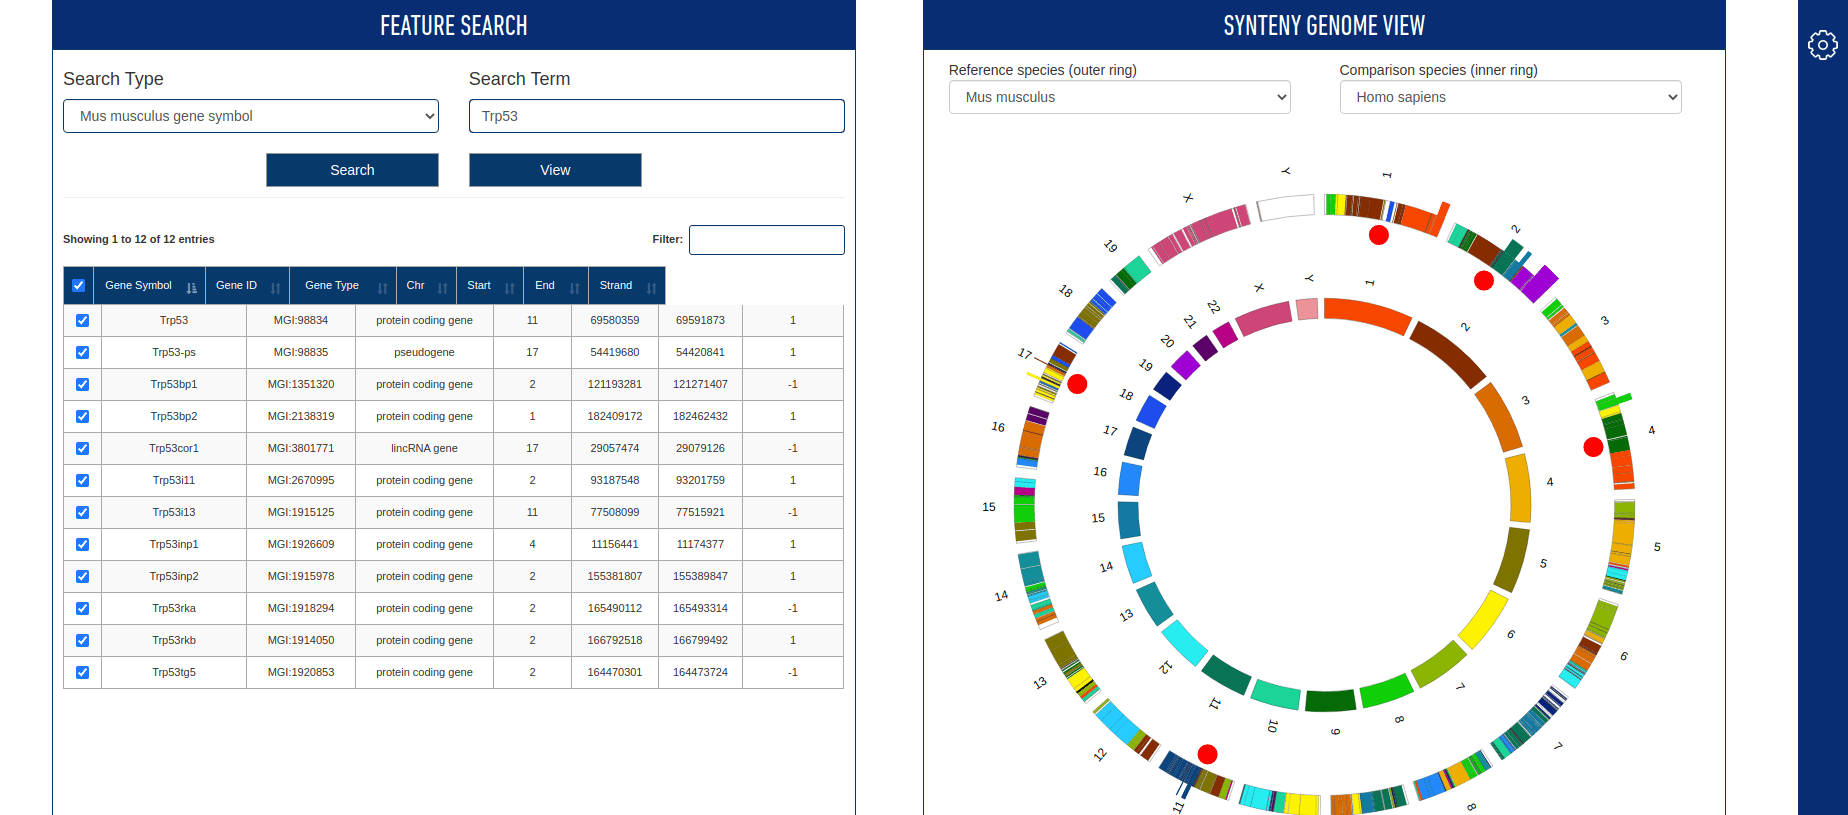
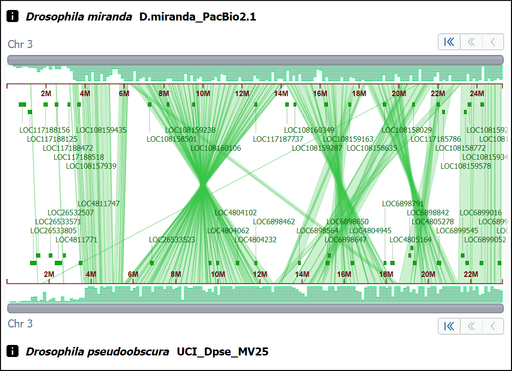
- JAX Synteny browser (img)
- MCScanX (img)
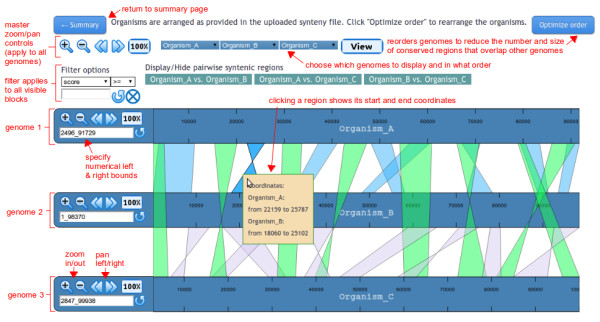
- mGSV (multiple genome synteny viewer) (img)
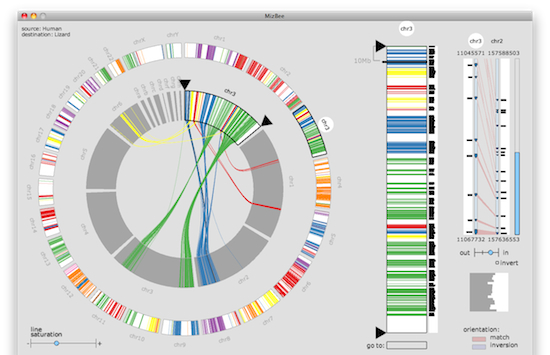
- MizBee (img)
- NCBI CGV (img)
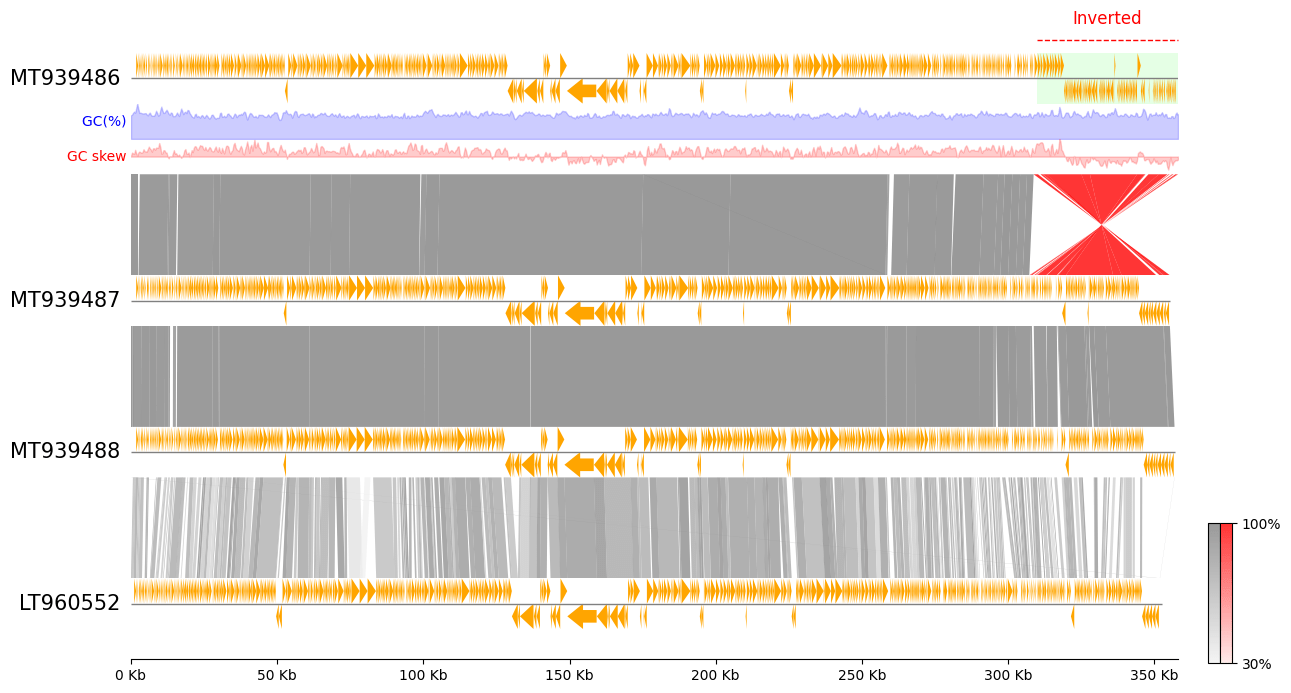
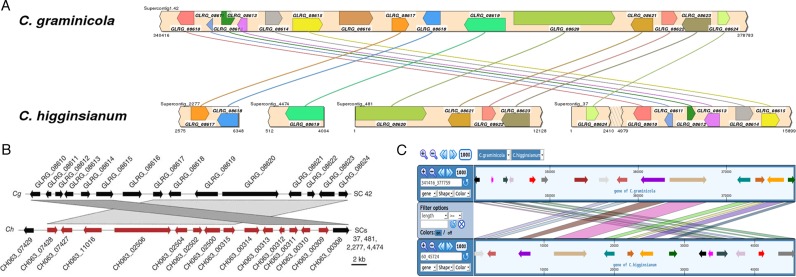
- pyGenomeViz (See also https://github.com/moshi4/MGCplotter https://github.com/moshi4/GBKviz https://github.com/moshi4/plot_genome_align_fig) (img)
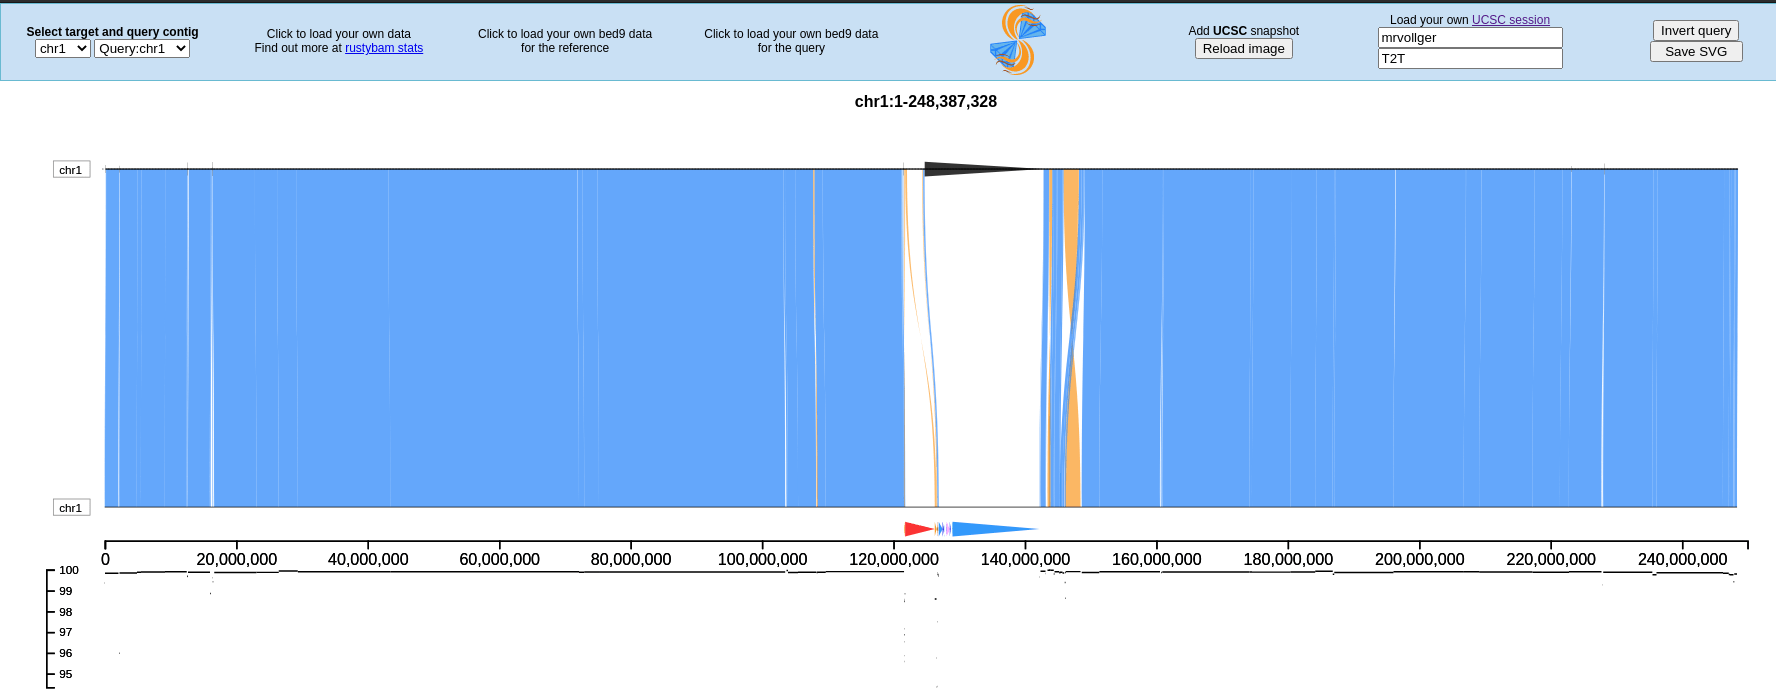
- SafFire (img)
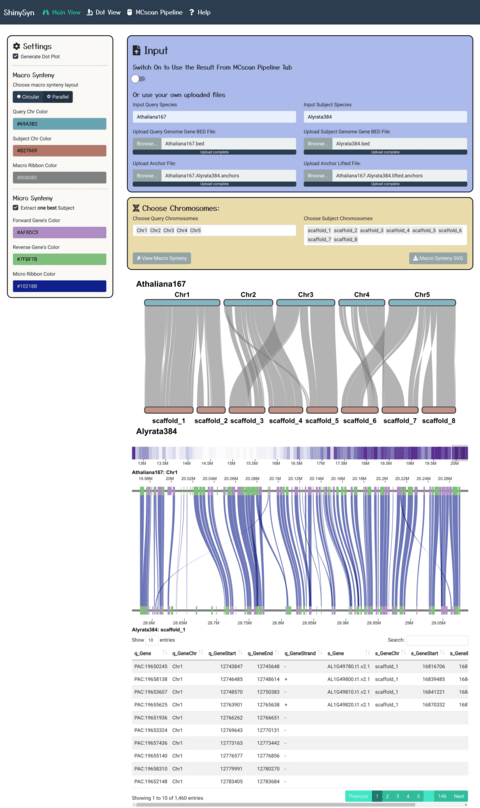
- ShinySyn (img)
- SimpleSynteny (img)
- Smash++ (img)
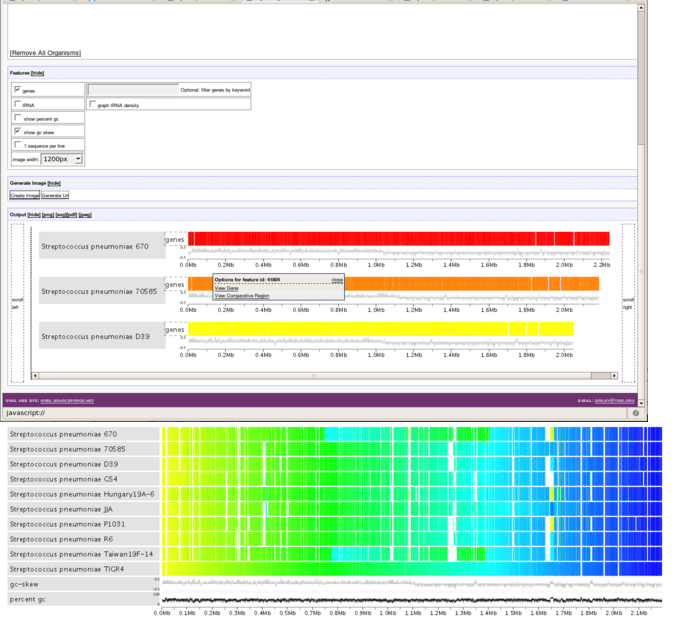
- Sybil (Download https://sourceforge.net/projects/sybil/) (img)
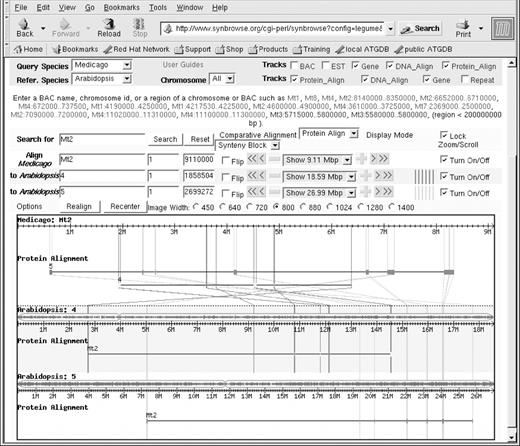
- SynBrowse (img)
- Synima (img)
- syntenyPlotteR (img)
- XMatchView (img)
- ziplign (ACT (Artemis Comparison Tool) replacement) (img)
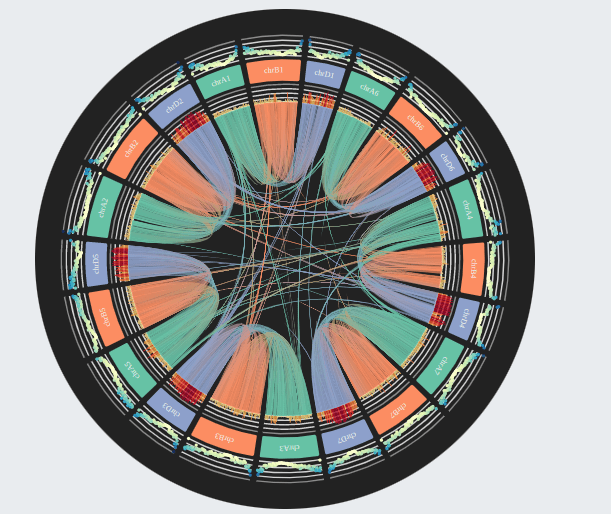
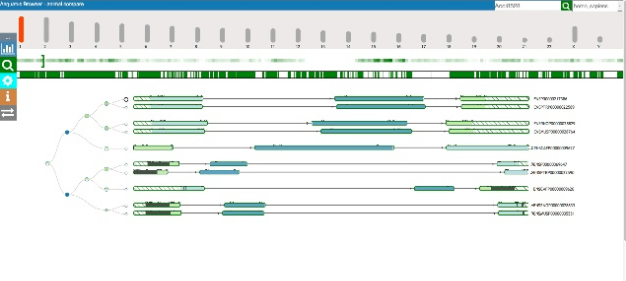
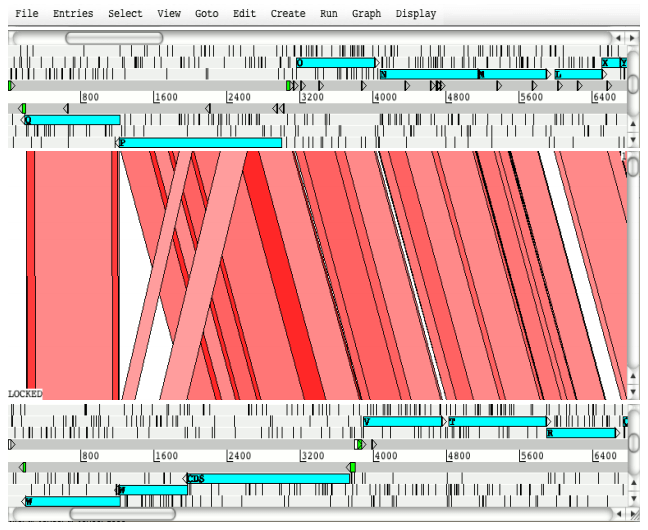
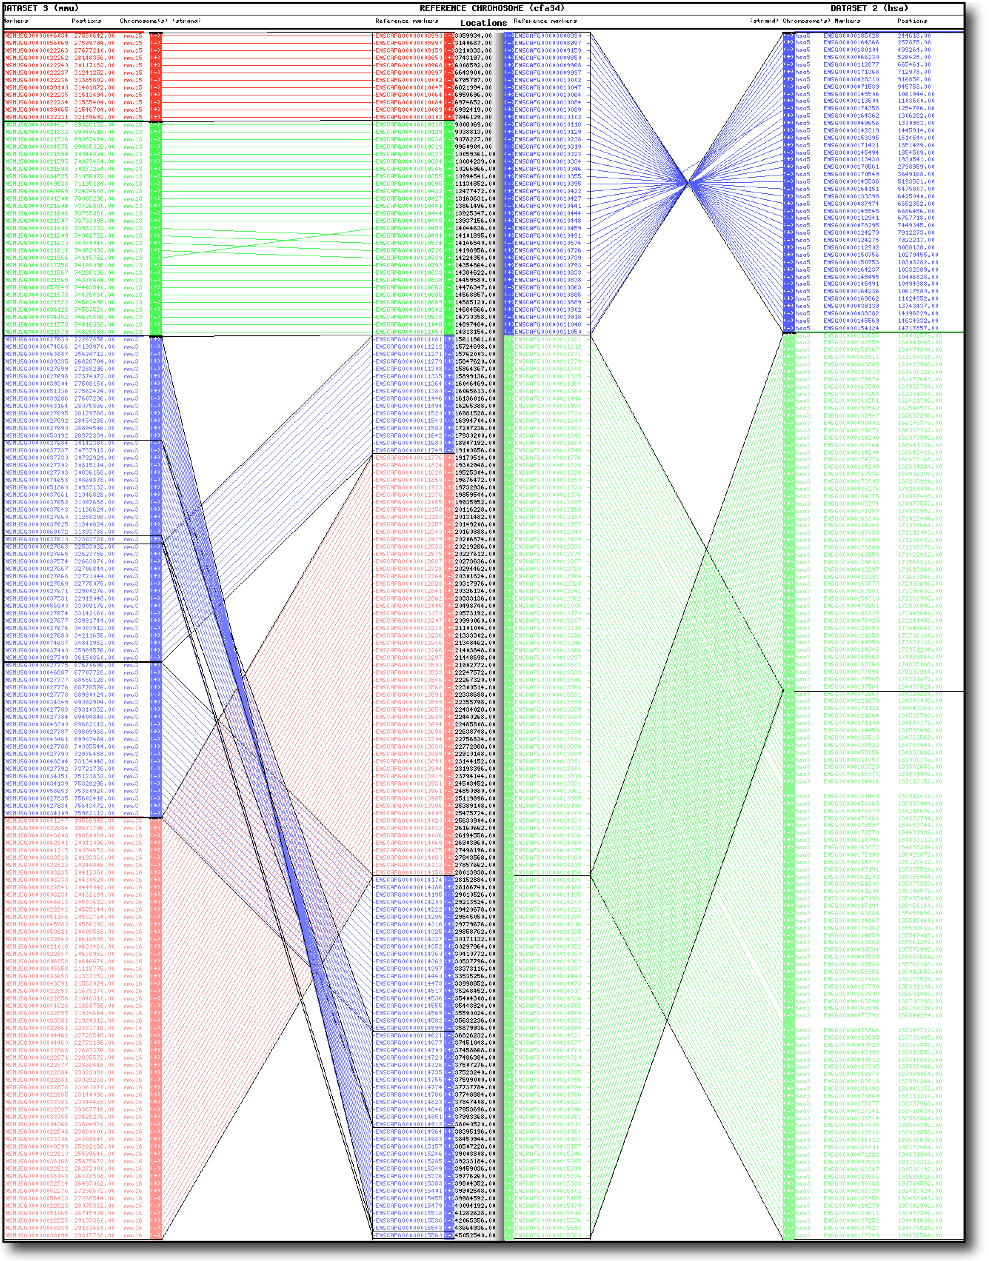
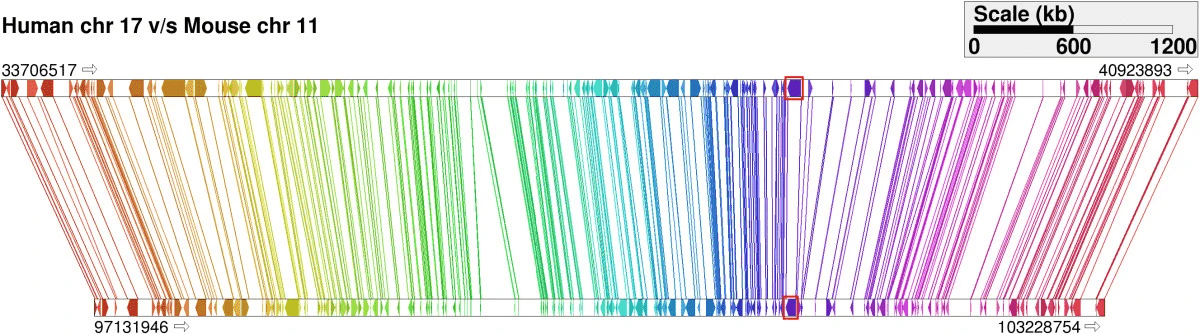
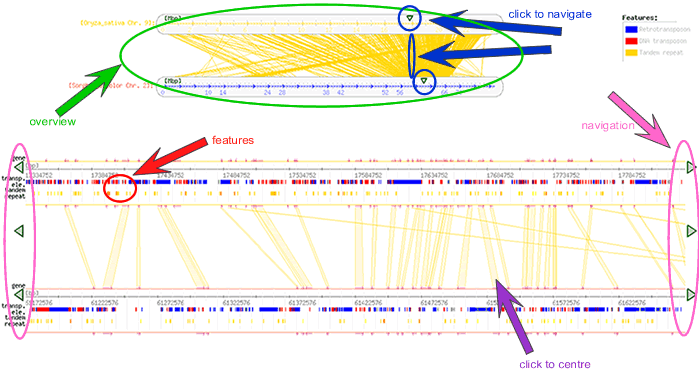
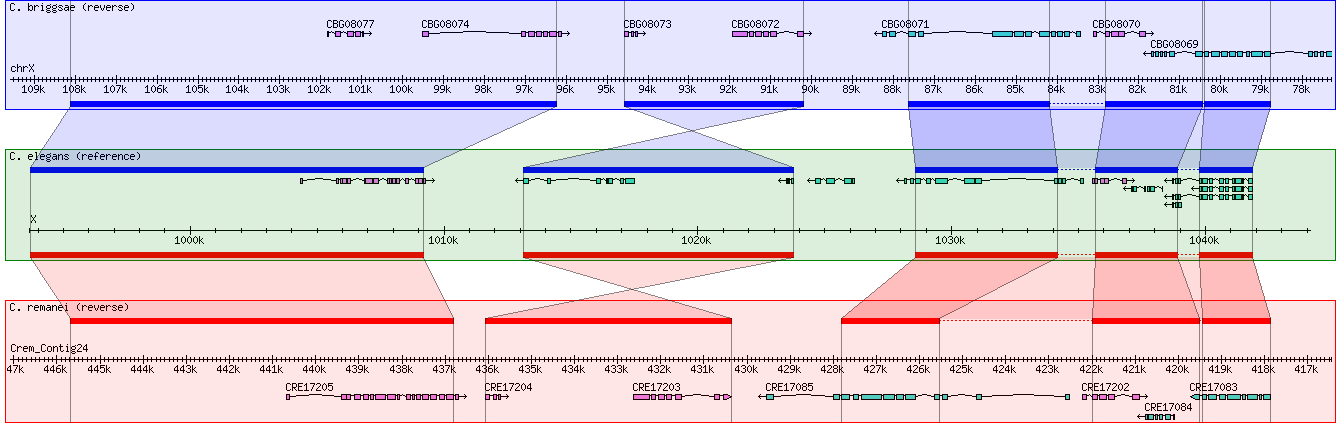
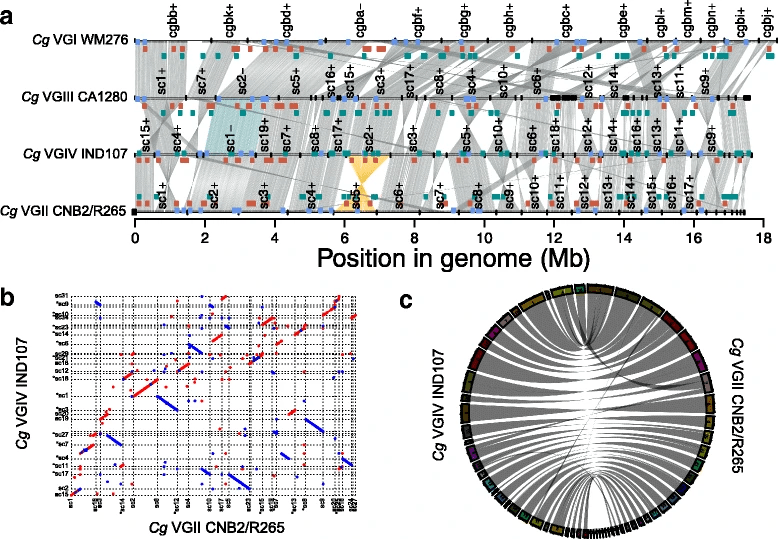

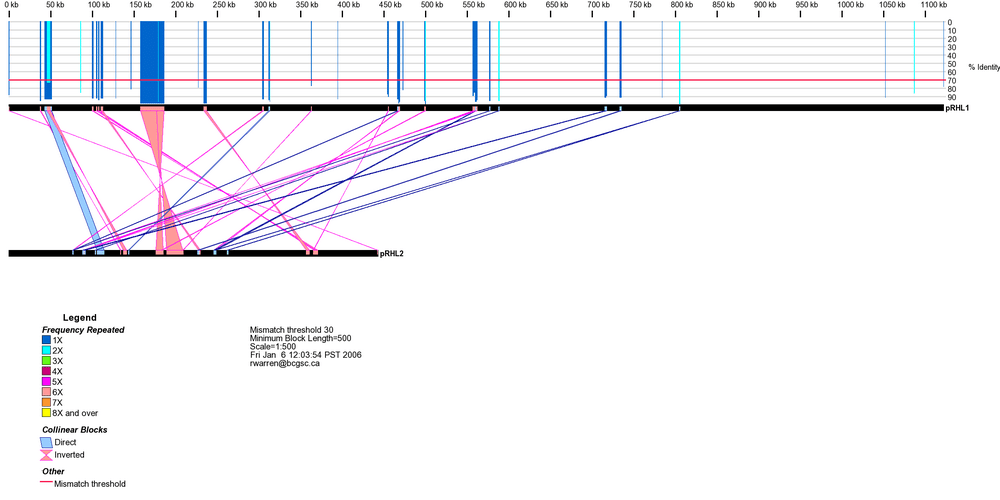
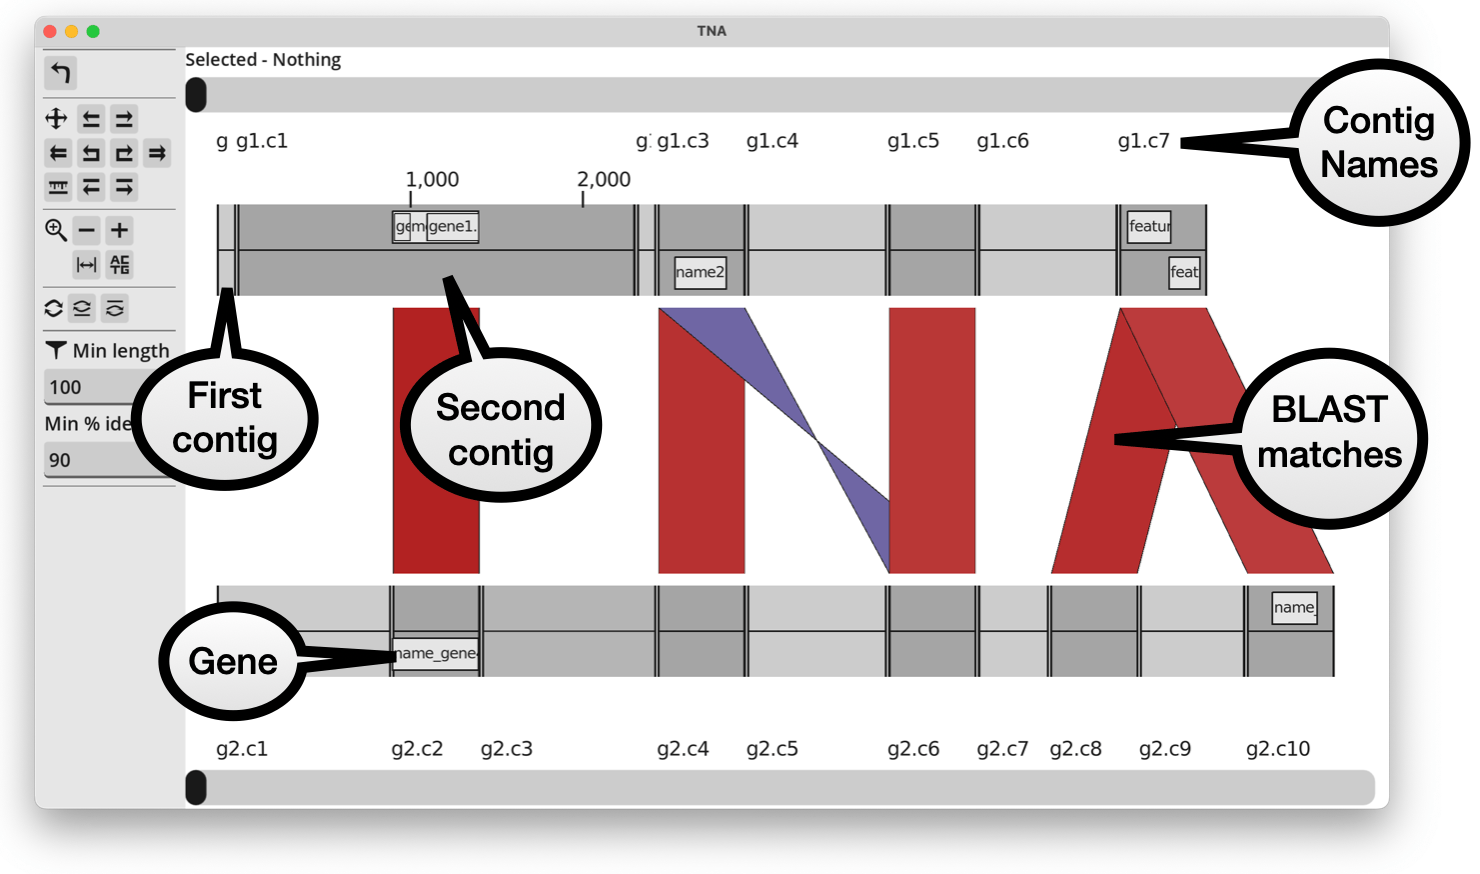
- Benchling (img)
- Chopchop (img)
- OpenVectorEditor (img)
- plascad (img)
- plasmapR (img)
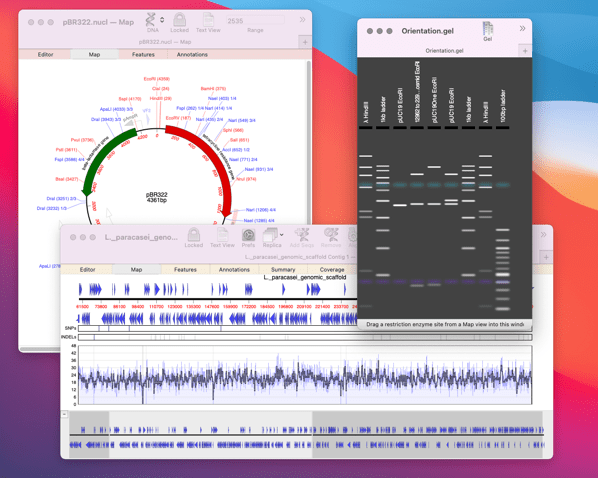
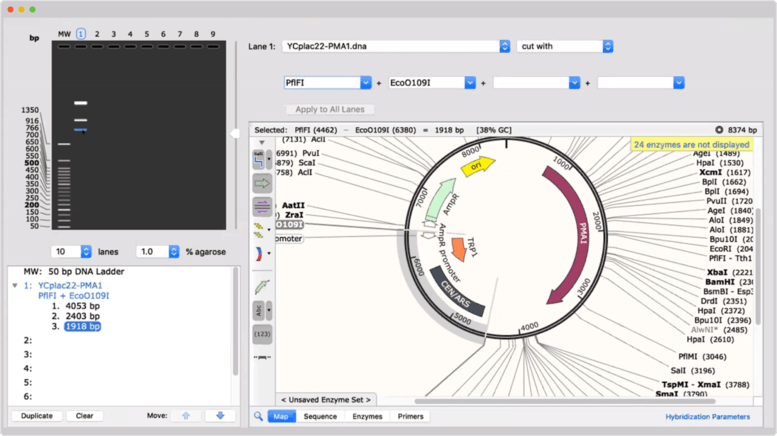
- SnapGene (img)
- VectorBee (Not open source, but is free) (img)
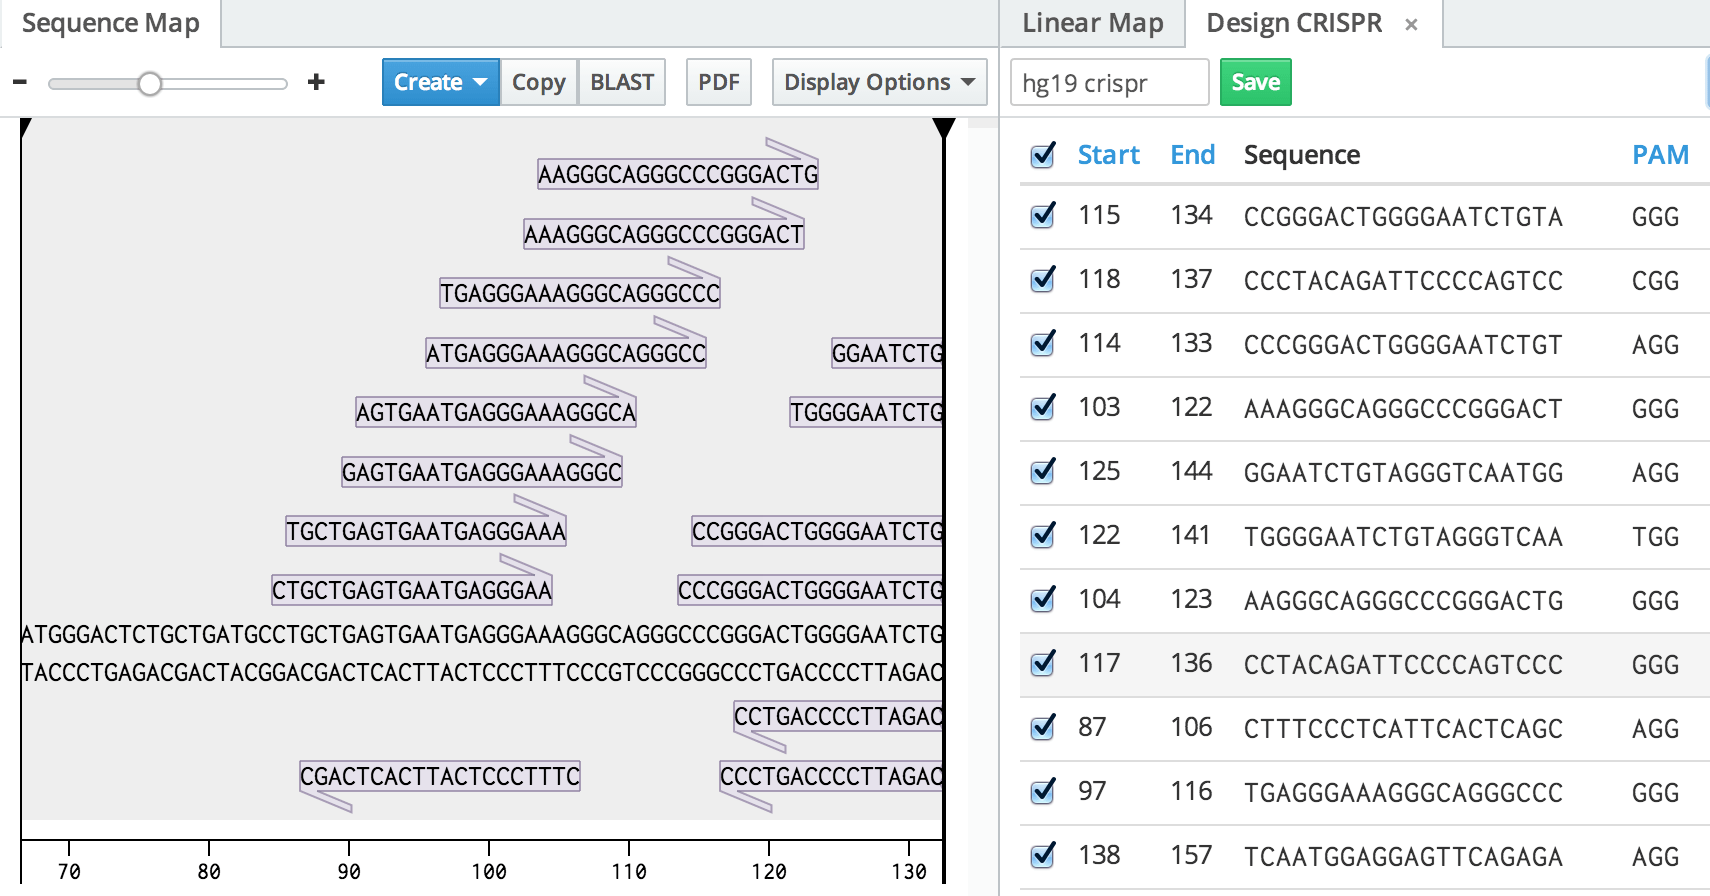
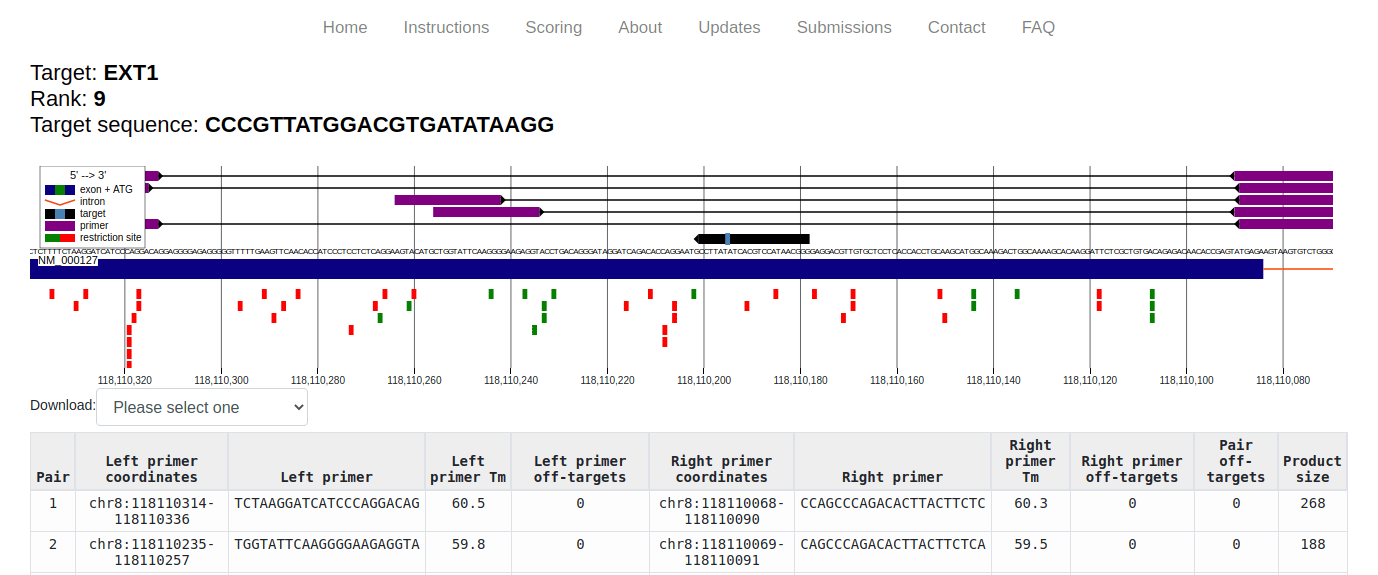

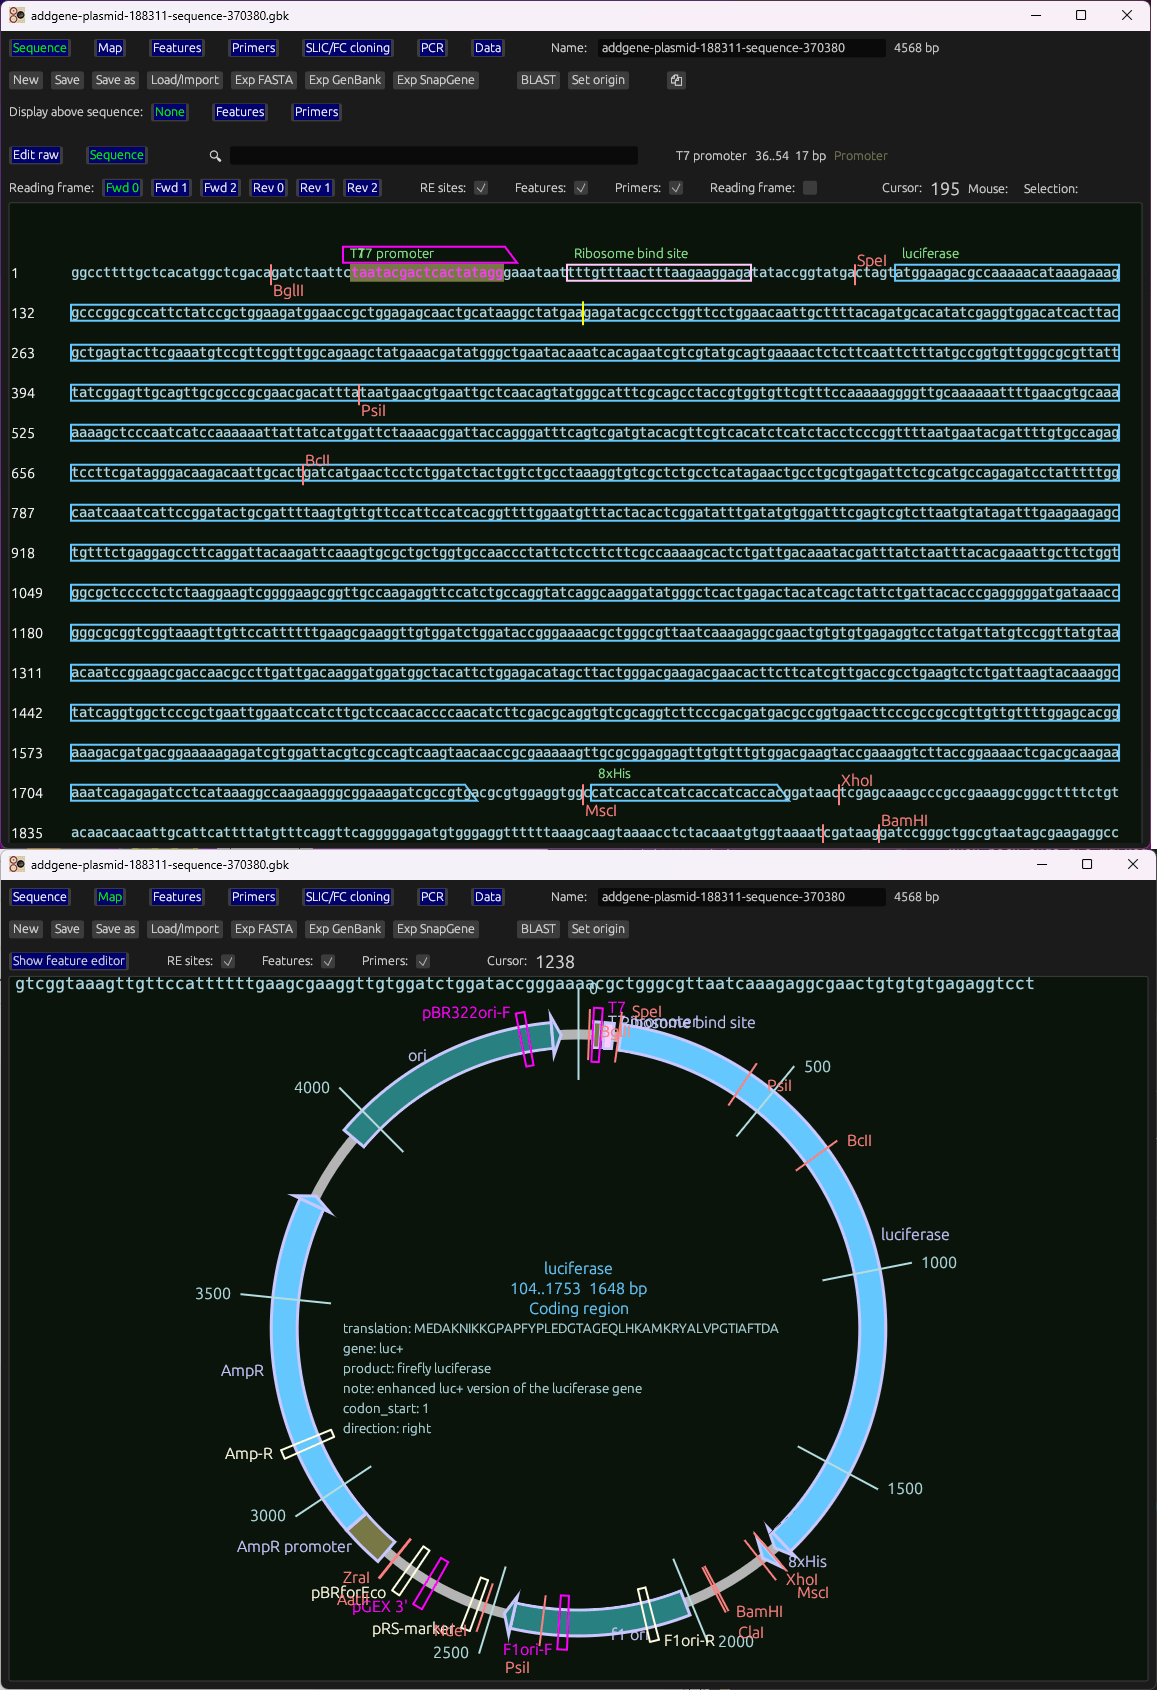
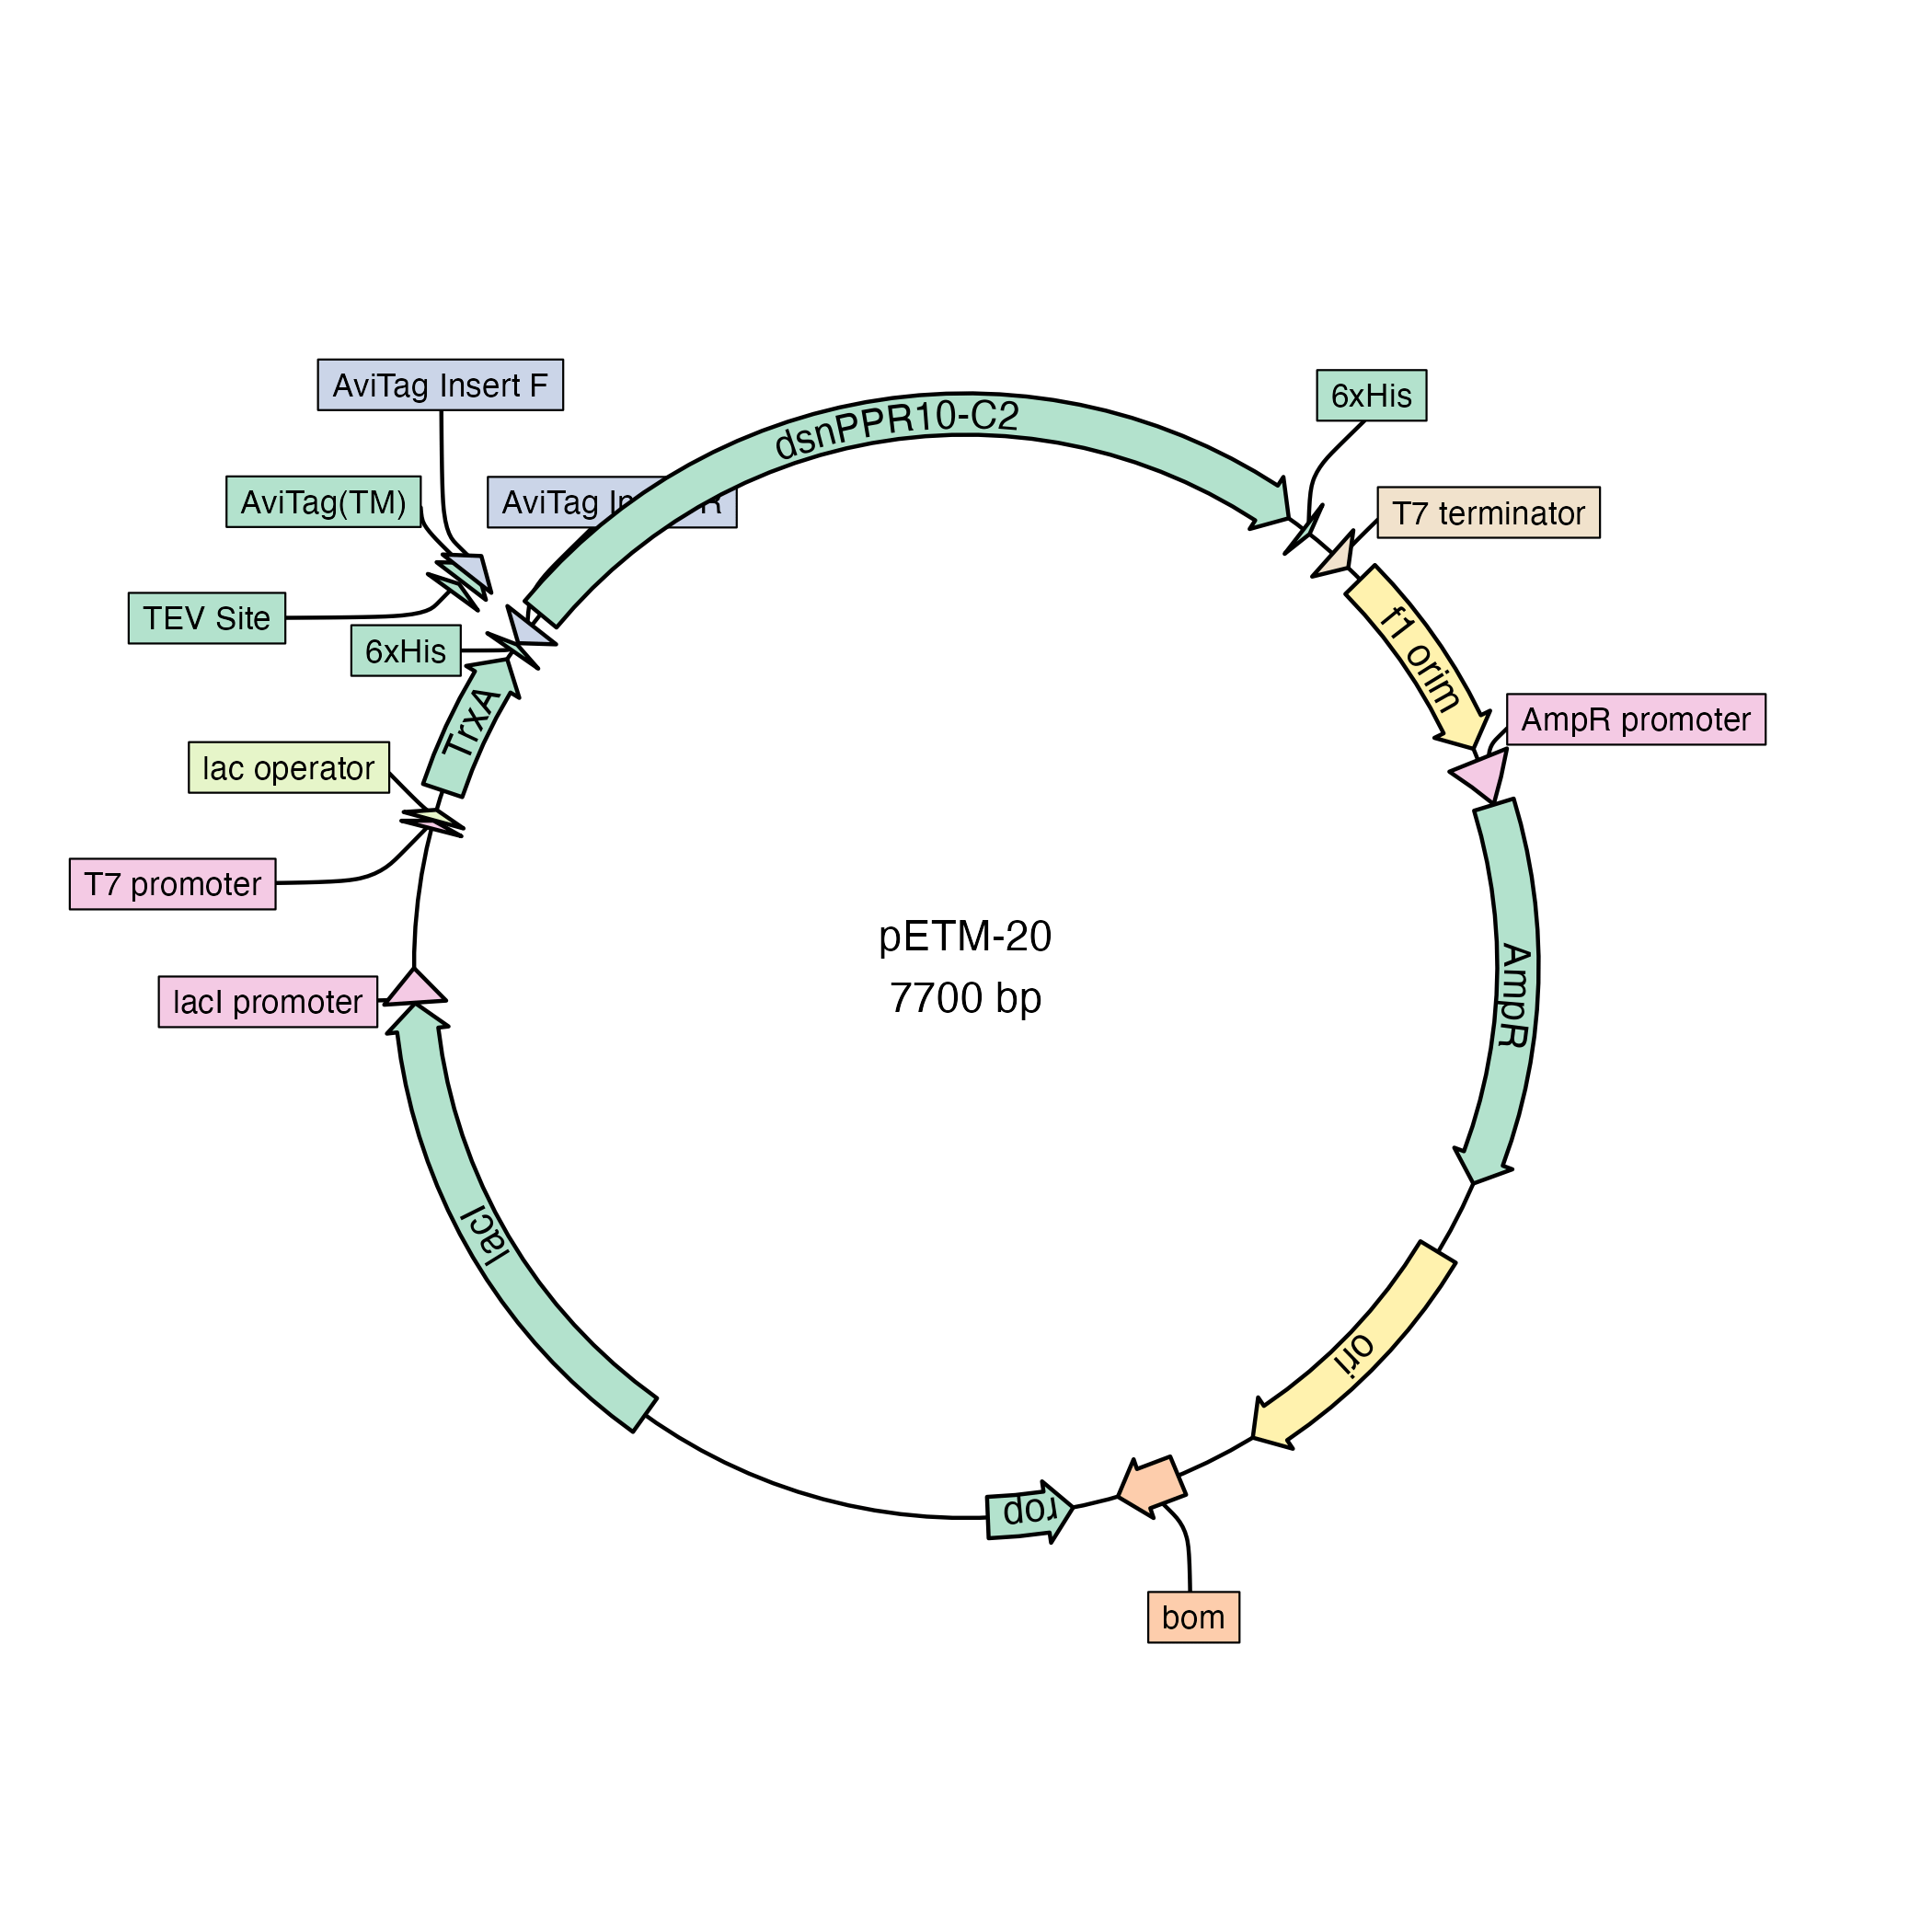

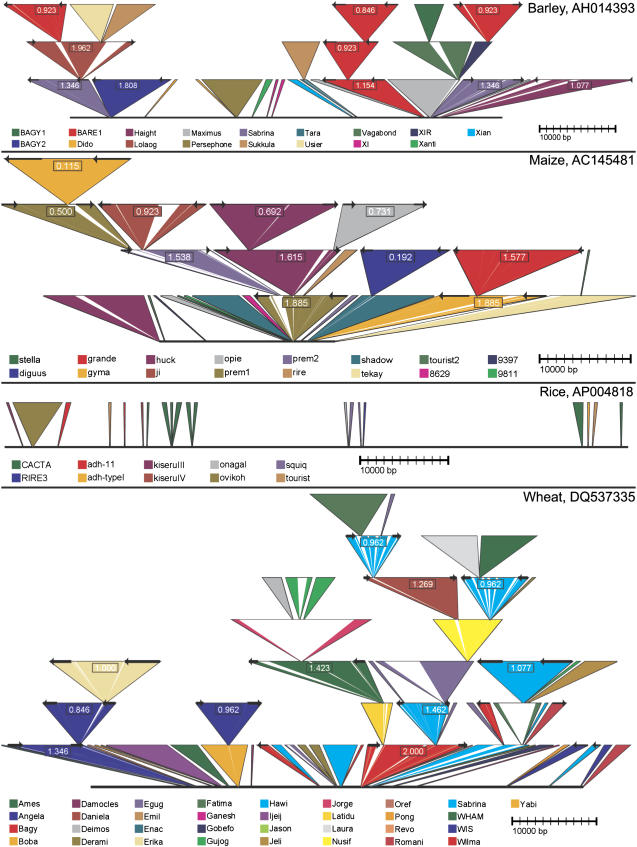
- TE-nest (This was an online tool that does not appear to exist anymore see https://web.archive.org/web/20170712104431/http://www.plantgdb.org/tool/TEnest/. the github link is re-hosted source code also downloaded from archive.org. Also note: The notation of nested triangles may be equivalent to just a feature being annotated inside a feature: this link helps show this https://mcstitzer.github.io/maize_TEs/) (img)
- Transposcope (img)
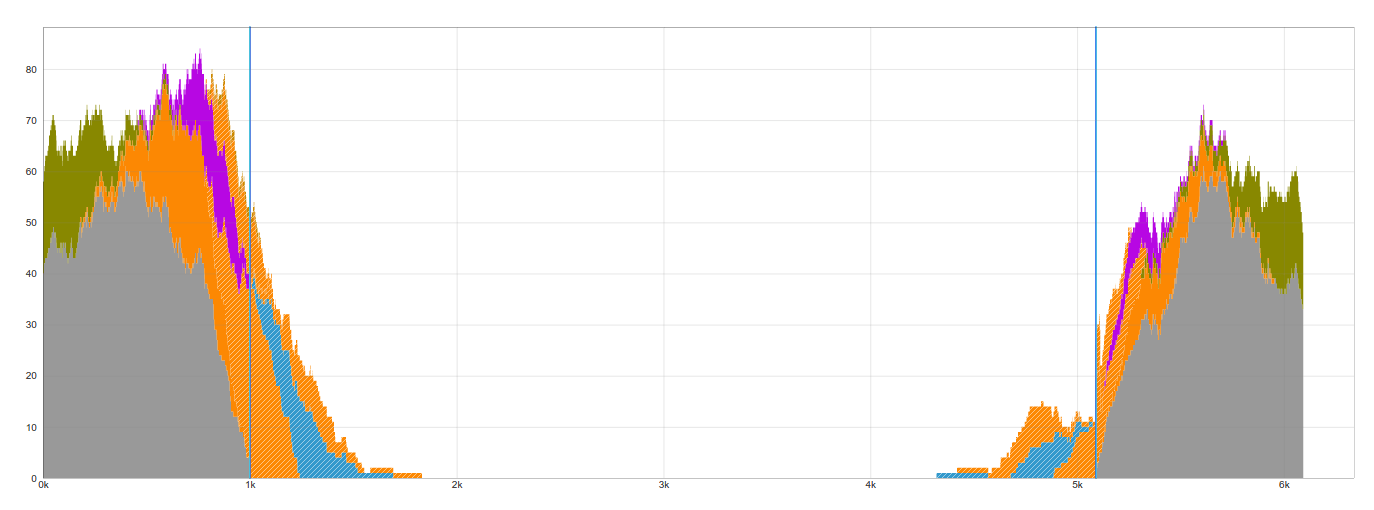

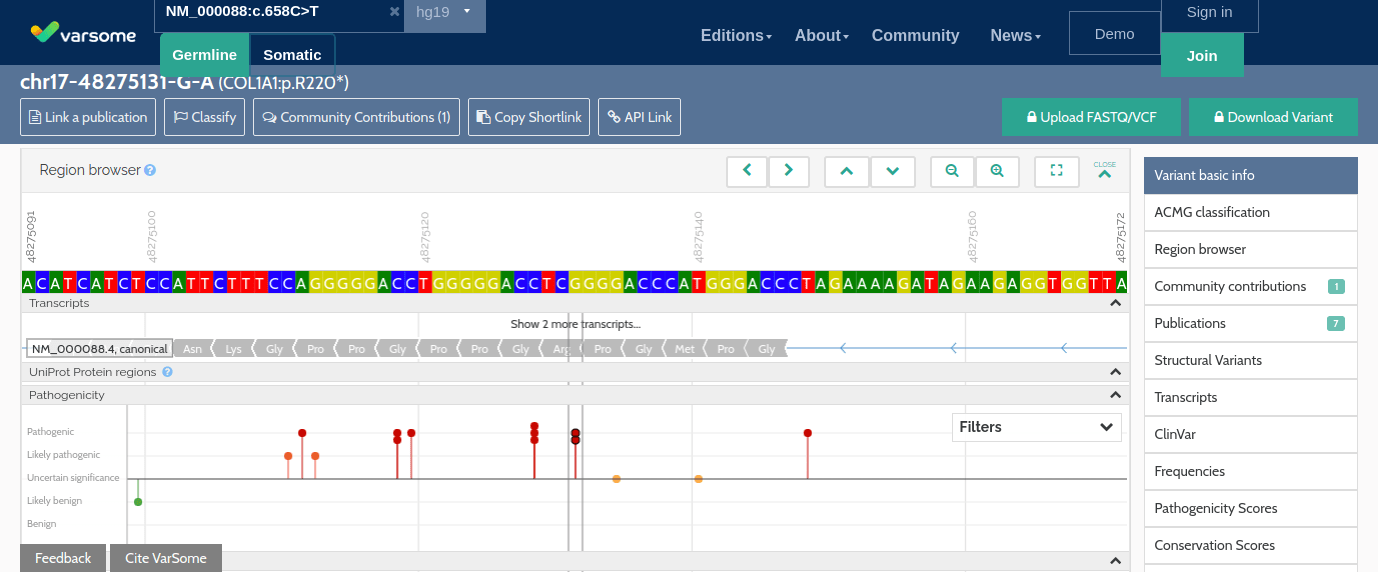
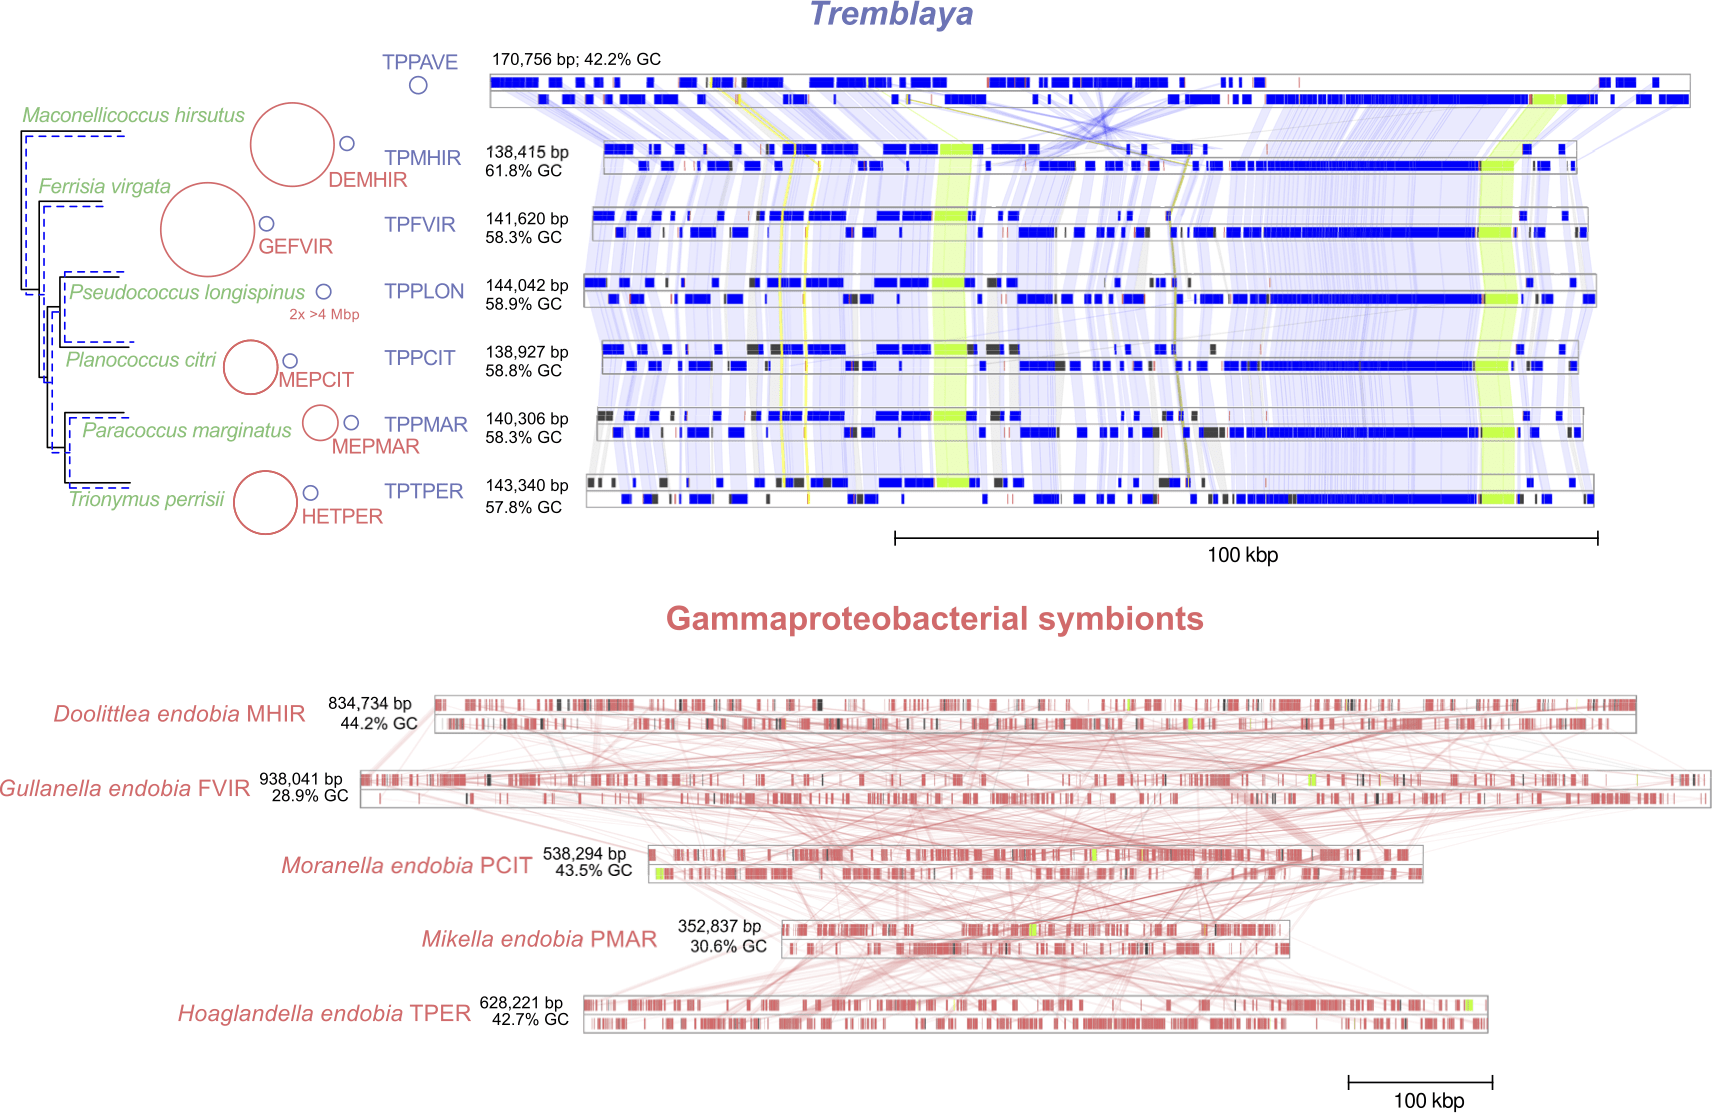
- AliTV (img)
- Comparative assembly hub snake track (img)
- Genome-plots-processing (img)
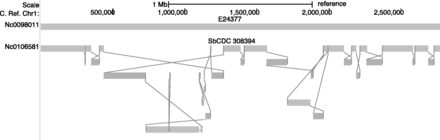
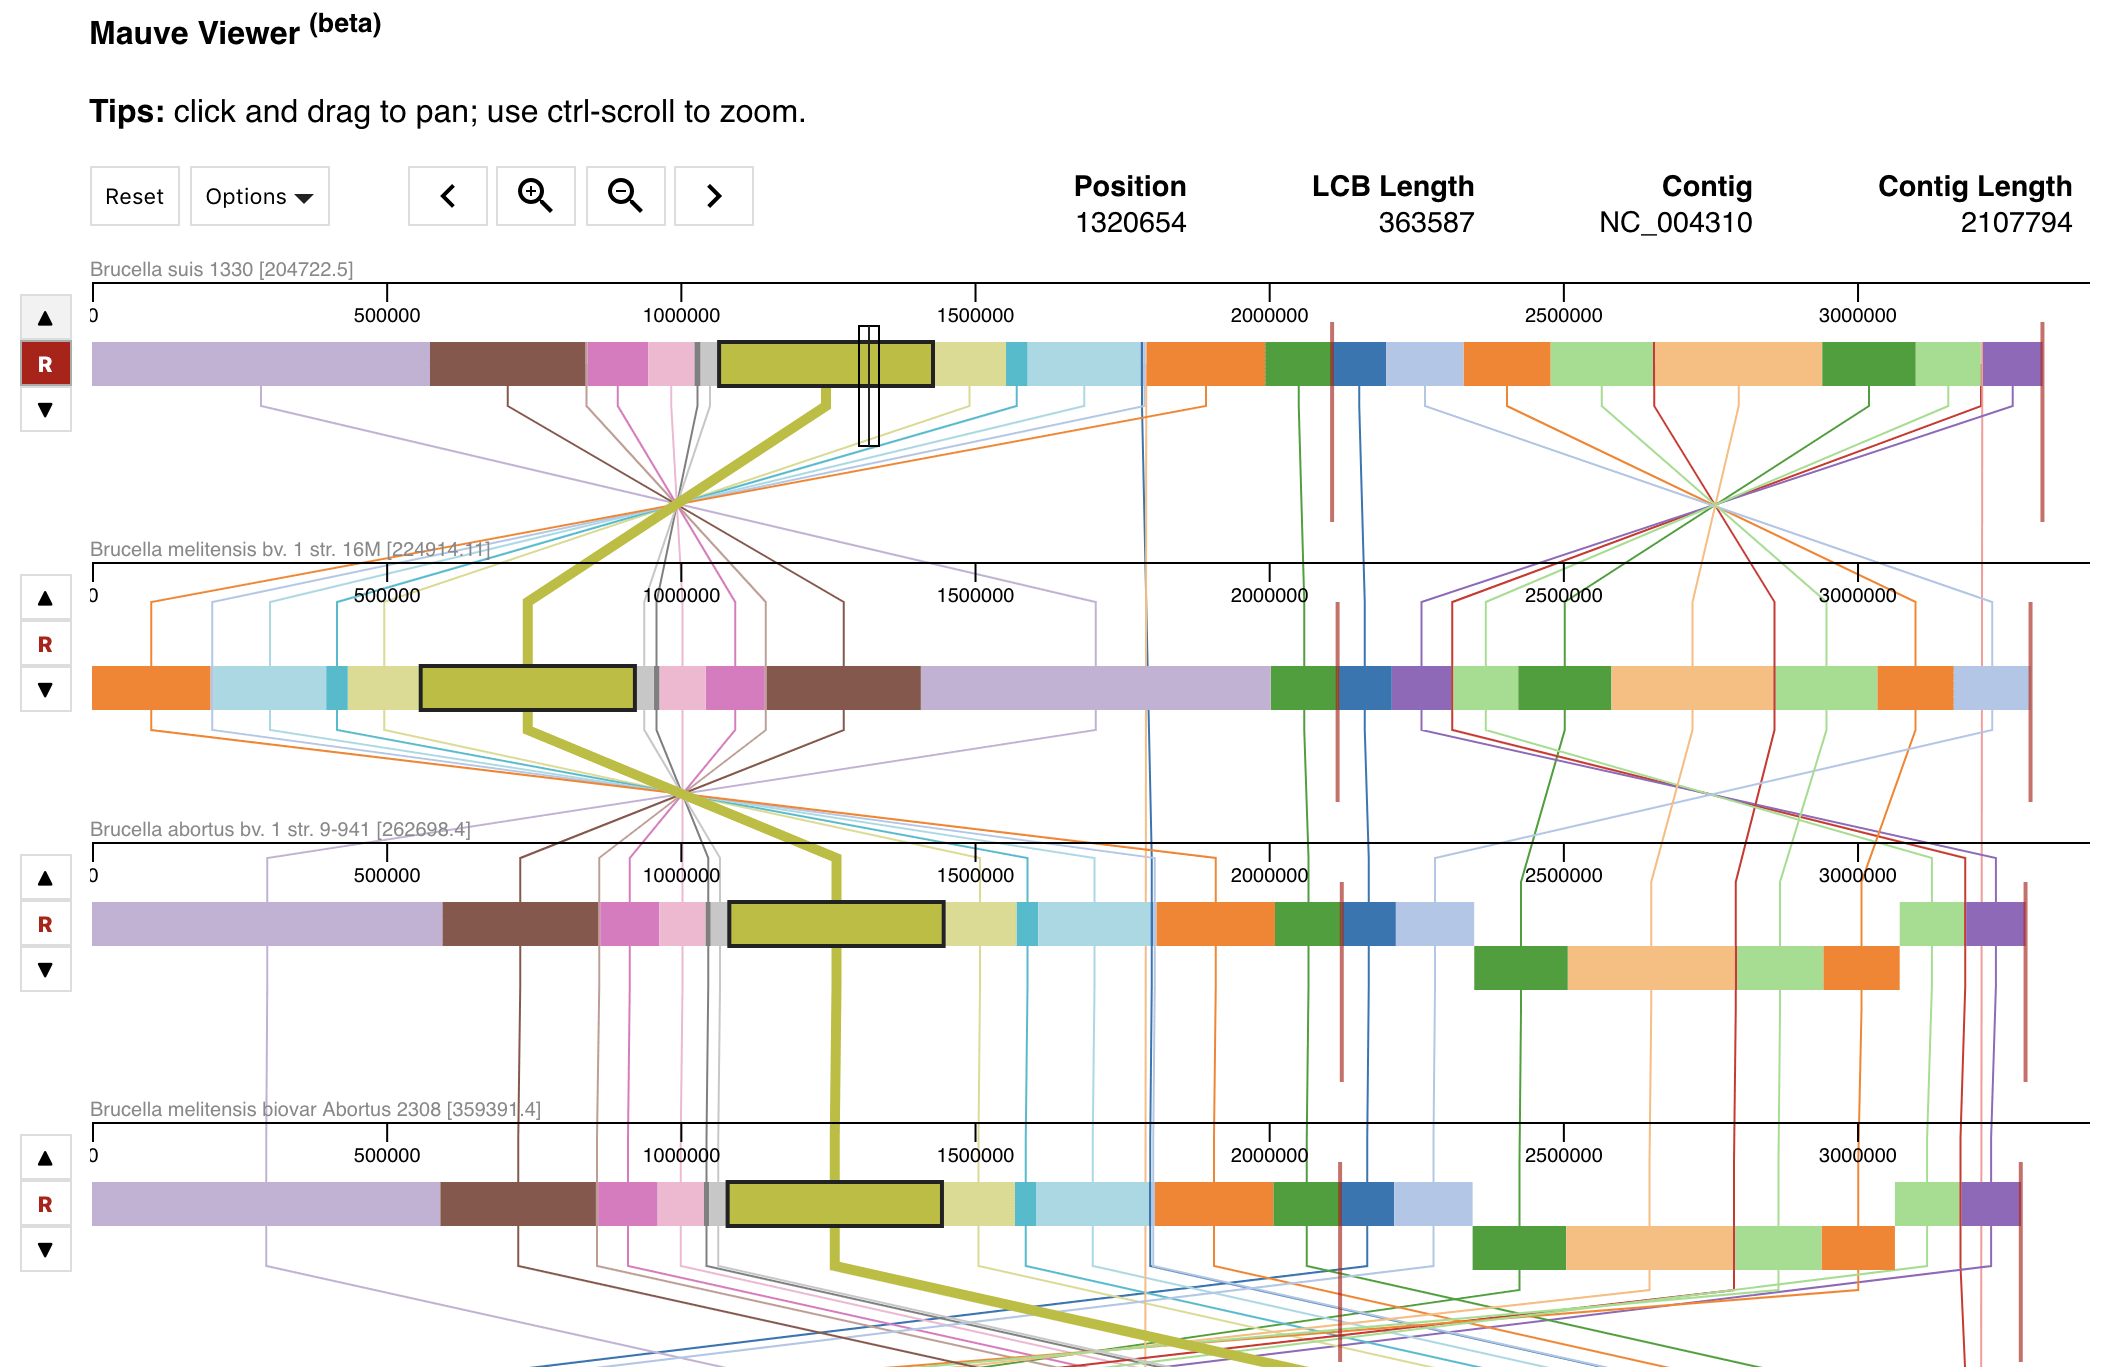
- mauve-viewer (img)
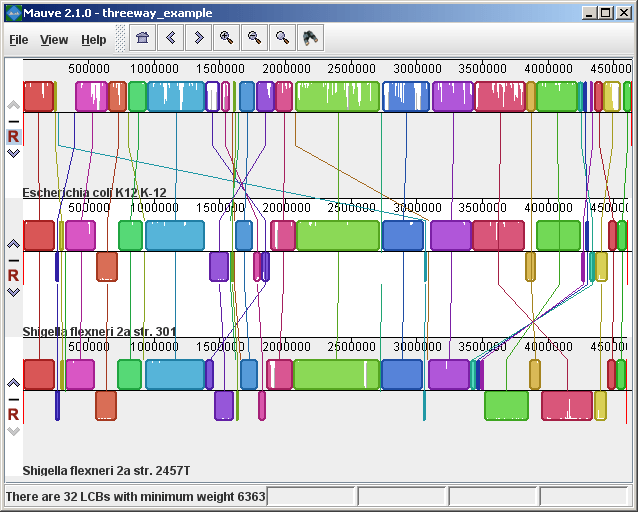
- progressiveMauve viewer (img)
- SequenceSurveyor (img)
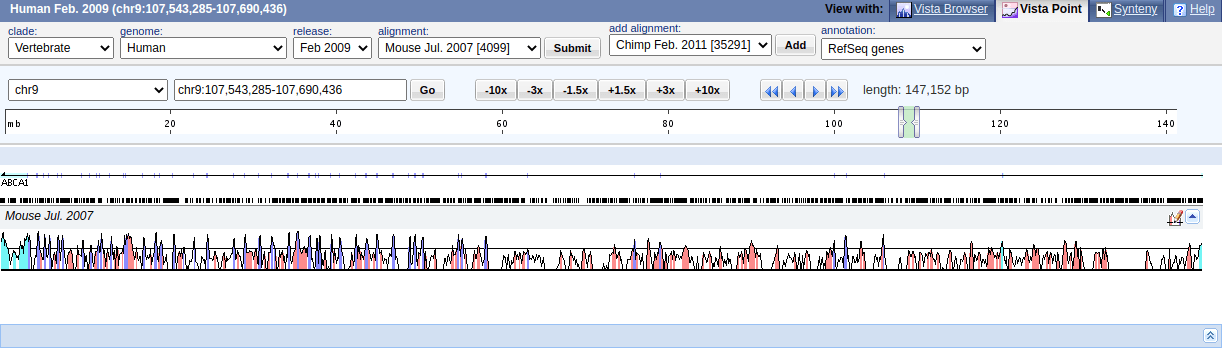
- VISTA browser (img)

- Awesome Bioinformatics
- Genocat large collection of genomic visualizations with great review paper accompaniment https://onlinelibrary.wiley.com/doi/full/10.1111/cgf.13727
- awesome-biological-visualizations
Send in PRs for more stuff!
This README.md and TOOLS.json are CC0 https://creativecommons.org/publicdomain/zero/1.0/
The website code is MIT