GDB dashboard is a standalone .gdbinit file written using the Python API that enables a modular interface showing relevant information about the program being debugged. Its main goal is to reduce the number of GDB commands needed to inspect the status of current program thus allowing the developer to primarily focus on the control flow.
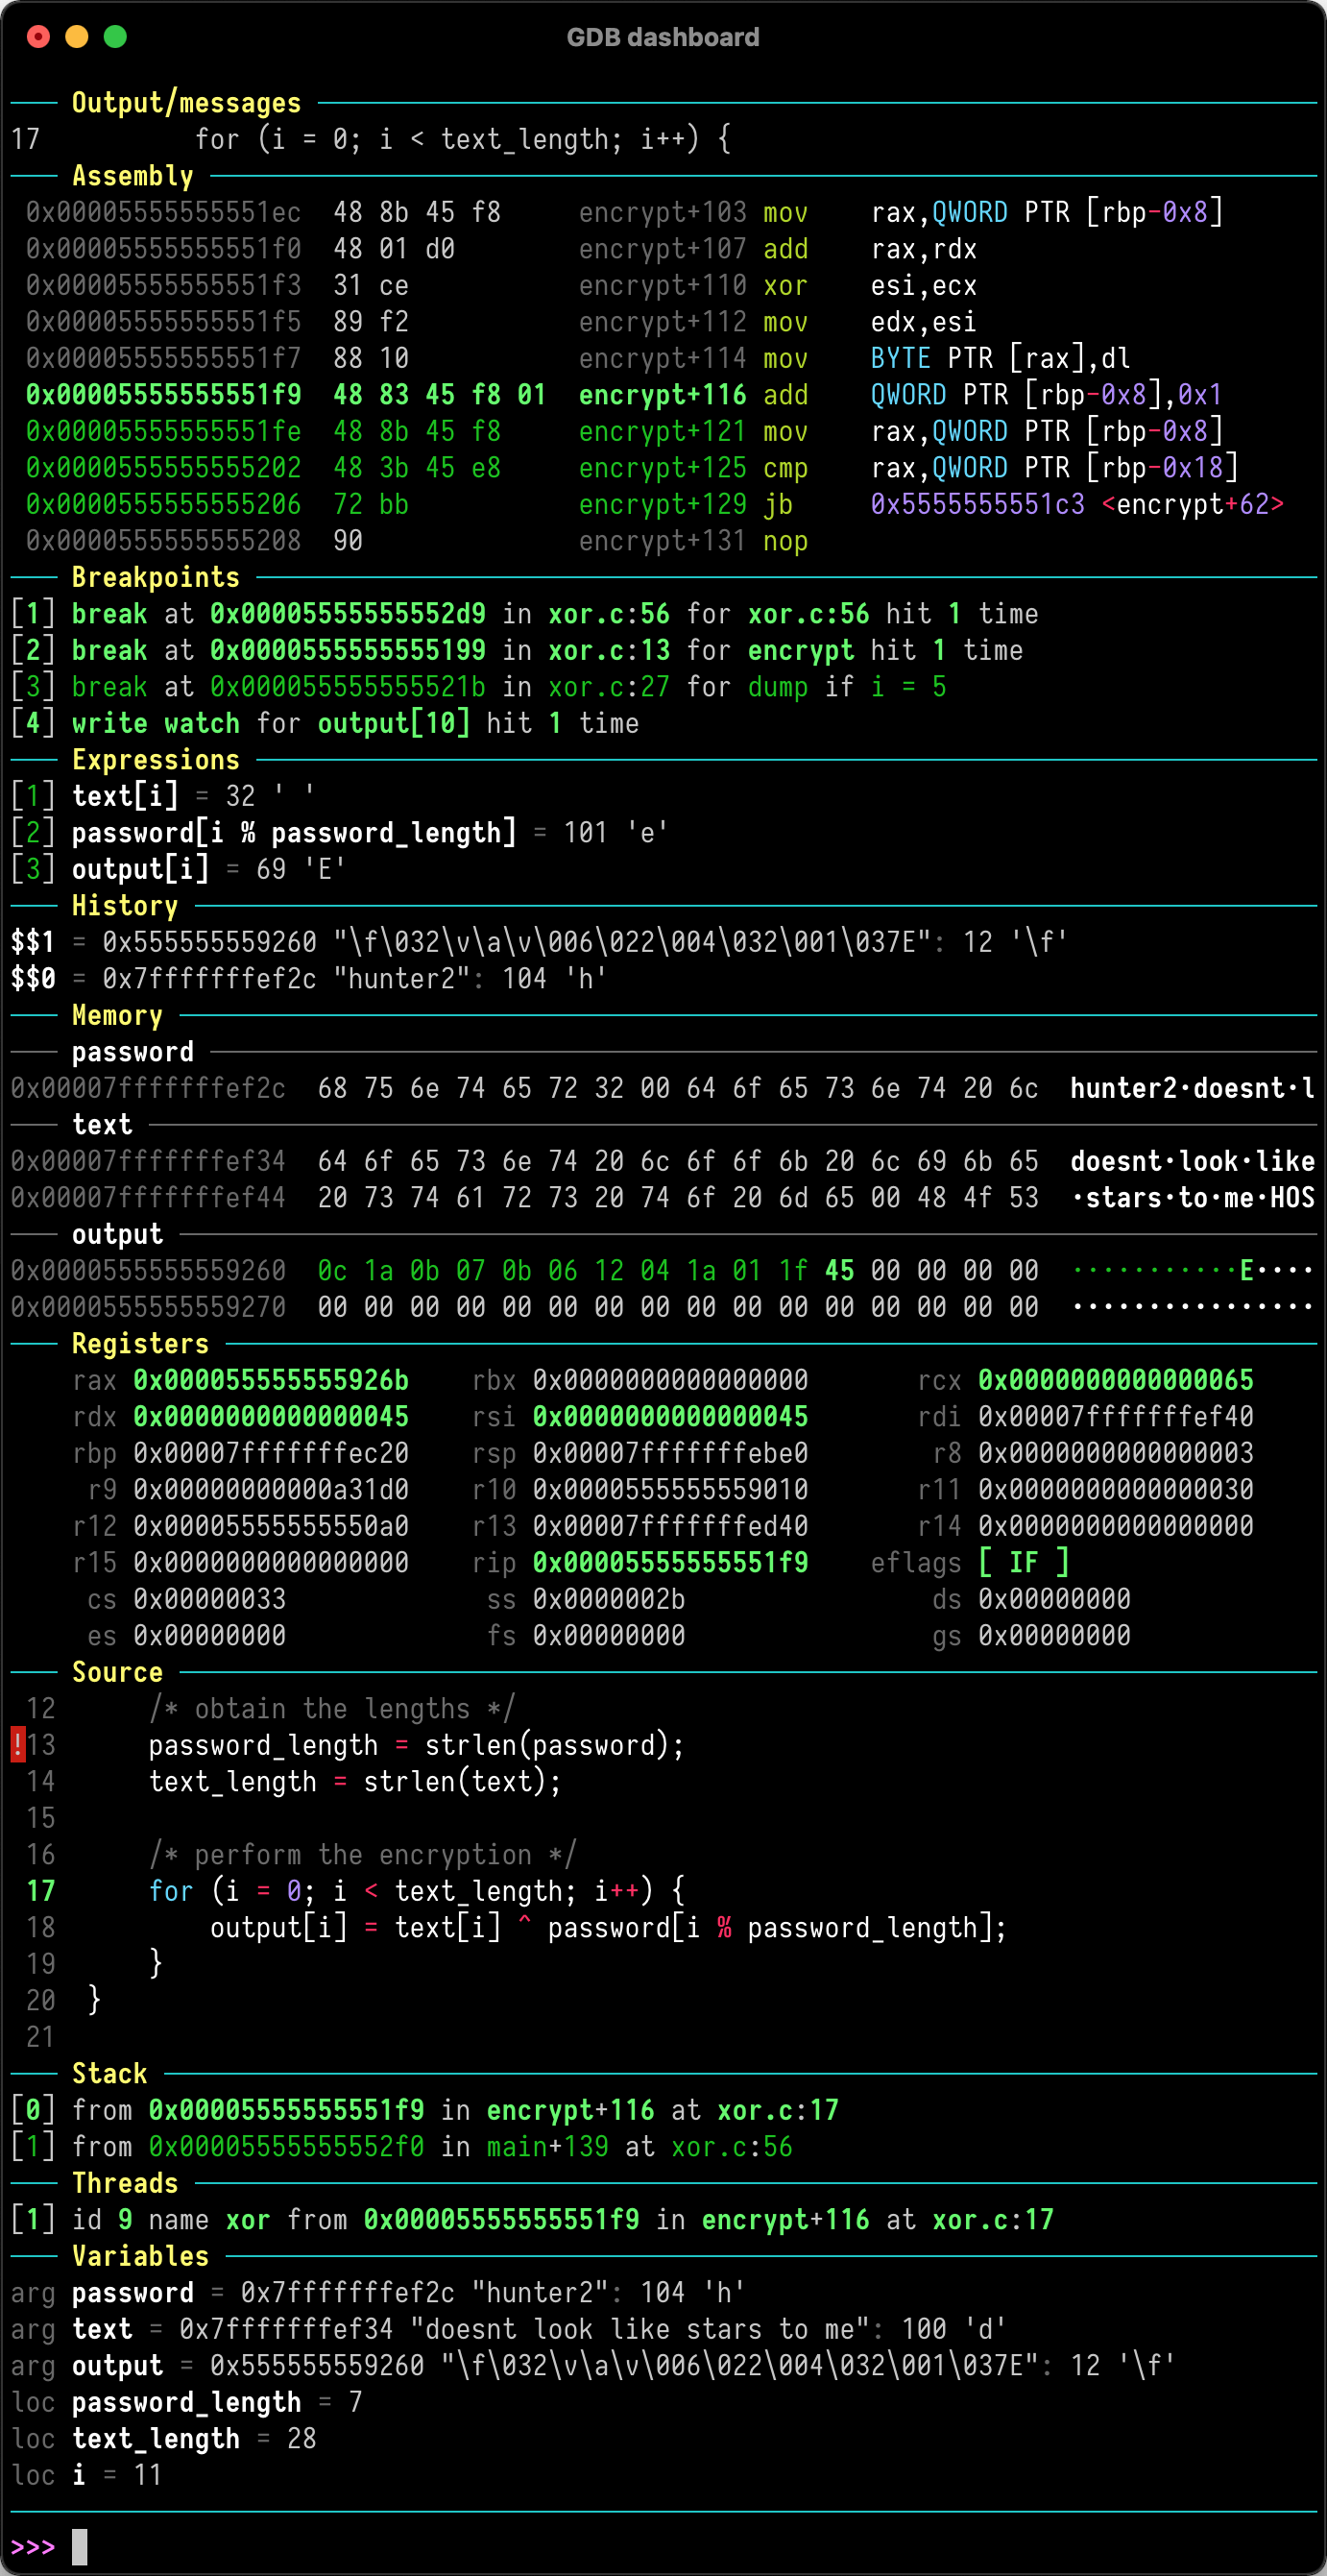
Just place .gdbinit in your home directory, for example with:
wget -P ~ https://github.com/cyrus-and/gdb-dashboard/raw/master/.gdbinit
Optionally install Pygments to enable syntax highlighting:
pip install pygments
Then debug as usual, the dashboard will appear automatically every time the inferior program stops.
Keep in mind that no GDB command has been redefined, instead all the features are available via the main dashboard command (see help dashboard).
Head to the wiki to learn how to perform the most important tasks.