








Netcap (NETwork CAPture) converts network packets into structured, type-safe Protocol Buffer audit records — designed for security monitoring, forensic analysis, and machine learning. A single Go binary with 83 packet decoders, 40+ stream decoders, and 141+ audit record types, backed by a concurrent architecture and a built-in web UI.
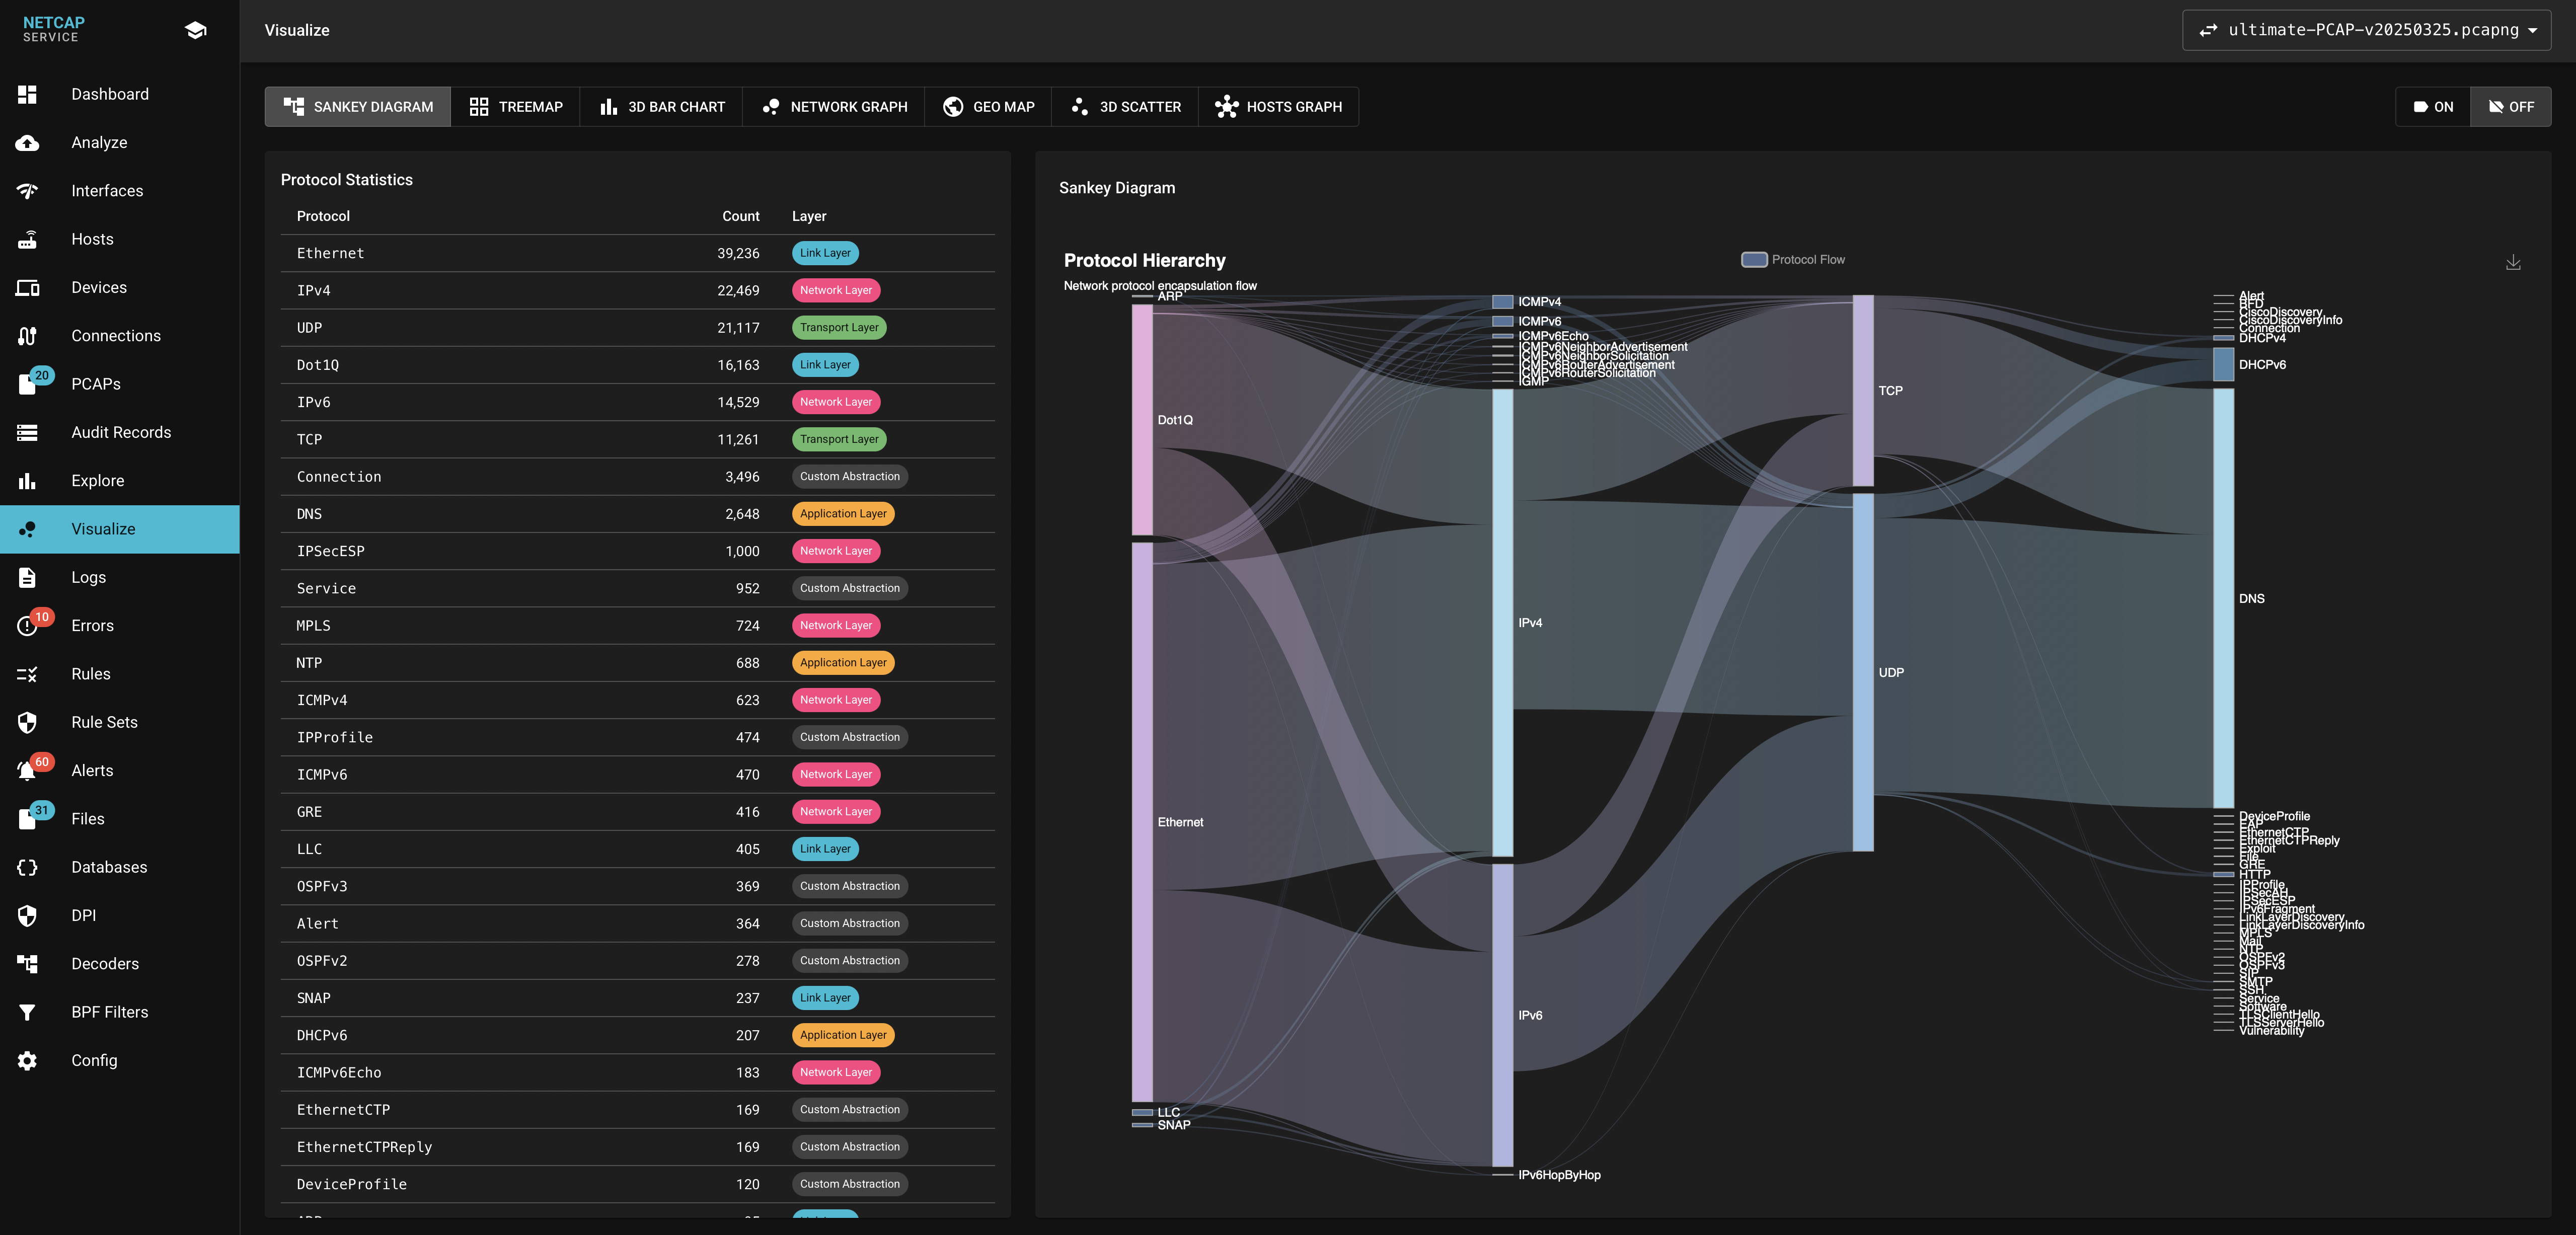
Protocol hierarchy visualization in the Netcap web UI — more screenshots
- 83 packet-layer decoders — Ethernet, IPv4/6, TCP, UDP, DNS, DHCP, ARP, TLS ClientHello/ServerHello, ICMP, NTP, SIP, OSPF, BGP, MPLS, GRE, VXLAN, 802.11, and many more
- 40+ stream decoders — TLS, SSH, HTTP/2, QUIC, SMB, FTP, SMTP, POP3, IMAP, IRC, Kerberos, DCERPC, and more
- Industrial protocols — Modbus, S7Comm, DNP3, OPC-UA, PROFINET, BACnet, CIP, IEC 62351
- Full TCP/UDP stream reassembly with configurable limits
Built-in React (Vite + TypeScript) dashboard in service mode with interactive visualizations:
- Sankey diagrams, treemaps, 3D scatter plots, geo maps, host communication graphs
- Record browsing with JSON/UI views and field-level filtering
- Protocol statistics, connection analysis, host profiling, alert management
See the Gallery for screenshots.
- JA4 fingerprinting — BSD-licensed JA4 TLS client fingerprinting; external JA4+ support is available only in opt-in local source builds subject to the FoxIO License
- YARA rules — file scanning with compiled yara-x rules for malware detection
- Magika AI — Google's AI-based file type classification on extracted files
- Credential harvesting — configurable protocol-aware credential capture
- File extraction — extract files from HTTP, FTP, SMTP, POP3, IMAP, SMB, IRC with hashing (MD5, SHA1, SHA256) and MIME detection
- Detection rules — 30+ YAML rule categories covering reconnaissance, exfiltration, web attacks, industrial ports, and more. The expression engine supports source→distinct-destination cardinality (fan-out) detection, an approved-workstation allowlist (
IsApprovedWorkstation), and time-of-day helpers (IsBusinessHours,HourOfDay) - OT/ICS threat hunting — function-code level Siemens S7comm detection (write / logic download / logic theft / PLC stop / CPU restart) mapped to CISA AA26-231A; ships
internal/rules/examples/s7comm_hunt.yml
- Protocol Buffers (default) — compact binary, accessible from any language
- CSV — configurable separators for data analysis pipelines
- JSON — human-readable structured output
- Elasticsearch — direct bulk indexing for ELK stack analysis
- DNS reverse resolution
- GeoIP geolocation and ASN: bundled DB-IP Lite with optional user-installed
GeoLite2. Select providers using
-geoProviders dbip,geolite2(default order) or the Databases page; see GeoIP configuration. - MAC vendor lookup
- Deep Packet Inspection (optional, via nDPI/libprotoident)
- Hyperscan / Vectorscan acceleration (optional) — multi-pattern regex prefilter for nmap service probes (~2.2× faster), CMS/web framework detection (~1.4×) and rule-engine
MatchesPattern(up to ~6× on miss-heavy detection traffic), see docs/hyperscan.md
- Prometheus + Grafana — real-time metrics and dashboards
- Elasticsearch + Kibana — full-text search and visualization
- Maltego — 45+ OSINT entity types and transforms
Agents stream audit records to a collection server over mutually authenticated TLS 1.3, with pinned keys, acknowledged delivery and reconnects. See docs/distributed-collection.md.
Pre-built binaries are available on the Releases page. To build from source:
# Build (requires libpcap)
go build -o net ./cmd/net/

# Build without DPI (fewer C dependencies)
go build -tags=nodpi -o net ./cmd/net/

# Build with Hyperscan / Vectorscan acceleration for service probes
# (requires libhs via pkg-config; e.g. `brew install vectorscan` on macOS)
# See docs/hyperscan.md for details.
CGO_ENABLED=1 go build -tags hyperscan -o net ./cmd/net/

# Capture from PCAP file
./net capture -read traffic.pcap

# Live capture
sudo ./net capture -iface en0

# Service mode (starts web UI)
./net capture -read traffic.pcap --service

# Service mode with hot reload (development)
airnet capture enables capture-time network detections independently of baseline
approval. -network-detection=false disables them;
-network-detection-config policy.json loads bounded JSON thresholds, authorized
source IPs/CIDRs and versioned indicators (internal/networkdetect/config.go).
| Finding | Evidence / interpretation |
|---|---|
| DNS DGA and tunneling | Distinct randomized apex names or high-entropy TXT labels beneath one parent, capture-time counts and sampled names; behavioral suspicion |
| TCP scans and SMTP fan-out | Distinct destination endpoints or mail hosts; retries do not increase cardinality |
| ICMP tunneling | Repeated large, high-entropy echo requests; diagnostic traffic can look similar |
| SSH transfer and unusual ports | SSH banners, unique contiguous client bytes and service port; encrypted contents and authorization remain unknown |
| Stratum, IRC, OAST and Telegram | Protocol/destination observations; legitimate use is possible |
| C2, sinkhole and imposter | Configured domain/IP matches with source, version and capture-time validity; no live feed is bundled |
| Legacy cleartext-service ports | Payload not recognized as TLS/SSH on a legacy service port; port alone does not identify the application or prove credentials were sent |
| Analyst UI | /alerts exposes classification, measured values, scope, limits and original evidence export; /api/network-detection exposes coverage, overflow, skipped late events and stream gaps |
Defaults: 60 s windows, 300 s alert deduplication, 10 distinct DNS names/TCP endpoints/large echoes, 5 SMTP hosts and 10 MiB SSH client payload. State retains at most 4,096 keys, 128 values per window and 1,024 flows with 4 KiB prefixes per direction. A stream gap stops signature/transfer claims for that direction and is reported. Indicator validity uses Unix nanoseconds at capture time. A missing status file or zero configured indicators is displayed as unavailable coverage.
internal/networkdetect/testdata/live/ contains 15 real FlightSim CLI captures
at revision 3709d1c6905d9527885c62f66f49a955c7b0d191, generated with Docker
--network none and local DNS/API/SSH/SFTP/IRC/Stratum fixtures. C2 intelligence
is synthetic lab data; SSH qualification uses a 1 MiB transfer and a 512 KiB
threshold. testdata/cases.json separately labels synthetic source-shape and
benign controls. Scenario names never enter the detector.
go test -race ./internal/networkdetect
go test -race -tags nodpi,noyara,nomagika ./internal/collector -run '^TestFlightSimCollectorReplay$'
The collector checks replay at 1/2/4/8 workers. The lab requires a 32 MiB
tcpdump buffer and a 2 s drain; tests/flightsim-lab/run.sh rejects kernel drops
and failed simulator modules before sealing capture hashes.
capture -behavior and agent -behavior enable passive, sensor/interface/VLAN-
scoped observations. Capture defaults to <output>/Behavior.json; agents use
the user-config netcap/behavior/<interface>/ directory. Select an existing
baseline explicitly with -behavior-baseline <path>.
./net capture -read traffic.pcap -out capture -behavior -http localhost:8080
./net capture -iface en0 -out live -behavior -behavior-sensor office-router| Contract | Behavior |
|---|---|
| Discovery | ARP/DHCP/NDP device bindings, TCP SYN service edges, DNS queries/resolvers and authoritative DHCP/IPv6 router-advertisement prefixes; -behavior-prefix supplies configured CIDRs |
| Learning | Defaults to 7 days of capture-time coverage and 100 observations; -behavior-learning and -behavior-min-samples tune the criteria |
| Approval | GET /api/behavior returns the snapshot; POST /api/behavior/change takes {action, ids, reason, version} for approve, pause, resume, relearn, reset, acknowledge, approve-changes, suppress or unsuppress; acknowledgement retains reviewed fact IDs/reason without changing trust, suppression or dedup |
| Monitoring | Unknown facts remain candidates; approval creates a new baseline version. Alerts include the expected/observed fact and original baseline identity in MatchedRecord |
| Bounds | -behavior-max-facts defaults to 10,000; overflow is visible and prevents approving incomplete learning |
| Persistence | Atomic checkpoints every second and on shutdown; a single-writer file lock prevents concurrent baseline mutation |
| Alerts | Alert.ncap.gz is appended and synced per alert, readable before capture finishes; malformed history is rejected without overwriting it |
| Live API | GET /api/alerts/stream emits SSE alerts with durable-history cursors; reconnect using Last-Event-ID. At most 8 readers; slow-client write deadline 10 s; replacement/truncation produces a gap |
| Health | /api/behavior/health and Coverage and health show observed sensor/interface/VLAN scopes, admitted packets/queue occupancy/drop counts, detector/storage errors, baseline/history bytes and agent ACK/pending/rejected/dropped batches. BehaviorHealth.json (schema 1, ≤64 KiB) retains the last sample at shutdown; unsupported counters remain null. Linux packet-socket kernel deltas accumulate with their sample timestamp; libpcap kernel counters are currently unavailable |
| WebUI | /behavior provides scoped inventory, candidates, explicit baseline decisions, evidence pivots, decision history and a bounded live feed; Device/Host/Connection details show labels, services, peers, country/ASN context and prefix-relative direction through /api/behavior/asset, then link to /behavior?asset=<address>. MAC/IP joins preserve sensor/interface/VLAN scope; context is capped at 64 records / 240 KiB of encoded rows |
| Later lateral evidence | /api/behavior/records?alertId=<id> supplements the unchanged early alert with retained Connection/SMB tuple/time candidates, zero-based record index and canonical protobuf SHA-256. TCP reset/FIN/SYN-ACK observations do not establish authentication; only readable explicit SMB AuthStatus is shown. Legacy records omit sensor/interface/VLAN, so candidates are never attributed to the alert's network scope. Capture-time lag is separate from unavailable audit emission latency. Scan limits: 10,000 records / 64 MiB per file, 1 MiB per frame and 64 displayed records; missing/corrupt files and truncation are visible |
| Service jobs | --service --behavior reaches helper and embedded capture paths. A configured baseline is copied into each new session; session decisions never modify the template |
| Lateral patterns | Distinct-target SMB fan-out, independent RDP attempts, novel internal SSH edges and inferred A→B→C sequences; retransmitted SYNs reuse their flow token |
| Traffic deviations | Frozen packet/byte models learned over at least 4 windows; idle windows included; monitoring does not adapt the approved model |
| Detector policy | -behavior-window, -behavior-fanout, -behavior-rdp-attempts, -behavior-approved-source, -behavior-deny-country, -behavior-deny-asn; /behavior displays geographic/admin policies and records reviewed geographic exceptions through selected-fact suppression |
| Snapshot compatibility | Schema 3 adds labels, prefix corrections and learned DHCP leases; schema 1/2 snapshots migrate without changing approved fact identity |
| Topology and inventory | /behavior includes a scoped, capped graph, persistent asset labels and CIDR corrections; original observations and alert evidence remain available |
| Benign changes | Learned DHCP-server leases explain reassignment; explicit binding approvals support failover; unknown DHCP servers cannot disable conflict indicators |
| Maintenance | -behavior-policy <JSON> supports source-specific UTC-nanosecond maintenance intervals; exemptions expire according to capture time |
| Endpoint delivery | Agent sensors default to their certificate fingerprint; alerts are synced locally before entering the bounded distributed queue |
| Corrupt baseline recovery | Startup rejects corrupt snapshots without overwriting them. Stop capture, retain the damaged file, restore a known-good approved snapshot to a separate writable path, and select it with -behavior-baseline; without a trusted backup, select a new path and explicitly relearn |
The synthetic packet-to-SSE gate (TestBehavioralPacketToSSELatency, 100 samples)
measured p95 51.85 ms including decode on Darwin ARM64 / Apple M5 Max, Go 1.27.0,
at 19.99 synthetic packets/s. TestBehavioralBrowserDelivery measured receipt to
React-render p95 99.10 ms in Chrome 154.0.8037.98, with 1,000 approved facts,
100 decisive SYNs over 5.998 s and 58,000 background SYNs at 9,586 packets/s;
zero fact/window overflow. Browser approval, reconnect, evidence and suppression
history are asserted against the real backend. TestBehavioralCollectorPressure
processed 100,000 stable SYNs through 4 protocol workers and audit persistence
in 0.406 s (246,310 packets/s), with zero missing observations or state overflow.
The browser workload uses synchronous synthetic ingress; the collector workload
uses an offline PCAP. Neither measures kernel-capture drops.
Run the opt-in gates after pnpm install --frozen-lockfile && pnpm build in
cmd/capture/webui/frontend; the browser gate also requires Google Chrome:
NETCAP_BEHAVIOR_BROWSER=1 go test -race ./cmd/capture/webui -run '^TestBehavioralBrowserDelivery$' -count=1 -timeout 120s
NETCAP_BEHAVIOR_PRESSURE=1 go test ./internal/collector -run '^TestBehavioralCollectorPressure$' -count=1 -timeout 90s
PCAP oracles in behavior_replay_test.go cover
discovery/DNS, rates, DHCP transitions, IPv6 conflicts, geography and lateral
patterns with equivalent evidence at 1/2/4/8 workers. These scoped
results do not establish latency on arbitrary traffic or hardware.
Endpoint visibility is limited to traffic at the selected interface; encrypted
SSH/RDP connection patterns do not establish authentication failures.
BenchmarkBaselineDurableStorage compares atomic JSON checkpoints with SQLite
WAL / synchronous=FULL on the same Mac (100 iterations, 2026-10-06):
| Facts | JSON checkpoint | SQLite full-state checkpoint | SQLite one-row commit |
|---|---|---|---|
| 1,000 | 5.003 ms | 0.650 ms | 0.051 ms |
| 10,000 | 10.987 ms | 6.473 ms | 0.033 ms |
Live state remains bounded in memory with portable JSON checkpoints every 1 s;
the measured 10,000-fact checkpoint costs 10.987 ms. The SQLite row result is a
lower bound for one observation, not a complete lifecycle/state-store port.
Alerts remain separately synced per event. TestCorruptBaselineRecoveryFromValidatedTemplate
verifies recovery preserves approval and both the damaged file and backup;
cmd/agent/behavior_test.go verifies TLS delivery of identical retained alert
evidence after a collector outage and local-engine restart.
internal/behavior/testdata/qualification/ pins fixture contract 1: schema-3
approved snapshots, monitoring PCAPs, exact detector/endpoint/evidence oracles
and SHA-256 manifests for discovery/DNS, address changes, lateral patterns,
rates and geography. The geography case includes synthetic DB-IP MMDBs.
NETCAP_BEHAVIOR_EXPORT=<absolute fresh directory> plus
NETCAP_BEHAVIOR_REFERENCE=<Go commit> exports the same corpus while running
go test ./internal/collector -run 'TestBehavioral.*(Oracle|WorkerCounts)$' -count=1.
Export refuses an existing case directory. Decision timestamps are generated at
approval; consumers verify the committed bytes against each manifest.
| Command | Description |
|---|---|
capture |
Capture audit records from live interfaces or PCAP files; --service enables the web UI |
dump |
Read and display audit record files in CSV, JSON, or table format |
label |
Apply attack labels to audit records using Suricata or CSV mappings |
collect |
Collection server for receiving data from distributed agents |
agent |
Sensor agent for distributed capture on remote hosts |
proxy |
HTTP/HTTPS reverse proxy with MITM traffic inspection |
export |
Export audit records with Prometheus metrics exposure |
transform |
Maltego OSINT transform plugin |
util |
Utilities: timestamp conversion, interface listing, database generation, search indexing |
inject |
Inline packet manipulation via NFQueue (Linux) |
investigate |
Bounded flow rankings and packet-evidence ZIP exports |
split |
Split audit record files |
net investigate flows --read Connection.ncap.gz \
  --start-ns "$START_NS" --end-ns "$END_NS" \
  --filter 'InSubnet(SrcIP, "192.0.2.0/24")' --group-by srcIP

net investigate packet-evidence --read exercise.pcapng \
  --bpf 'host 192.0.2.1 and tcp port 80' --out evidence.zip

net investigate collect-flows --listen 127.0.0.1:2055 --out ./fresh-output --duration 1m
net investigate exported-flows --read ./fresh-output/FlowExports.jsonl \
  --exporter 192.0.2.10:50000 --format netflow-v9 --domain 7 \
  --start-ns "$START_NS" --end-ns "$END_NS" --time-basis receive
START_NS and END_NS are inclusive UTC nanosecond integers. The WebUI API
exposes the same flow engine at GET /api/flows/query with startNs, endNs,
filter, groupBy, sortBy and limit. Connection downloads accept
format=evidence, a TCP/UDP protocol, and optional paired time bounds.
flows --window-mode overlap|contained|start|end selects interval semantics.
Optional --bucket-ns emits uniformly interpolated byte/rate estimates, capped
at 4,096 bins; raw group counters remain whole-observation counts. Reports also
include byte shares and nearest-rank size/packet/duration distributions. The
Investigation Evidence page exposes both controls and labels estimated values.
| Output | Interpretation |
|---|---|
| Flow report | ObservationID and SnapshotSequence reconcile cumulative records; counters cover whole observations overlapping the window. Rates divide bytes by summed observation durations. |
| Legacy records | Repeated tuples without snapshot semantics fail as ambiguous; no guessed deduplication or session count. |
evidence.zip |
packets.pcapng plus manifest.json: source/output SHA-256, source packet ranges, interface mapping, truncation counts and selection. Packet options, secrets and source statistics remain in the original capture. |
| File records | CompletenessReason reports extraction/decoding errors and observed stream loss. StreamMissingBytes is not loss attributed to the extracted file. |
Exports refuse replacement and fail on truncation or exceeded limits. Packet
exports cap captured packets at 1 MiB and PCAPNG blocks/metadata at 16 MiB;
flow queries cap records at 4 MiB and decoded input at 256 MiB.
The 38 book-derived workflow families are qualified in
testdata/investigation-coverage.json, with exact fixture references and mandatory
integration commands. Coverage is scoped to those fixtures and declared limits;
external endpoint, proxy and organizational evidence remains explicitly external.
capture --flow-exports normalizes UDP NetFlow v5/v9, IPFIX and sFlow v5 on
--flow-export-ports (default 2055,4739,6343,9995,9996). It records raw
datagrams, normalized observations and issues in FlowExports.jsonl before
worker dispatch. FlowExportsHealth.json binds final health to the record-file
SHA-256. Existing flow artifacts are refused; use a fresh output directory.
| Export interpretation | Contract |
|---|---|
| Templates | Collector-owned, exporter/collector/domain scoped; 30-minute expiry, 128 domains, 1,024 templates, 256 fields/template. |
| Sampling | Counts remain as reported; no automatic expansion. Reports reject mixed sampling settings. |
| Time | flow requires exported start/end; receive selects datagram capture/receipt time. sFlow does not establish flow start/end. |
| Gaps | Missing templates, malformed data and sequence discontinuities produce issue events and partial health. |
| Ranking | Requires exporter, format and domain. Cumulative counts and incomplete counters are excluded and counted explicitly. |
| Coverage | sFlow counter/unknown sample formats remain in raw datagrams; unsupported options scopes are not applied globally. |
capture --conns also writes stream-evidence/stream-*/{client.bin,server.bin,manifest.json}.
These bytes contain no ANSI markup. The manifest preserves per-direction offsets,
capture times, TCP gaps and UDP datagram boundaries. A gapped stream must not be
parsed as contiguous data; the legacy display transcript remains separate.
capture --capture-evidence writes capture-manifest.json with input/configuration
hashes, ingress/admission/drop counters and nullable kernel statistics. Add
--retain-packets --packet-segment-mb 32 --packet-retention-mb 512 for rotating
PCAPNG retention. Expired segments remain recorded as tombstones. A fresh output
directory is required; retention failure is an error, not successful collection.
The Investigation evidence page (/investigation-evidence) displays this
coverage, scoped flow reports and directional stream downloads.
net investigate exchange --spec exchange.json executes one bounded TCP/UDP
experiment. Byte fields use JSON base64; Framing supports length-prefix,
delimiter and fixed. Response variables capture fresh negotiation values.
TLS verifies certificates and hostnames; optional rootCAFile and paired
clientCertificateFile/clientKeyFile configure experiment trust and mTLS.
net investigate protocol-fields --spec grammar.json --read client.bin --compare other-client.bin
validates framed streams against declared byte/UTF-8/signed/unsigned fields and
reports changes by frame ordinal and field name. Fields include offsets, raw
bytes and hypothesis descriptions. Frame insertions can shift alignment; a
successful parse does not prove the hypothesized application semantics.
net investigate tls-capture --read tls.pcapng --key-log secrets.log --stream 0
uses installed tshark for offline TLS dissection. Output binds input, key-log
and plaintext hashes to the tool version; key material is not included. Node
ordering follows tshark's reported endpoints, not an assumed client role.
NETCAP_REQUIRE_TLS_ADAPTER=1 go test ./internal/protocoltest -run TestTLSCaptureAdapter
requires the TLS 1.2/1.3 adapter fixtures instead of skipping when tshark is absent.
net investigate protocol-proxy --spec proxy.json --listen 127.0.0.1:9000
handles one framed TCP connection. Mutations select direction/frame and byte
range, with optional length-prefix repair, drop, duplication and delay. Output
records original/transmitted bytes. Both tools enforce time/frame/byte limits;
response matches are protocol observations, not proof of endpoint effects.
| Investigation command | Qualified workflow |
|---|---|
protocol-server |
Bounded TCP/TLS or single-peer UDP server emulation |
protocol-access |
Role/state/resource matrix with observed reset controls |
protocol-generate, protocol-corpus |
Deterministic bounded grammar/field/state/byte cases |
protocol-fuzz, protocol-reproduce |
Valid controls, minimized marker-positive cases and exact reproduction |
protocol-boundary |
Target rejection separated from harness timeout/budget-stop |
protocol-triage |
Hashed debugger/process/routing evidence import; impact remains unverified |
sensor-seal, sensor-import, sensor-prune |
HMAC-bound output bundles, receiver-authorized sensor namespaces and expiry; transport remains caller-owned |
Use each command's --help for the versioned JSON/input contract. FTP data
extraction waits for control/data readers to drain; FTPDataHealth.json records
associations and exclusions. TCPReassemblyHealth.json records checksum policy
and rejection counts. Both sidecars are shown in the Investigation Evidence page
and retained by Pro projects.
Pre-built images are available for multiple configurations:
| Image | Description |
|---|---|
| Alpine | Minimal image with full DPI support |
| Alpine (nodpi) | Lightweight, no DPI dependencies |
| Ubuntu | Full-featured Ubuntu-based image |
| Service | Web UI service mode image |
See the docker/ directory for all Dockerfiles and build variants.
- Documentation — full usage guide
- Homepage — project homepage
- DeepWiki — AI-powered codebase exploration
- Thesis — original research paper
Contributions welcome — from protocol decoder additions to core framework improvements.
Development Setup:
Please use the bug report template for issue reports.
Netcap is licensed under the GNU General Public License v3, which is a very permissive open source license, that allows others to do almost anything they want with the project, except to distribute closed source versions. This license type was chosen with Netcap's research purpose in mind, and in the hope that it leads to further improvements and new capabilities contributed by other researchers on the long term.