


TypeScript MIT

cal-heatmap

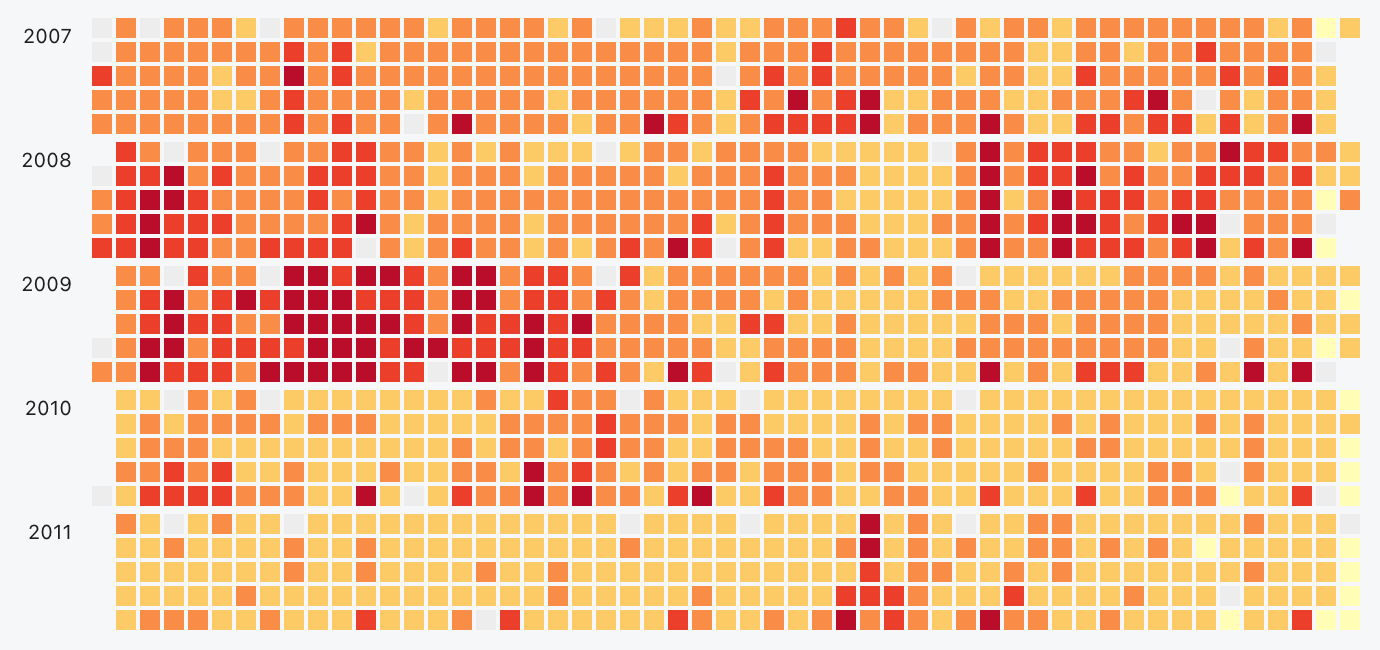
Cal-Heatmap is a javascript charting library to create a time-series calendar heatmap

W

wa0x6e

Dernière activité 12 sept. 2026
wa0x6e/cal-heatmap

3,1 k

étoiles

305

forks

59

issues ouvertes

calendarcalendar-heatmapchartd3jsjavascriptseries-data

Ce README est souvent en anglais.

Cal-Heatmap logo

Cal-HeatMap Coverage Status npm version node node

Cal-Heatmap is a javascript charting library to create a time-series calendar heatmap

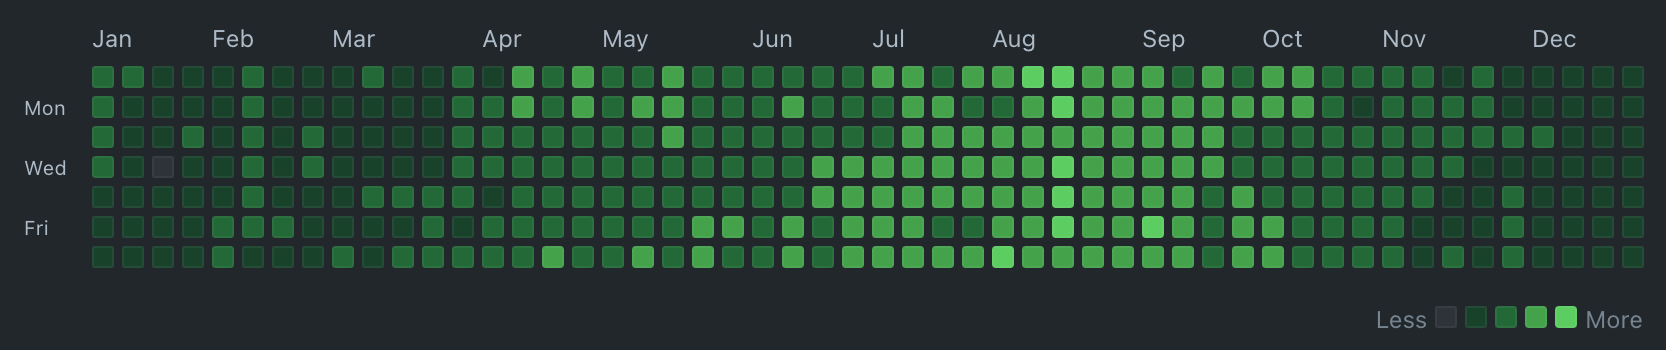
This library will help you to chart a calendar heatmap, like the Github contribution calendar appearing on each github user's page, but with more features like:

  • 🔀 animated date navigation
  • ⏳ time interval customisation
  • 🗓️ full controls on the layout/UI
  • 🌐 locale and timezone support
  • ⚡ plugins system
  • 🖥️ broad browsers support
  • 🔚 right-to-left support
  • ♾️ and many more...

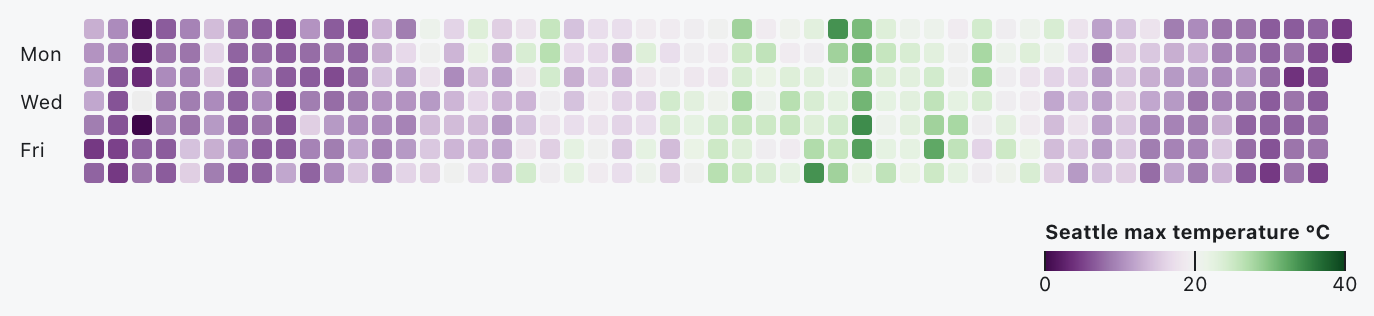
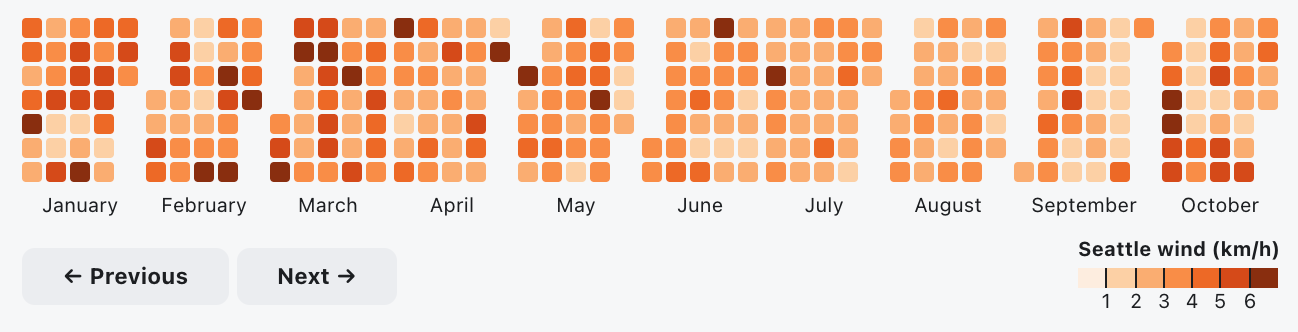
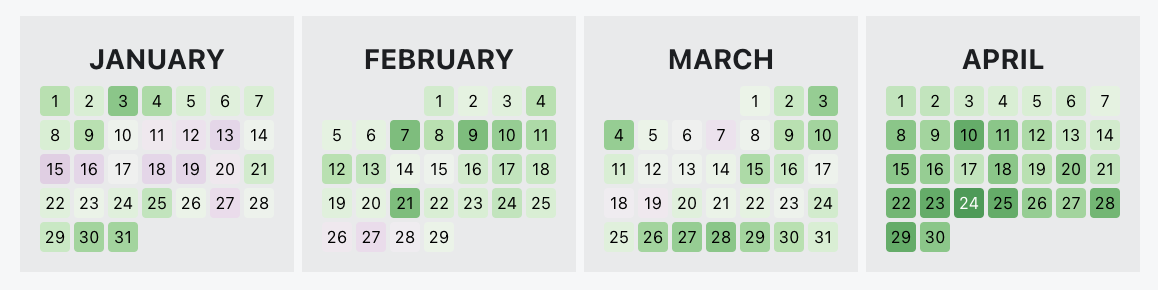
Github like Calendar Heatmap example Year/Day linear scale with legend Calendar Heatmap example Year/Day threshold scale with legend Calendar Heatmap example Month/Day alternate layout Calendar Heatmap example Month/Day weekdays only Calendar Heatmap example

See documentation website for full documentation and more examples.

License

Cal-Heatmap is licensed under a MIT License.

Projets similaires

A d3 heatmap for representing time series data similar to github's contribution chart

TypeScriptd3data-visualizationheatmap
DDKirwan
2 k étoiles139

Redefined chart library built with React and D3

TypeScriptchartcharting-librarycomponents
Rrecharts
27,6 k étoiles2 k

Timelines Chart

JavaScriptd3jsheatmapkapsule
Vvasturiano
627 étoiles129