



This is a data visualization plugin for Obsidian, based on Ant Design Charts. Support plots and graphs. @see The document generated by Zread
- Obsidian Charts View Plugin
Use command Insert Template -> Word Count to insert code block.
#-----------------#
#- chart type    -#
#-----------------#
type: WordCloud

#-----------------#
#- chart data    -#
#-----------------#
data: "wordcount:Words"

#-----------------#
#- chart options -#
#-----------------#
options:
  wordField: "word"
  weightField: "count"
  colorField: "count"
  wordStyle:
    rotation: 30

data: "wordcount:Words,PARA,@Inbox/"
data: "wordcount:/"
data: "wordcount:@Inbox/"
Use command Charts View: Insert Template -> Pie to insert code block.

Use command Charts View: Insert Template -> WordCloud to insert code block.

Use command Charts View: Insert Template -> Treemap to insert code block.

Use command Charts View: Insert Template -> DualAxes to insert code block.

Use data.<any name> and options.<any name> to set data and options. Keep data and options <any name> same.
Use command Charts View: Insert Template -> Mix to insert code block.

Use command Charts View: Insert Template -> Bar to insert code block.

Use command Charts View: Insert Template -> OrganizationTreeGraph to insert code block.

Use command Charts View: Insert Template -> Radar to insert code block.

Use command Charts View: Insert Template -> TinyLine to insert code block.

Chart data by dataviewjs.
Use command Charts View: Insert Template -> Dataviewjs Example (Column) to insert code block.

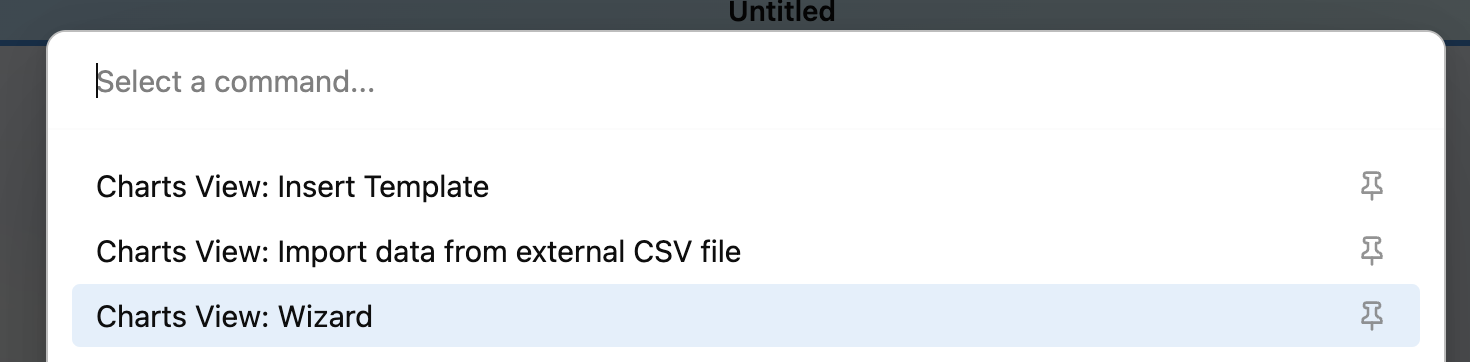
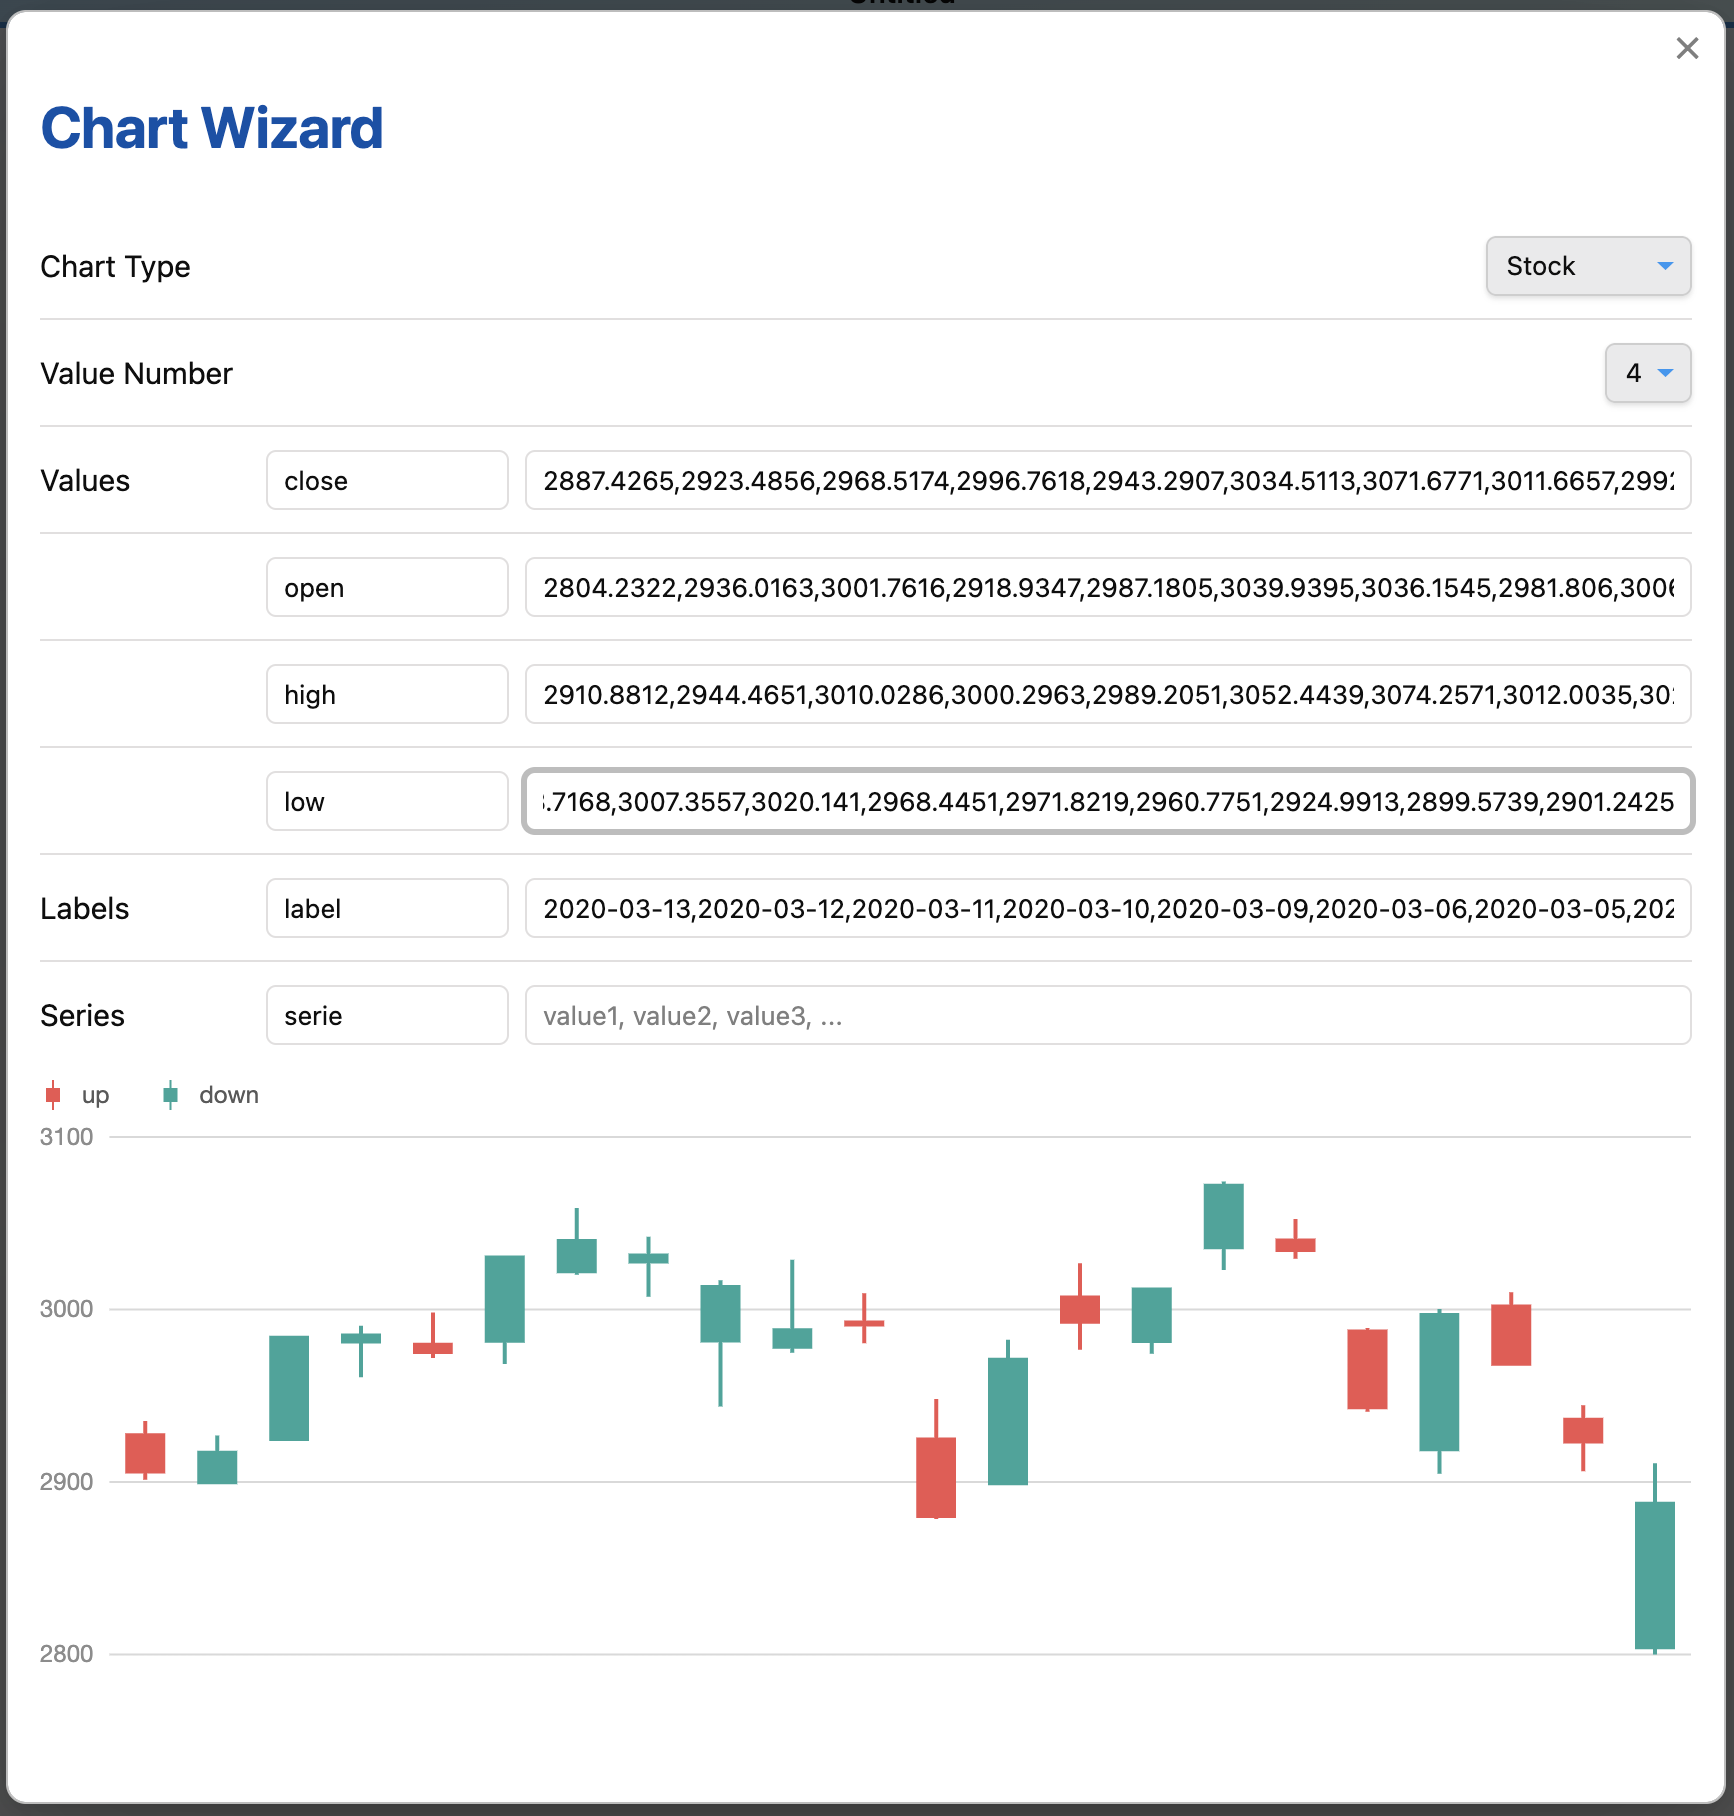
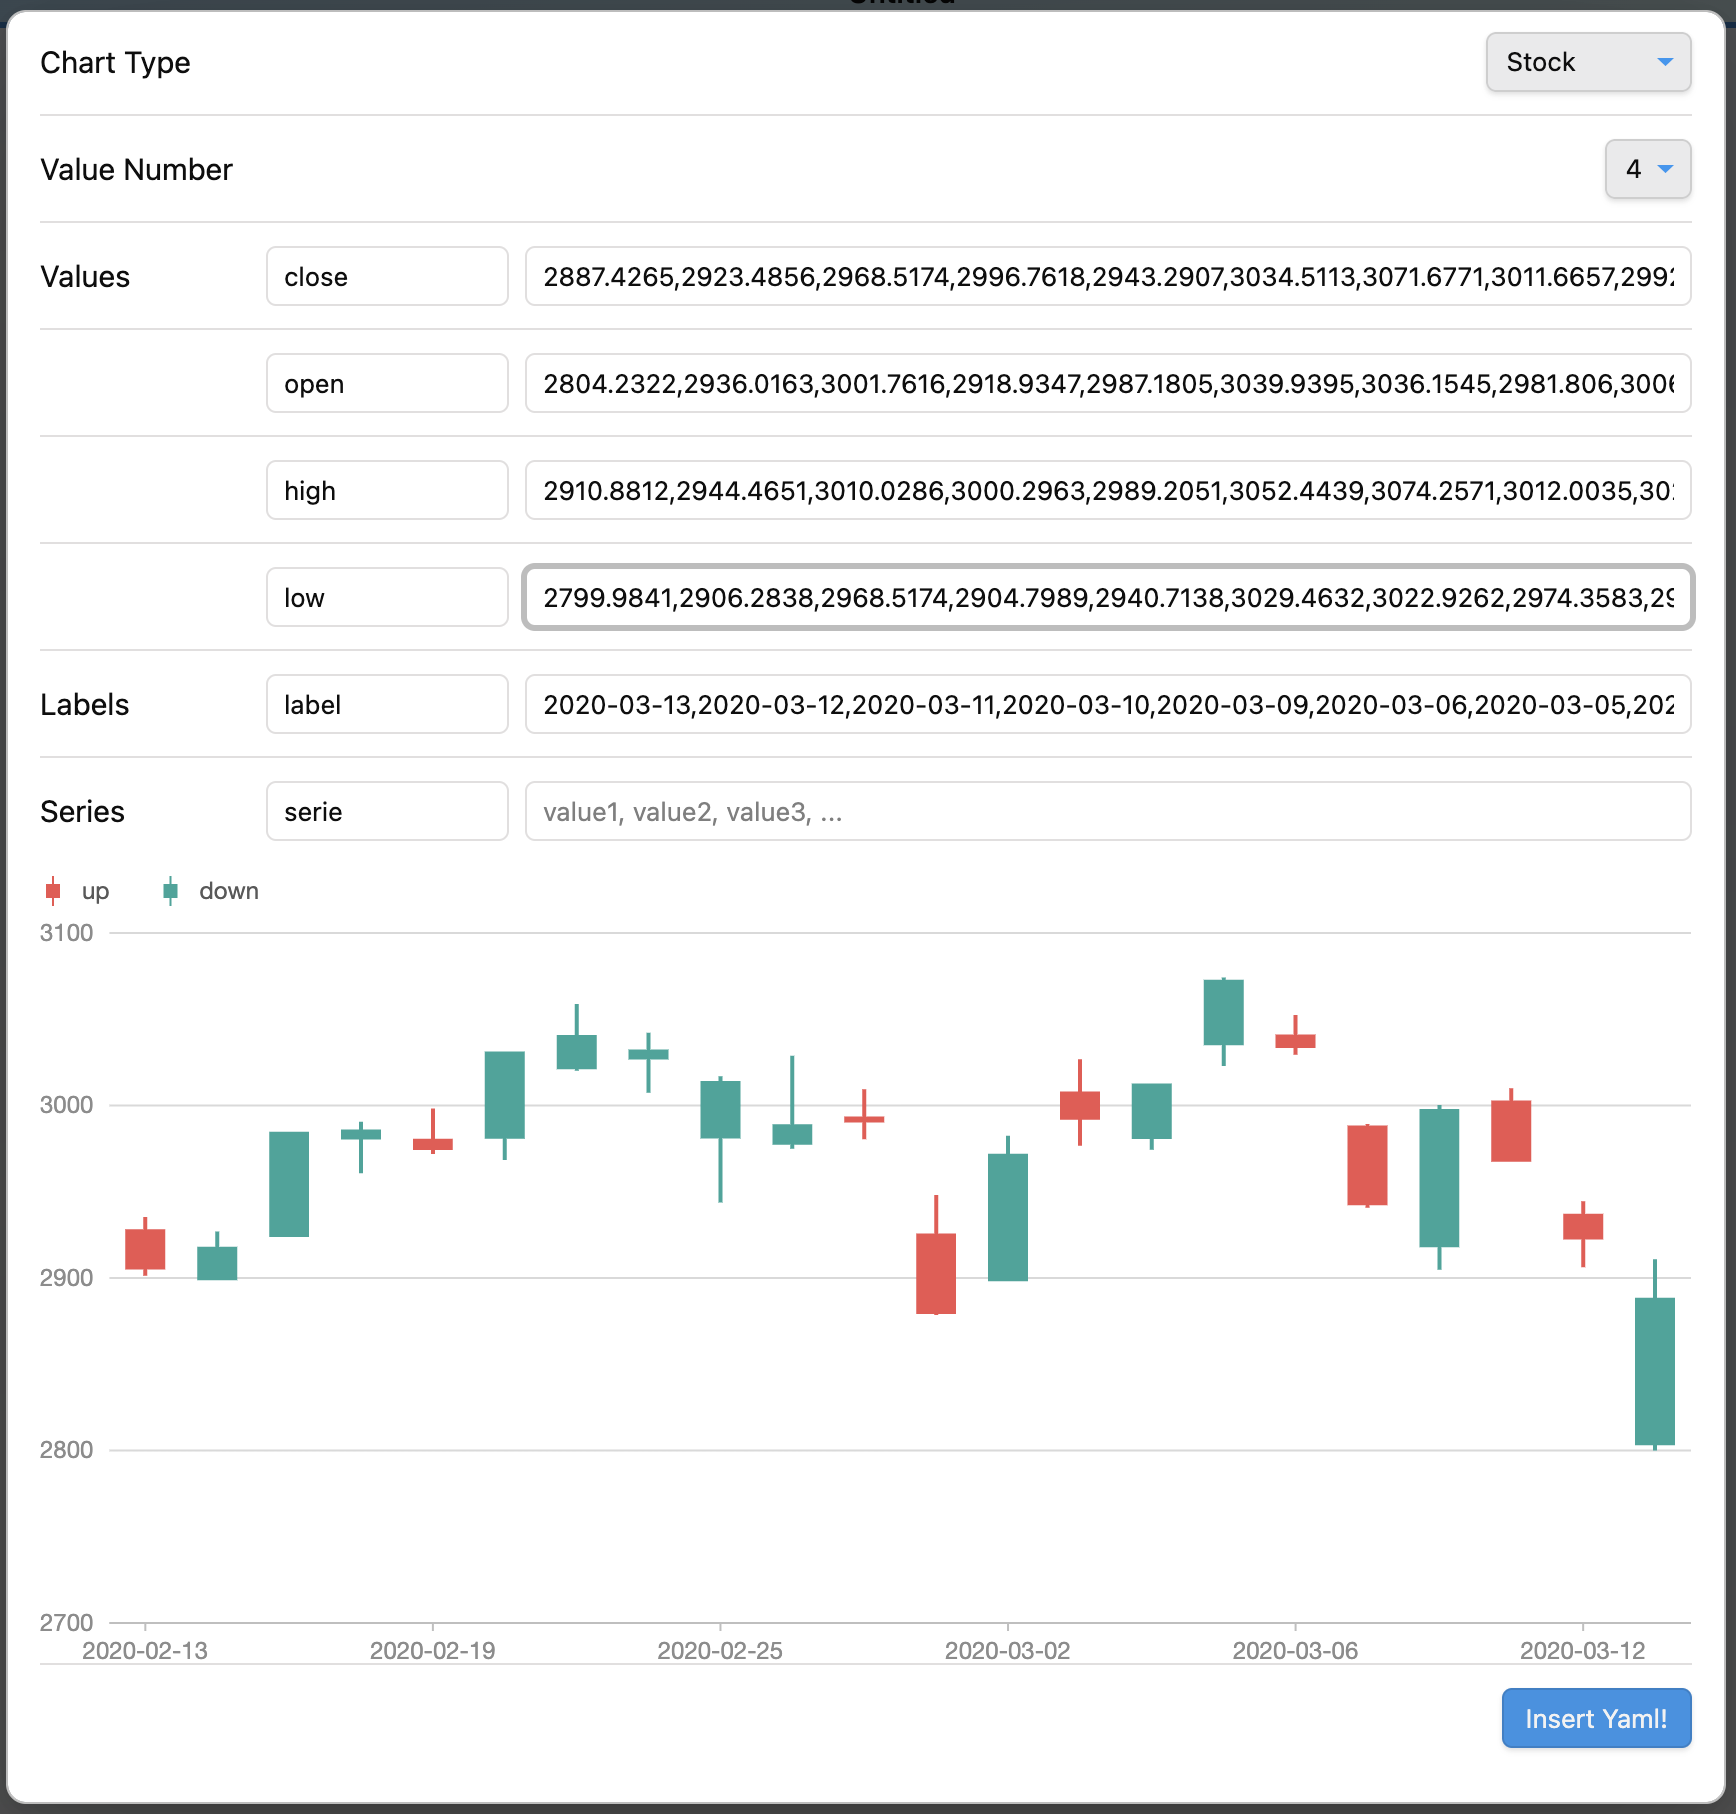
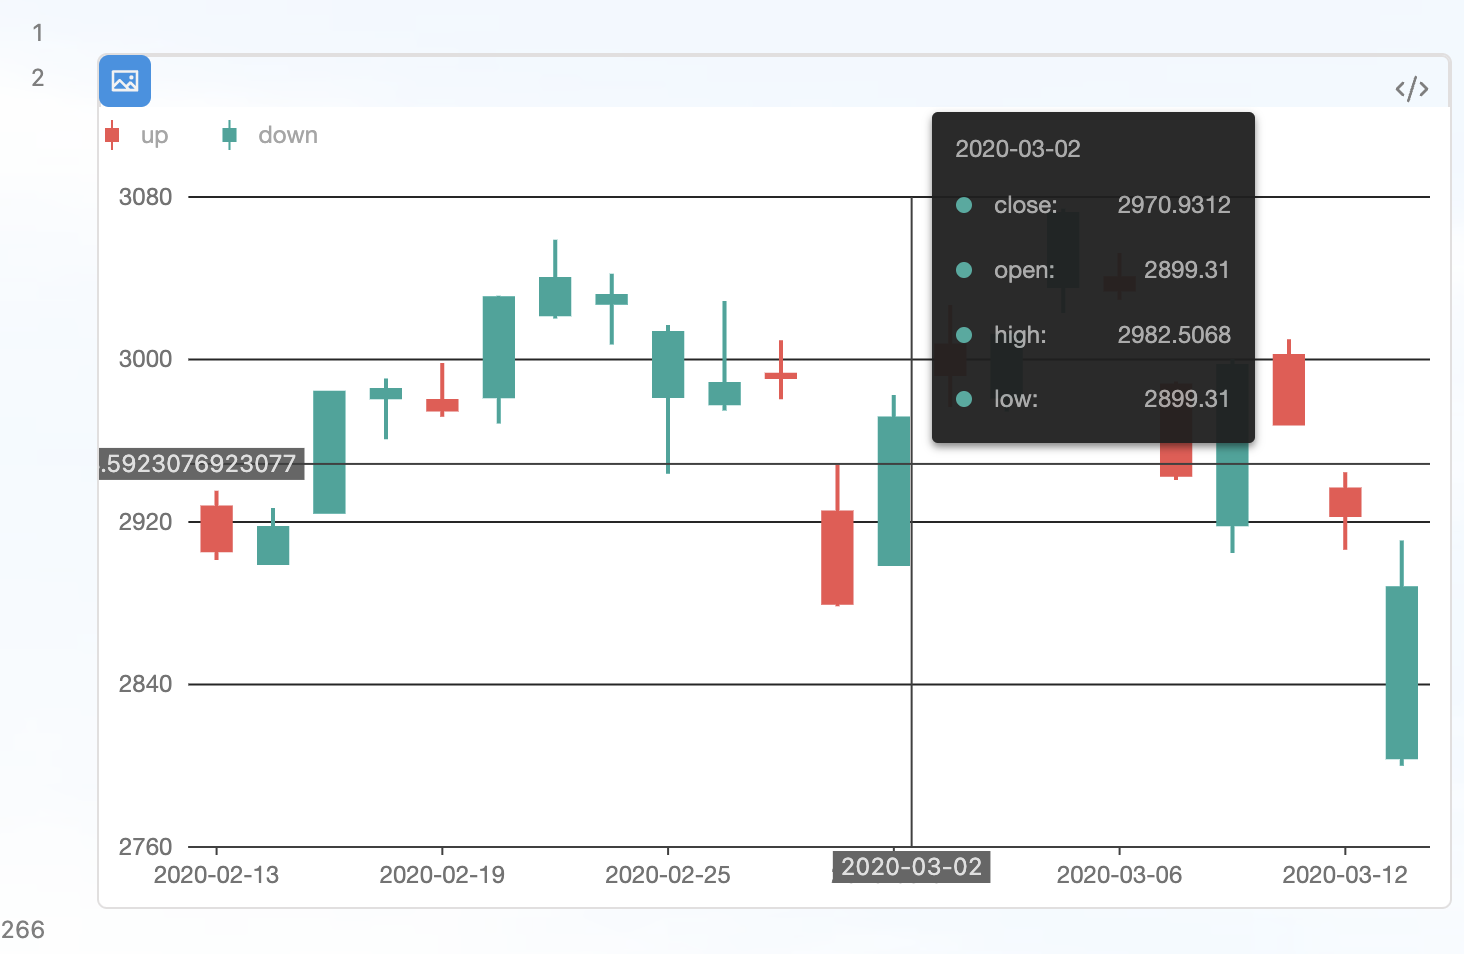
Use command Charts View: Wizard to insert code block.
Use command Charts View: Import data from external CSV file to insert data from CSV file.
Load CSV file from data path. Data path should be specified in settings.
#-----------------#
#- chart type    -#
#-----------------#
type: Mix

#-----------------#
#- chart data    -#
#-----------------#
data.area:
  - time: 1246406400000
    temperature: [14.3, 27.7]
  - time: 1246492800000
    temperature: [14.5, 27.8]
  - time: 1246579200000
    temperature: [15.5, 29.6]
  - time: 1246665600000
    temperature: [16.7, 30.7]
  - time: 1246752000000
    temperature: [16.5, 25.0]
  - time: 1246838400000
    temperature: [17.8, 25.7]

data.line: LineData.csv

#-----------------#
#- chart options -#
#-----------------#
options:
  appendPadding: 8
  syncViewPadding: true
  tooltip:
    shared: true
    showMarkers: false
    showCrosshairs: true
    offsetY: -50

options.area:
  axes: {}
  meta:
    time:
      type: 'time'
      mask: 'MM-DD'
      nice: true
      tickInterval: 172800000
      range: [0, 1]
    temperature:
      nice: true
      sync: true
      alias: '温度范围'
  geometries:
    - type: 'area'
      xField: 'time'
      yField: 'temperature'
      mapping: {}

options.line:
  axes: false
  meta:
    time:
      type: 'time'
      mask: 'MM-DD'
      nice: true
      tickInterval: 172800000
      range: [0, 1]
    temperature:
      sync: 'temperature'
      alias: '温度'
  geometries:
    - type: 'line'
      xField: 'time'
      yField: 'temperature'
      mapping: {}
    - type: 'point'
      xField: 'time'
      yField: 'temperature'
      mapping:
        shape: 'circle'
        style:
          fillOpacity: 1
#-----------------#
#- chart type    -#
#-----------------#
type: DualAxes

#-----------------#
#- chart data    -#
#-----------------#
data: DualAxesData.csv, DualAxesData.csv

#-----------------#
#- chart options -#
#-----------------#
options:
  xField: 'time'
  yField: ['value', 'count']
  yAxis:
    value:
      min: 0
      label:
        formatter:
          function formatter(val) {
            return ''.concat(val, '个');
          }
  geometryOptions:
    - geometry: 'column'
    - geometry: 'line'
      lineStyle:
	    lineWidth: 2
- dv.current()
- dv.pages(source?)
- dv.pagePaths(source?)
- dv.page(path)
- dv.array(value)
- dv.isArray(value)
- dv.date(text)
- dv.fileLink(path, embed?, display-name?)
- dv.date(pathlike)
- dv.query(source, settings?)
- dv.io
See Dataview Codeblock Reference
Enable the Search in Obsidian interaction when click a chart element by add an option enableSearchInteraction.
Use default:
#-----------------#
#- chart options -#
#-----------------#
options:
  ...
  enableSearchInteraction: true
or custom:
#-----------------#
#- chart options -#
#-----------------#
options:
  ...
  enableSearchInteraction:
    field: 'word'
    operator: 'path'
fieldindicate where to get keyword for search.operatorenums from Obsidian search opertaors:
| operator | Obsidian search opertaor |
|---|---|
default |
|
tag |
tag: |
path |
path: |
file |
file: |
task |
task: |
taskTodo |
task-todo: |
taskDone |
task-done: |
matchCase |
match-case: |
ignoreCase |
ignore-case: |
line |
line: |
block |
block: |
content |
content: |
section |
section: |
fileopen |
Open a file inside Vault |
See https://github.com/caronchen/obsidian-chartsview-plugin/wiki/Chart-examples
- Copy over
main.js,styles.css,manifest.jsonto your vaultVaultFolder/.obsidian/plugins/obsidian-chartsview-plugin/.