
Turn any dated note into a beautiful, interactive heatmap — habits, workouts, mood, finances, work logs, anything.


Website · Install · Quick start · Configuration · Export · FAQ · Example vault
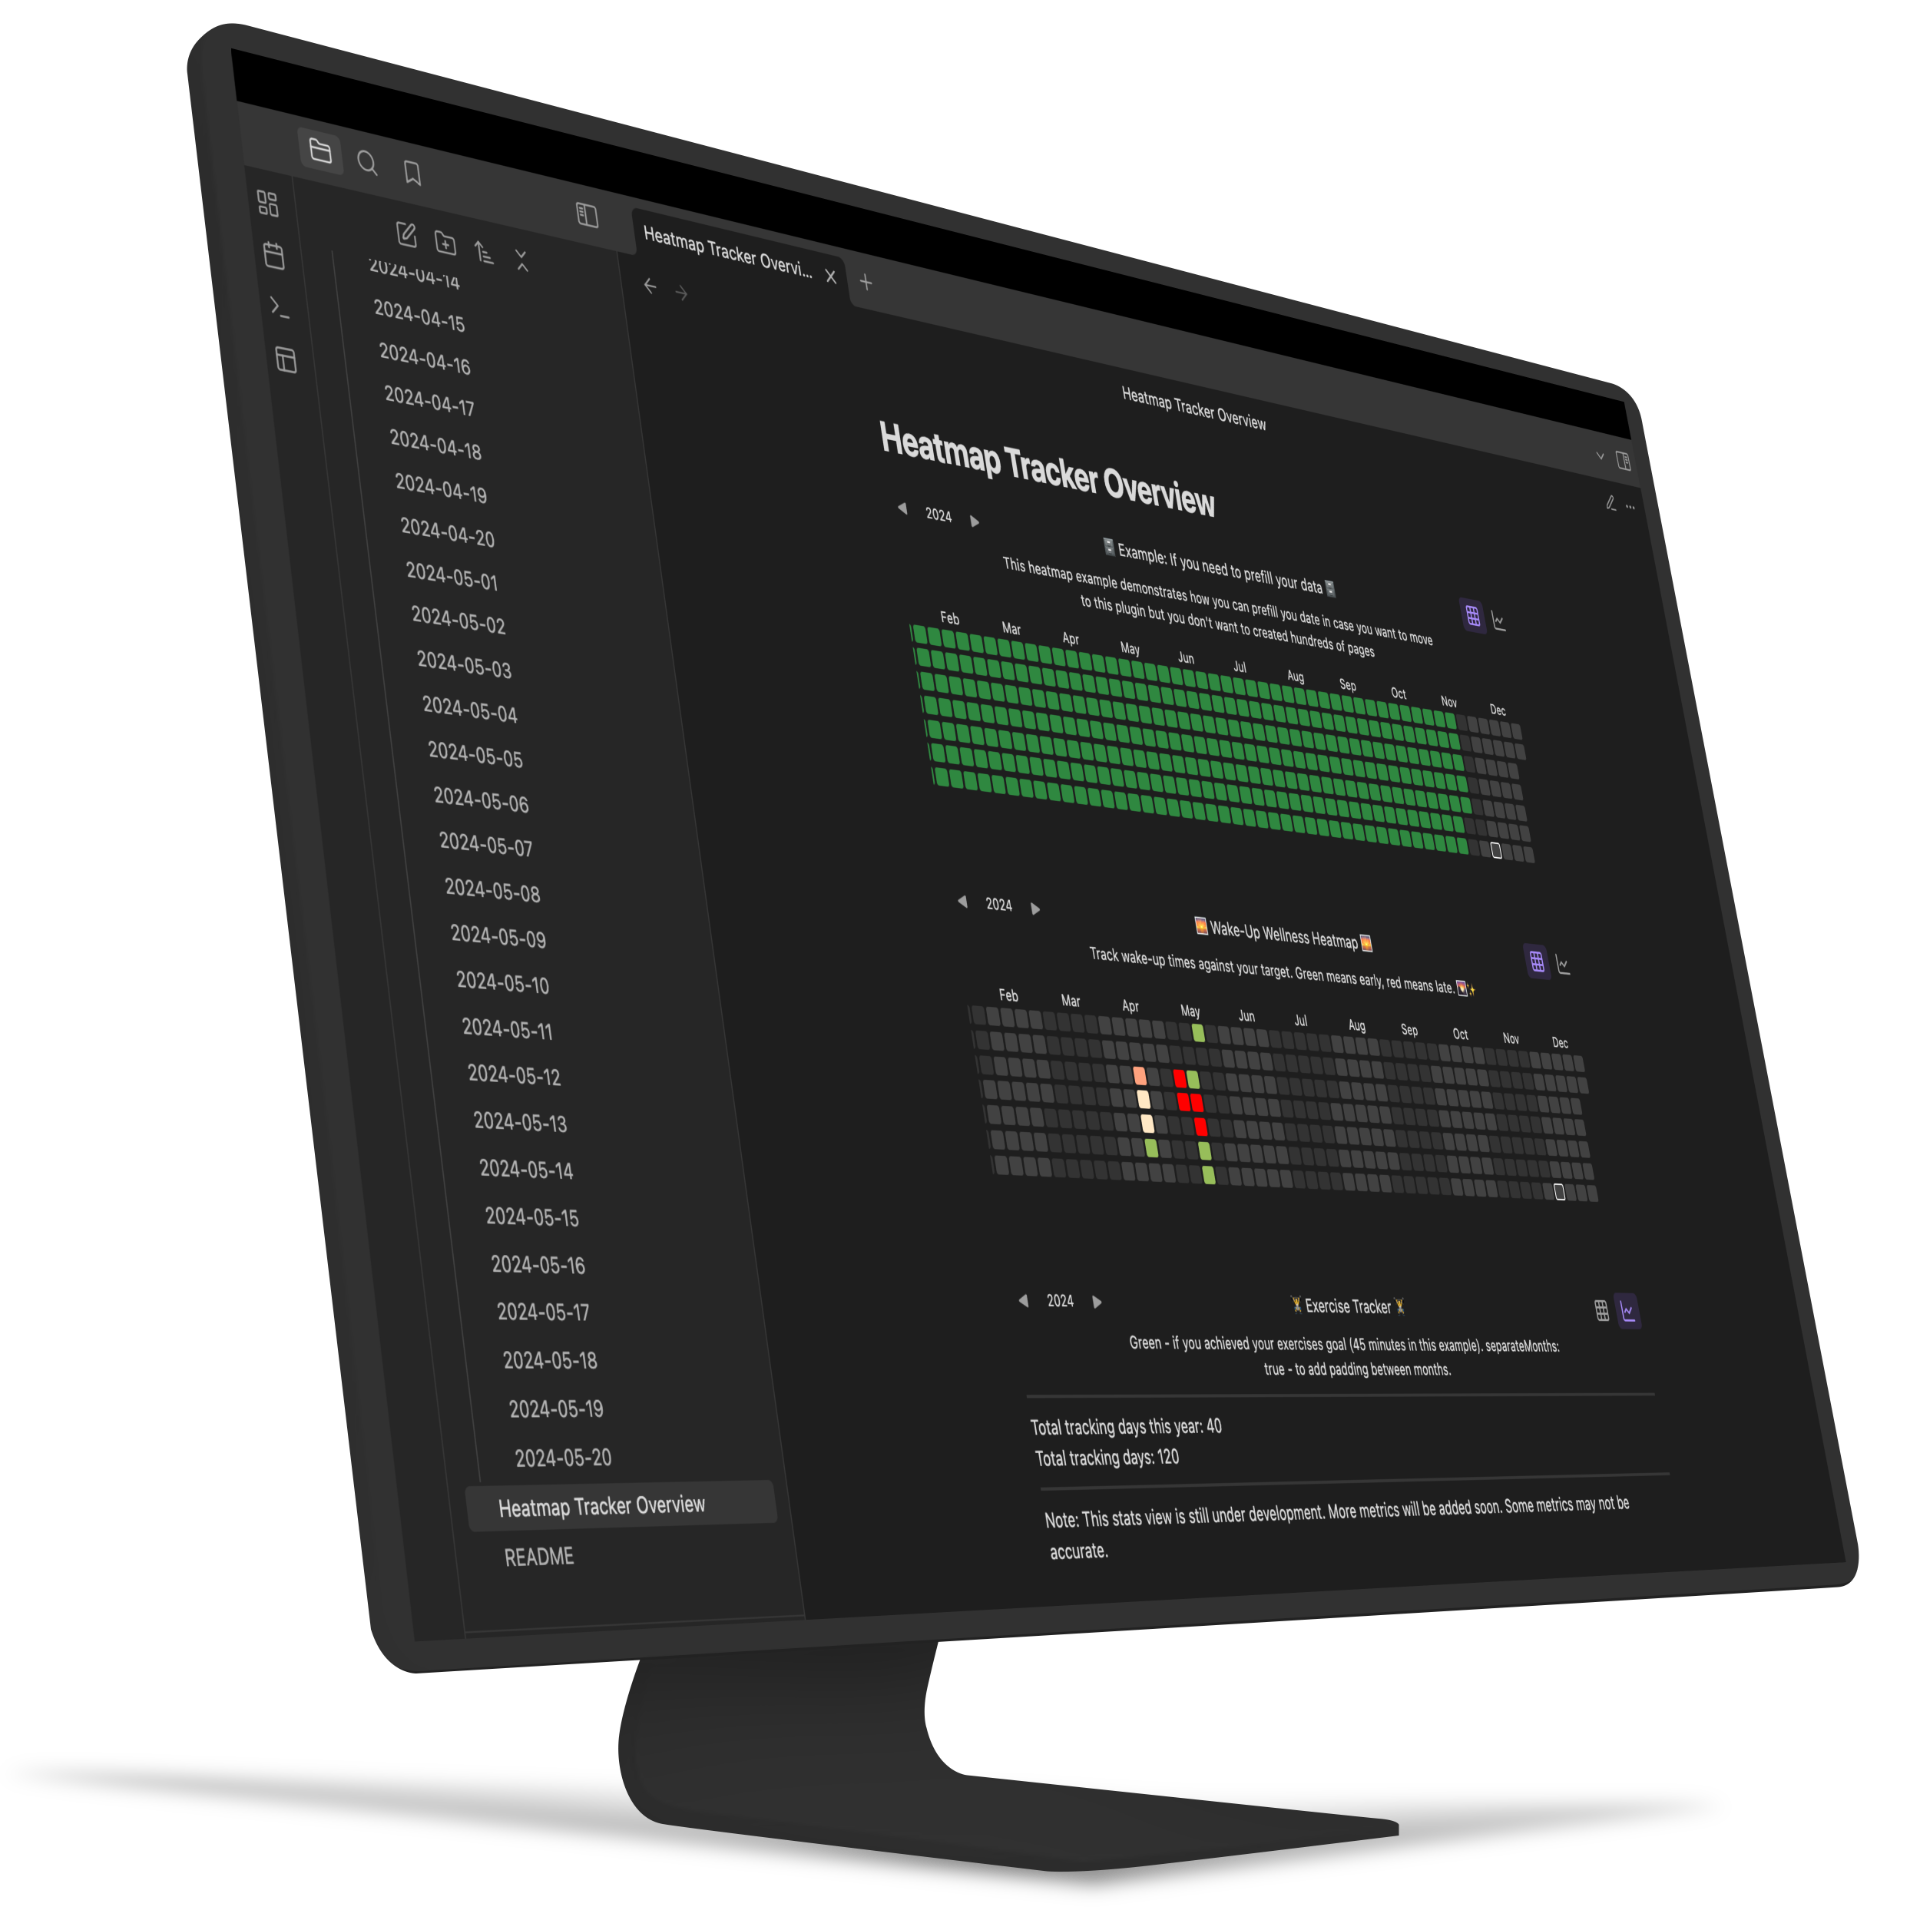
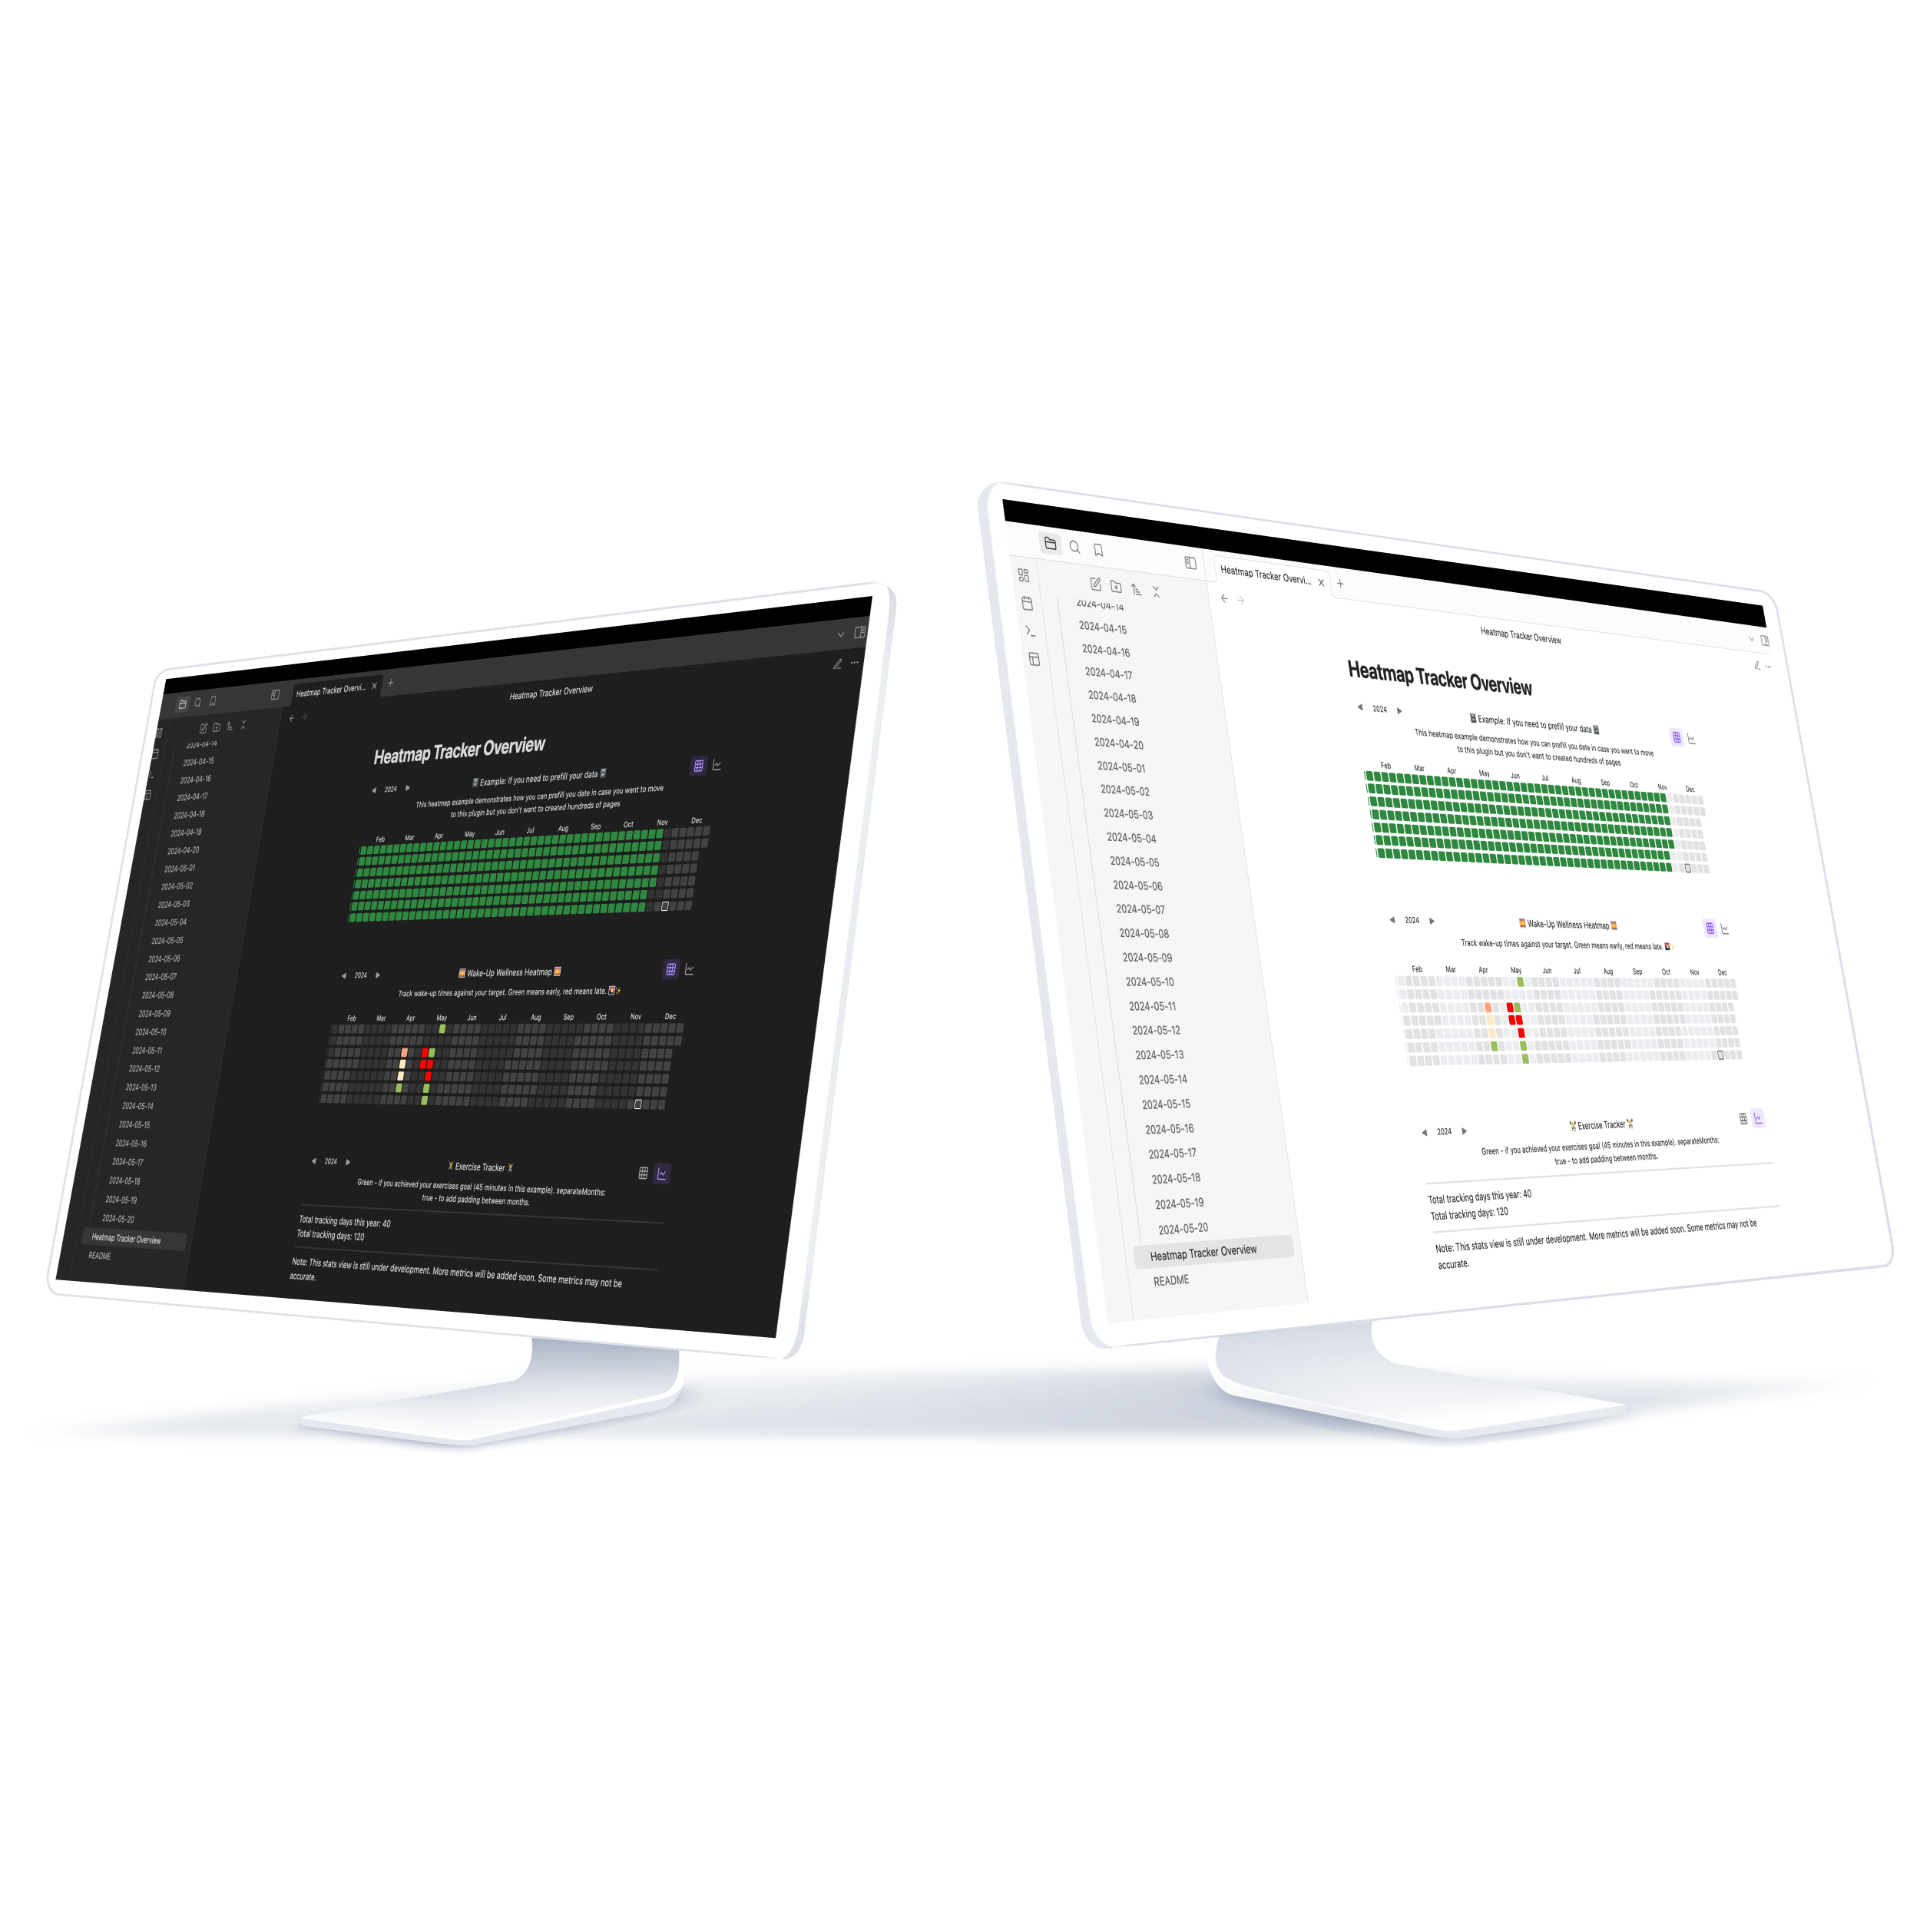
You already write things down in Obsidian. Heatmap Tracker reads those notes and turns them into a year-at-a-glance grid — the kind you know from GitHub's contribution graph, but for your data, in your vault, with no account and no cloud.
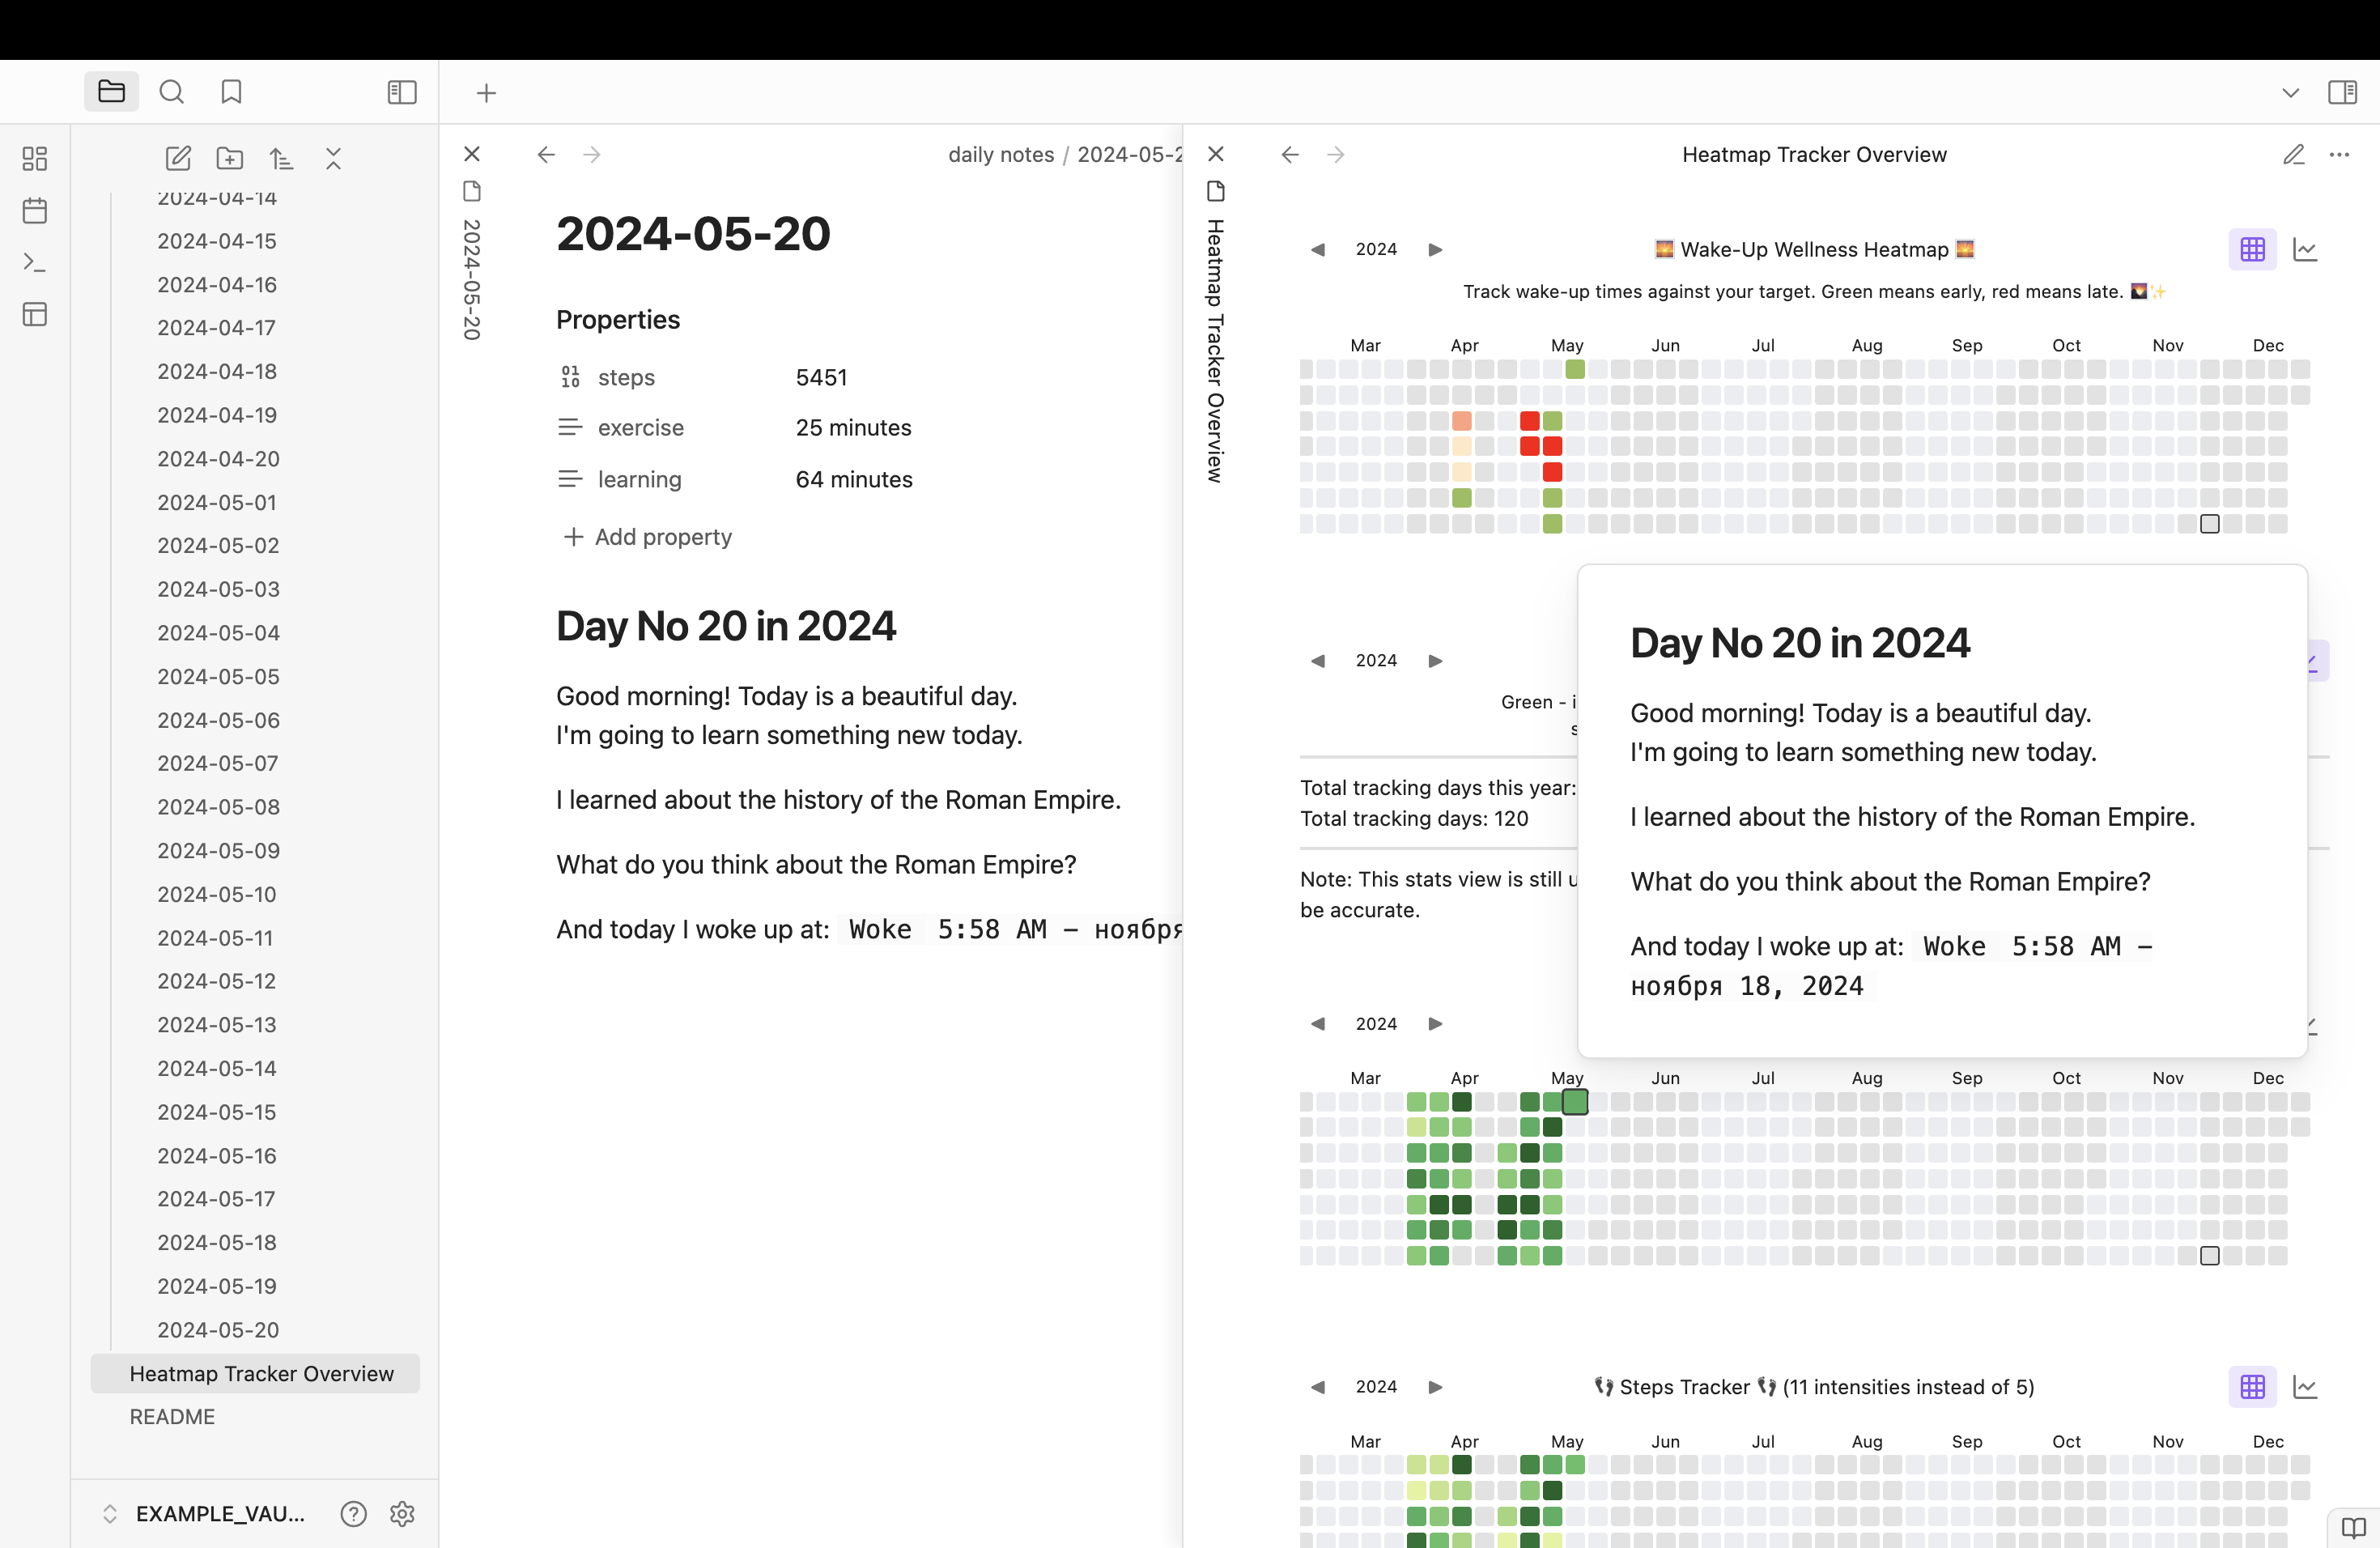
Add steps: 8420 to a daily note and you get a heatmap. Add mood: 4 and you get another. Every filled square is clickable and opens the note behind it; every empty square offers to create it.
- Zero-config for frontmatter. Run Insert Heatmap Tracker, fill in a form with a live preview, done — no YAML, no JavaScript. Every heatmap stays editable from the same form.
- Fully scriptable when you need it. A
dataviewjsescape hatch gives you complete control over the dataset. - Everything stays local. Your notes are the database.
- Install
- Quick start
- Use cases
- Codeblock usage
- Advanced usage (
dataviewjs) - Migrating from Heatmap Calendar
- Configuration reference
- Export a report
- Features
- FAQ & troubleshooting
- How it compares
- Development
- Contributing
- Support the project
- License & credits
- Open Settings → Community plugins and make sure Restricted mode is off.
- Click Browse, search for “Heatmap Tracker”.
- Click Install, then Enable.
Or open this link from inside Obsidian: Install Heatmap Tracker.
Heatmap Tracker uses Dataview to read data out of your notes. Install and enable it the same way. For the dataviewjs examples below, also enable Dataview → Settings → Enable JavaScript Queries.
- Download
main.js,styles.cssandmanifest.jsonfrom the latest release. - Put them in
<your-vault>/.obsidian/plugins/heatmap-tracker/. - Reload Obsidian and enable the plugin in Community plugins.
Install BRAT, then run BRAT: Add a beta plugin for testing and enter mokkiebear/heatmap-tracker.
Requirements: Obsidian 1.4.0+, desktop and mobile, Dataview plugin.
1. Put a value in a daily note. In 2026-08-04.md:
---
steps: 8420
---
Numbers work (steps: 8420), and so do booleans — meditated: true simply counts as 1.
2. Add the heatmap — use the modal. Run Insert Heatmap Tracker from the command palette, or click the Heatmap Tracker icon in the left ribbon. This is the recommended way to use the plugin: the form has a live preview, tells you how many notes currently match, and writes the codeblock for you. Everything beyond the essentials is tucked into collapsed sections, so you only see what you need.

Changed your mind later? Hover any rendered heatmap and click the pencil in its corner — the same form reopens with that heatmap's settings and rewrites its codeblock on save. No hand-editing YAML.
If you'd rather write it by hand, the codeblock is plain YAML:
```heatmap-tracker
property: steps
```
3. That's it. Switch years with the arrows, hover a square for details, click one to open the note.
Tip
The Example Vault is a full working vault you can open in Obsidian — copy-pasteable examples for every parameter, plus ready-made trackers for habits, mood, sleep, water intake and projects. It's updated often.
| Track | Frontmatter | Why a heatmap helps | |
|---|---|---|---|
| 🏃 | Fitness | exercise: 45 |
Spot the weeks you skipped, not just the total |
| 🧘 | Habits | meditated: true |
Streaks become visible — and hard to break |
| 😴 | Sleep | hours-slept: 7.5 |
See the slow drift before it becomes a problem |
| 🙂 | Mood | mood: 4 |
Correlate bad stretches with what else was happening |
| 💰 | Finance | spent: 120 |
A year of spending on one screen |
| 📚 | Reading | pages-read: 30 |
Small daily numbers add up visibly |
| 💧 | Water intake | water: 6 |
Zero-effort adherence check |
| 💼 | Work log | hours: 8 |
Export it as a report for your manager |
| 🤕 | Symptoms | headache: 3 |
Bring a real timeline to your doctor |
| ✅ | Projects | tasks-done: 5 |
Momentum, not just a burn-down |
Every one of these has a working example in the Example Vault.
The heatmap-tracker codeblock handles frontmatter tracking out of the box. The Insert Heatmap Tracker modal writes and edits it for you — the reference below is for anyone who prefers typing YAML, or wants to know what the modal produces.
```heatmap-tracker
property: exercise
```
This looks for exercise in your notes and lights up a square wherever it's set.
```heatmap-tracker
property: [running, cycling, swimming]
```
Values from all listed properties are aggregated into one heatmap.
path, tags and filters are all optional and can be combined:
```heatmap-tracker
property: exercise
path: "daily notes"
tags: [journal]
filters:
  - property: status
    operator: equals
    value: done
```| Parameter | Description |
|---|---|
property |
Frontmatter key (or array of keys) to read. Required. |
path |
Folder to search in. Unset → falls back to your Daily Notes folder, then the whole vault. |
tags |
Only include notes with at least one of these tags (leading # optional). |
filters |
Extra frontmatter conditions. All must match. |
Each filters entry takes:
property— the frontmatter key to check.operator—equals,contains, ornotEmpty.value— compared against the property's value (not needed fornotEmpty).
When you need full control over the dataset — computed values, external sources, custom colors per entry — use a dataviewjs codeblock:
```dataviewjs
// Update this object
const trackerData = {
    entries: [],
    separateMonths: true,
    heatmapTitle: "This is the title for your heatmap",
    heatmapSubtitle: "This is the subtitle for your heatmap. You can use it as a description.",
}

// Path to the folder with notes
const PATH_TO_YOUR_FOLDER = "daily notes preview/notes";
// Name of the parameter you want to see on this heatmap
const PARAMETER_NAME = 'steps';

// You need dataviewjs plugin to get information from your pages
for (let page of dv.pages(`"${PATH_TO_YOUR_FOLDER}"`).where((p) => p[PARAMETER_NAME])) {
    trackerData.entries.push({
        date: page.file.name,
        // Use absolute file path so clicks open the exact note
        // (matters when several notes share a name)
        filePath: page.file.path,
        intensity: page[PARAMETER_NAME],
    });
}

// Optional: set base path so new files are created here if missing
trackerData.basePath = PATH_TO_YOUR_FOLDER;

renderHeatmapTracker(this.container, trackerData);
```- If the entry has
filePath(page.file.path), that exact file opens. Missing? The plugin offers to create it at the same path. - Otherwise, if
trackerData.basePathis set, it proposes creating/openingbasePath/YYYY-MM-DD.md. - Otherwise it falls back to your Daily Notes settings (folder + format) via the Daily Notes API.
The note opens in the active tab; Cmd/Ctrl + click opens it in a new one, as elsewhere in Obsidian.
Note
dataviewjs requires Dataview → Settings → Enable JavaScript Queries. The plugin also works standalone with any JavaScript that can build an entries array — Dataview is just the most convenient source.
Coming from the unmaintained heatmap-calendar plugin? There is nothing to migrate:
- Install Heatmap Tracker.
- Disable Heatmap Calendar.
Your existing renderHeatmapCalendar(...) blocks keep working — Heatmap Tracker provides that function too and maps calendarData onto its own options. Named palettes from the old plugin's settings are read as well, so colors: "blue" still resolves.
Two differences worth knowing:
- Per-entry
coloris ignored. It named a whole color ramp, and which shade a day got was only decided after intensity mapping; those days now use the main palette. UsecustomColor: "#ff0000"for a fixed per-day color. defaultEntryIntensity,intensityScaleStartandintensityScaleEndstill work, but the current names areintensityConfig.defaultIntensity,.scaleStartand.scaleEnd.
Rewriting a block as renderHeatmapTracker(this.container, trackerData) gets you the rest: statistics, legend, month/week layouts, clickable squares.
The authoritative reference for every trackerData parameter. Each one links to a copy-pasteable example in the Example Vault.
| Parameter | Type | Default |
|---|---|---|
year |
number |
current year |
heatmapTitle |
string | number |
undefined |
heatmapSubtitle |
string | number |
undefined |
colorScheme |
object |
{ paletteName: "default", customColors: [] } |
entries |
array |
[] |
showCurrentDayBorder |
boolean |
true |
intensityConfig |
object |
see below |
basePath |
string |
undefined |
separateMonths |
boolean |
true |
disableFileCreation |
boolean |
false |
insights |
array |
[] |
ui |
object |
see below |
layout |
"default" | "monthly" | "month" | "week" |
"default" |
monthsToShow / daysToShow / startDate + endDate |
number / string |
undefined |
- Type:
number - Default: Current year (
new Date().getFullYear()) - Description: The year the heatmap displays by default.
- Example: year
- Type:
string | number - Default:
undefined - Description: Title displayed above the heatmap. Supports HTML for custom styling.
- Example: heatmapTitle
- Type:
string | number - Default:
undefined - Description: Subtitle/description displayed under the title. Supports HTML for custom styling.
- Example: heatmapSubtitle
- Type:
object - Default:
{
paletteName: "default",
customColors: []
}- Description: The color scale used to represent intensity levels. Each color maps to a range of data intensity. Use
paletteNameto reference a palette defined in plugin settings, orcustomColorsto pass your own array of colors inline. - Example: colorScheme
- Type:
string - Default:
undefined - Description: An entry property (set on an item inside
entries, not ontrackerDataitself). Sets the color for that specific entry, overridingcolorScheme.
- Type:
array - Default:
[
  { date: "1900-01-01", customColor: "#7bc96f", intensity: 5, content: "" }
]- Description: The list of data points. Each entry supports:
| Field | Description |
|---|---|
date |
Date of the entry (ISO string, YYYY-MM-DD — see Accepted date formats) |
intensity |
Data intensity for that date |
content |
Optional tooltip / note text |
customColor |
Overrides the color for this entry |
emoji |
A short glyph drawn inside the box, e.g. "✅" (max 8 chars) — see Emoji habit tracking |
filePath |
Absolute path to the file opened on click |
customHref |
Custom URL to open on click (takes precedence over filePath) |
- Example: entries
date is parsed by the plugin itself, so a note renders identically on desktop,
iOS and Android. Accepted:
| Format | Example |
|---|---|
YYYY-MM-DD / YYYY/M/D (recommended) |
2025-01-31 |
| ISO timestamp — the calendar date wins, any time or offset is ignored | 2025-01-31T23:59:59-05:00 |
| Month-first numeric, year last | 01-31-2025, 1/31/2025, 01.31.2025 |
| Day-first numeric, when the first number can't be a month | 31-01-2025 |
| English month names | Jan 31, 2025, 31 January 2025 |
Anything else (March 2025, 31.01.25, a raw Date object) is rejected and the
entry is dropped. Prefer YYYY-MM-DD: 01-02-2025 is read as January 2nd, which
is not what a European reader means by it.
Set emoji on an entry to draw a glyph inside that day's box. The box keeps its
palette color, so "which habit" and "how much" are readable at the same time —
useful for yes/no habits where a color gradient says little.
const trackerData = {
  entries: [],
  heatmapTitle: "Habits",
  colorScheme: { customColors: ["#c6e48b", "#7bc96f", "#239a3b"] },
};

for (const page of dv.pages('"Daily"').where(p => p.workout || p.reading)) {
  trackerData.entries.push({
    date: page.file.name,
    intensity: 1,
    emoji: page.workout ? "🏃" : "📖",
    filePath: page.file.path,
  });
}

renderHeatmapTracker(this.container, trackerData);
Notes:
-
Keep it to one glyph. The box is 12px by default, so the value is capped at 8 characters and validation rejects longer strings rather than drawing unreadable pixels. Use
contentfor text. -
emojiandcontentare different fields, and complement each other.emojiis the marker;contentis what happened that day. Onlycontentreaches the exported report and screen readers, so a glyph put incontentbecomes a lone "✅" in your report, while anemojileaves the report free for the real note text:{ date: "2025-01-01", emoji: "🏃", content: "5km, felt good" } // box shows 🏃 · report says "5km, felt good"
-
Two entries on one day: only one glyph fits, so the first
emojiset for that day is the one drawn. -
Any text works, not just emoji —
"✓","x"and"1"are all valid, and monochrome glyphs get a subtle outline so they stay legible on dark palette colors. -
The glyph is decorative: screen readers announce the date and value from the box's own label and skip it.
- Type:
boolean - Default:
true - Description: Highlights today's square with a border.
- Example: showCurrentDayBorder
- Type:
object - Default:
{
  scaleStart: undefined,
  scaleEnd: undefined,
  defaultIntensity: 4,
  showOutOfRange: true,
  excludeFalsy: undefined,
  aggregation: "sum"
}- Description: Configures how entry values map to colors.
| Field | Description |
|---|---|
scaleStart / scaleEnd |
Min/max of the intensity scale. Useful for a custom range — e.g. tracking reading time only between 30 minutes and 2 hours. |
defaultIntensity |
Intensity assigned to entries that don't specify one. |
showOutOfRange |
Whether entries outside the scale are still shown (clamped) or hidden. |
excludeFalsy |
When true, entries with falsy intensity (0, undefined, null, false) are excluded and don't break streaks. |
aggregation |
How a day is scored when several values feed into it — several tracked properties, or several entries on the same date. "sum" (default) adds them; "average" divides by how many values were actually present. |
aggregation: "average" is for days scored on a rating rather than a total. Tracking hunger-morning and hunger-evening, each 1–10, a day with only a morning entry of 6 sums to 6 out of a possible 20 and renders almost empty; averaged, it scores 6 — the same shade as a day where both readings were 6. Only the values that exist count towards the divisor, so a missing entry doesn't drag the day down:
```heatmap-tracker
property:
  - hunger-morning
  - hunger-evening
intensityConfig:
  aggregation: average
  scaleStart: 1
  scaleEnd: 10
```
Keep the default "sum" for anything cumulative (minutes practised, pages read, steps) — there, two entries on one day genuinely are more than one.
- Example: intensityConfig
Important
Migrating from defaultEntryIntensity / intensityScaleStart / intensityScaleEnd: these top-level parameters are removed from the API described here. Old codeblocks keep working (they're folded into intensityConfig automatically), but new heatmaps should use intensityConfig directly.
- Type:
string - Default:
undefined - Description: Base folder used to collect entries. When set, the plugin proposes creating new files here when you click an empty square.
- Example: basePath
- Type:
boolean - Default:
true - Description: Whether months are visually separated within the heatmap layout.
- Example: separateMonths
- Type:
boolean - Default:
false - Description: When
true, clicking an empty square will not offer to create a new file. - Example: disableFileCreation
- Type:
array - Default:
[] - Description: Define your own calculated metrics, displayed in the Statistics tab — most productive day, longest streak, total pages read, average sleep, and anything else you can compute.
- Example: insights · 8 ready-made insights
- Type:
object - Default:
{ defaultView: "heatmap-tracker", hideTabs: false, hideYear: false, hideTitle: false, hideSubtitle: false } - Description: Per-heatmap chrome. Each key hides a part of the header, or picks which tab opens first — useful for embedding a bare grid in a dashboard note.
| Key | Type | Description |
|---|---|---|
defaultView |
"heatmap-tracker" | "heatmap-tracker-statistics" | "legend" | "documentation" | "export" |
Which tab is shown when the note opens. |
hideTabs |
boolean |
Hides the tab strip entirely. |
hideYear |
boolean |
Hides the year and the arrows that page through years. |
hideTitle |
boolean |
Hides heatmapTitle. |
hideSubtitle |
boolean |
Hides heatmapSubtitle. |
showWeekNums |
boolean |
Shows week numbers under the grid. Overrides the plugin-wide setting for this heatmap only. |
ui:
  hideTabs: true
hideYear: true-
Type:
"default" | "monthly" | "month" | "week" -
Default:
"default" -
Description: Controls the grid arrangement.
"default"— the traditional GitHub-style week-column grid."monthly"— one row per month with days 1–31 as columns; a compact, calendar-style year."month"— a single calendar month: weekdays as columns, weeks as rows. Shows the current month by default; the header arrows page through months."week"— a single calendar week: one row of seven days. Shows the current week by default; the header arrows page through weeks.
"month"and"week"respect theweekStartDayplugin setting. Setting a date range (startDate/endDate,daysToShow,monthsToShow) pins them to that range and hides the arrows. -
Example: layout
These four parameters narrow which dates are displayed instead of the full year. They apply to every layout, including the default week-column grid — which then starts at the range's first day and ends at its last, rather than drawing the whole calendar year. Only one wins when several are set — they resolve in this order (highest priority first):
monthsToShow(number, defaultundefined) — current month plus the N previous months.monthsToShow: 3displays 4 rows (current month + 3 prior). Best paired withlayout: "monthly".daysToShow(number, defaultundefined) — the last N days ending today.daysToShow: 365with the default layout gives a rolling year ending on the current week, GitHub-style.startDate+endDate(string,YYYY-MM-DD, defaultundefined) — an explicit range. Both must be set, andstartDatemust not be afterendDate.
If none are set, the heatmap shows the full year.
This precedence is implemented once, in resolveDateRange — that function's doc comment is the source of truth if this section and the code ever disagree.
- Example: Date range parameters
Every heatmap has an Export tab alongside Heatmap Tracker / Statistics / Legend / Documentation. It turns your tracked data and daily notes into a single shareable report — a status update, a work log for a manager, an end-of-year summary — sitting between a bare calendar (too little context) and a folder of raw notes (too much noise).
Note content, aggregated. Below the calendar and legend, the report walks every week and day in range and pulls in that day's own note content — frontmatter stripped, bullet points kept as written, a day with no note showing - — grouped under "Week of …" and per-day headings. The reader gets everything that actually happened, day by day, in one document instead of clicking through each note.
Layout. "Weeks as columns" or "Weeks as rows", rendered pixel-for-pixel like the heatmap itself — including exact day-level month splitting (with a year label whenever the range crosses a year boundary) and, when a range is too wide or tall for one grid, automatic wrapping into multiple bands, evenly split rather than front-loading one band and leaving a small leftover.
Date range. Pick start/end dates directly, or jump to a range with a preset: Logged (the full span of your tracked data), Last year, Year to date, Last month, or Month to date.
Display options. Which day the week starts on, whether to show each week's start date, splitting the grid by month, month labels, and hiding weekends.
Legend editor. Colors are pre-populated from what's actually used in your data, so you only fill in what each one means. Reorder entries by drag-and-drop and toggle each category's visibility — shown everywhere, summary-only, or hidden entirely. Optionally combine the intensity colors into a single gradient swatch with one shared label and count, instead of a row per color.
Summary line. A compact, customizable breakdown like Workday: 22 · Leave: 1 · Rest day but worked: 1 with a total (e.g. Total hours: 169) — or hide the breakdown, the total, or all values entirely.
Output. Save as a Markdown note or a self-contained HTML file, to whichever folder in your vault you choose.
All of these preferences persist across sessions, so you only set them up once.
Create and edit without writing YAML — the recommended way to use the plugin
Insert Heatmap Tracker (command palette or ribbon icon) opens a form with a live preview of the actual heatmap and a count of how many notes currently match your property, folder and tags — so a misspelled property name is obvious immediately rather than looking like an empty year.
Only the essentials are shown up front (properties to track, folder, title); filtering, layout, appearance, intensity and visibility live in collapsed sections.
Every rendered heatmap has a pencil button in its corner: it reopens the same form pre-filled from that codeblock and rewrites it on save.
Easy switching between years — render a dynamic heatmap for any year
Left and right navigation arrows let you move across years effortlessly, so multi-year data is always one click away.
Customizable colors and intensity — match the heatmap to your data's meaning
Three levels of control, from broad to specific:
- Create your own palette in plugin settings (or use the default).
- Use
customColorsincolorSchemeto set colors for one specific heatmap. - Use
customColoron an individual entry.

User-defined insights — analyze data in the ways that matter to you
Define metrics like:
- The most productive day
- The longest streak without breaks
- The most active month
- Your average daily intensity
See insights documentation and 8 worked examples.
Monthly separation — visually separate months for better clarity
Toggle
separateMonths to add padding between months so month boundaries are unmistakable.
Monthly layout — a compact calendar with one row per month
Set
layout: "monthly" to switch from the GitHub-style grid to a calendar-style view with days 1–31 as columns. Combine with monthsToShow to display only recent months.
Single month or week — a wall-calendar view of the current period
Set
layout: "month" for one calendar month (weekdays as columns, weeks as rows) or layout: "week" for a single row of seven days. Both start on the current period and the header arrows page through it.
Statistics view — track progress with an integrated statistics panel
Totals, streaks and your own custom insights, in a dedicated tab next to the heatmap.
Export a report — turn tracked data and notes into shareable Markdown or HTML
The Export tab renders a grid matching your heatmap exactly, then aggregates each day's note content underneath it, grouped by week — plus a customizable legend, summary line, and date-range presets. See Export a report.
Localization — available in 9 languages
English, German, Russian, Chinese, Hindi, Spanish, French, Portuguese and Polish. See src/localization/locales for the current list, and docs/add-new-language.md if you'd like to contribute a translation.
Week numbers — display week numbers alongside the heatmap
Show all weeks, only even, only odd, or none — configurable in plugin settings.
Insert Heatmap Tracker command — add a tracker without writing YAML
An interactive modal builds the codeblock for you and inserts it at the cursor.
Customizable font — use your favorite typeface
Set the font in plugin settings, and use
HTML in titles and subtitles for further styling.

My heatmap is empty / nothing renders
Work through these in order:
- Is Dataview installed and enabled? Heatmap Tracker reads your notes through Dataview. Without it, there's no data to draw.
- Does the property actually exist in your notes? Property names are case-sensitive.
photo-takingandPhoto-Takingare different keys. - Are your notes in the searched folder? Without
path, the plugin falls back to your Daily Notes folder. If your notes live elsewhere, setpathexplicitly. - Is the year right? The heatmap defaults to the current year. If your data is from last year, use the arrows or set
year. - Check the console.
Ctrl+Shift+I(Windows/Linux) orCmd+Option+I(Mac) opens devtools — a missingpropertyparameter logs a warning there.
My dataviewjs block does nothing
JavaScript queries are off by default. Enable Dataview → Settings → Enable JavaScript Queries, then reload the note.
Dates are off by one day
This is almost always a timezone issue with how dates are parsed. Use plain YYYY-MM-DD strings for date rather than JavaScript Date objects or full ISO timestamps with a time component. If you're pulling from page.file.name on daily notes named YYYY-MM-DD.md, you're already doing the right thing.
The heatmap looks different on my phone than on my desktop
The plugin renders from the same data on every platform, so a difference almost always means some entries are being dropped on one of them — check the date format against Accepted date formats, and switch to YYYY-MM-DD if you're using anything else.
Historically this was the cause of #29: dates were handed to the JavaScript engine's own parser, which accepts different formats on desktop (Electron/V8) and on iOS (WebKit/JavaScriptCore), so 01-31-2025 worked on a Mac and silently produced an empty heatmap on an iPhone. Dates are now parsed by the plugin itself and behave the same everywhere.
Still different after fixing the format? Please open an issue with your codeblock and the Obsidian version on both devices.
Clicking a square opens the wrong note
If several notes share a filename, pass an absolute path so there's no ambiguity:
filePath: page.file.path // not page.file.nameClicking an empty square asks to create a file, and I don't want that
Set disableFileCreation: true on your trackerData.
Boolean properties — how are they counted?
true counts as 1, so meditated: true gives you a filled square. false counts as 0; combine with intensityConfig.excludeFalsy: true if you want those days treated as untracked rather than as zero.
Can I show several properties in one heatmap?
Yes — pass an array: property: [running, cycling, swimming]. Values are aggregated.
All my squares are the same color
Your values probably fall into a single bucket of the intensity scale. Set intensityConfig.scaleStart and scaleEnd to bracket the range you actually care about — e.g. scaleStart: 30, scaleEnd: 120 for reading minutes.
Does this work on mobile?
Yes. The plugin is not desktop-only and works on Obsidian mobile.
Does my data leave my vault?
No. Everything is computed locally from your notes. There's no account, no sync, no telemetry.
Can I use it without Dataview?
The heatmap-tracker codeblock needs Dataview. But renderHeatmapTracker(container, trackerData) accepts any entries array, so any JavaScript that can build that array works — Dataview is simply the most convenient source.
Still stuck? Open an issue — include your codeblock, a sample note's frontmatter, and your Obsidian and plugin versions.
Heatmap Tracker began as a rewrite of the excellent heatmap-calendar-obsidian by Richardsl, and grew from there.
| Heatmap Tracker | heatmap-calendar-obsidian | |
|---|---|---|
| Codeblock without JavaScript | ✅ heatmap-tracker block |
❌ dataviewjs required |
| Interactive insert command | ✅ Modal builder | ❌ |
| Statistics & custom insights | ✅ | ❌ |
| Monthly (calendar) layout | ✅ | ❌ |
| Single month / week view | ✅ | ❌ |
| Flexible date ranges | ✅ Days, months, explicit range | ❌ Full year |
| Export to Markdown / HTML | ✅ | ❌ |
| Localization | ✅ 9 languages | ❌ |
| Click to open and create notes | ✅ | Partial |
| Actively maintained | ✅ | Limited |
If all you need is a one-year contribution grid from a dataviewjs script, the original is lighter. If you want tracking, statistics, reports and a no-code path, this is the one.
Have an idea? Open an issue — feature requests genuinely shape this project.
New to the codebase? ARCHITECTURE.md maps how data flows from a codeblock or dataviewjs script through to the rendered heatmap.
git clone https://github.com/mokkiebear/heatmap-tracker.git
cd heatmap-tracker
npm install
npm run dev
npm run dev starts the TS→JS transpiler and copies the generated JS/CSS/manifest into the example vault whenever they change. The hot-reload plugin — already installed in EXAMPLE_VAULT — then reloads Obsidian automatically, so you don't restart after every change.
If hot-reload isn't picking up changes, add an empty
.hotreloadfile toEXAMPLE_VAULT/.obsidian/plugins/heatmap-tracker/.
| Command | What it does |
|---|---|
npm run dev |
Watch mode + copy into the example vault |
npm run build |
Production build, ready for distribution |
npm test |
Run the Jest test suite |
npm run test:coverage |
Tests with a coverage report |
npm run test:utc / test:usa |
Run tests under specific timezones |
npm run lint / lint:fix |
ESLint |
npm run type-check |
TypeScript, no emit |
npm run format / format:check |
Prettier |
Stack: TypeScript · Preact · esbuild · Jest · Zod
Tip: Ctrl+Shift+I opens devtools inside Obsidian.
Further reading: style guide · adding a language · releasing
Contributions are welcome and appreciated — code, docs, translations, bug reports, or just telling me how you use it.
- 🐛 Report a bug
- 💡 Request a feature
- 🌍 Add a translation — a single JSON file
- 📖 Improve the docs or the Example Vault
- 🔧 Open a pull request
Read CONTRIBUTING.md before you start, and note that this project ships a Code of Conduct. Security issues go through SECURITY.md.
Heatmap Tracker is free and open source, built and maintained in my own time. If it's useful to you, the cheapest way to help is a ⭐ on the repo — it's how other people find the plugin.


Licensed under the Apache License 2.0.
Built by Maksim Rubanau and contributors.
Inspired by heatmap-calendar-obsidian by Richardsl. Powered by Obsidian Dataview.